(2) IAS, CNRS, Université Paris Sud, F-91405 Orsay, France, verstra@ias.fr, leger@ias.fr
(3) Astronomy Dept., Ohio State University, 140 West 18th Avenue, Columbus OH 43210, USA, sellgren@astronomy.ohio–state.edu
(4) Institut für PAH-Forschung, Flurstrasse 17, 86926 Greifenberg, Germany
New PAH mode at 16.4 m ††thanks: based on observations with ISO, an ESA project with instruments funded by ESA Member States (especially the PI countries: the United Kingdom, France, the Netherlands, Germany), and with the participation of ISAS and NASA.
Abstract
The detection of a new 16.4 m emission feature in the ISO-SWS spectra of NGC 7023, M17, and the Orion Bar is reported. Previous laboratory experiments measured a mode near this wavelength in spectra of PAHs (Polycyclic Aromatic Hydrocarbons), and so we suggest the new interstellar 16.4 m feature could be assigned to low-frequency vibrations of PAHs. The best carrier candidates seem to be PAH molecules containing pentagonal rings.
Key Words.:
Interstellar medium: molecules, extinction1 Introduction
The launch of ISO (Infrared Space Observatory, Kessler et al. 1996) has vastly improved our ability to explore the spectral range beyond 13 m, which is blocked by atmospheric absorption. Airborne or spaceborne mid-infrared spectrometers prior to ISO did not have the sensitivity to determine whether the carriers of the Aromatic Infrared Bands (AIBs), observed in the interstellar medium (ISM) between 3 and 13 m, also emit at longer wavelengths.
The lack of interstellar data on possible AIBs at 13 – 25 m meant that laboratory spectroscopy of interstellar analogs in this spectral range was scanty. The hypothesis that polycyclic aromatic hydrocarbons (PAHs) are responsible for the AIBs (Léger and Puget 1984, Allamandola et al. 1985), has led much laboratory work to focus on PAHs. Spectra longward of 13 m were initially published for a limited sample of small PAH molecules (Léger et al. 1989a; Karcher et al. 1985; Allamandola et al. 1989). Recently a more extensive laboratory study (Moutou et al., 1996) has shown that PAH spectra contain common vibrational frequencies, namely near 16.2, 18.2, 21.3 and 23.2 m (617, 550, 470 and 430 cm-1). These frequencies where many species exhibit an absorption mode should correspond to modes with a higher probability of detection in the ISM. The IR spectra of many neutral and ionized PAHs isolated in Argon matrices have also been recently reported (Hudgins and Sandford 1998a,b,c).
Small particles such as PAHs in the ISM are believed to emit when they are heated to high temperatures by transient heating (Sellgren 1984), while laboratory absorption spectra are measured at lower temperature. This results in band broadenings and wavelength shifts of the interstellar emission features compared to the laboratory absorption features. The central wavelengths of PAH vibrational bands are observed to increase with temperature, and anharmonicity as well as mode couplings contribute to the broadening (Joblin et al. 1995). We have used the results of Joblin et al. (1995) to correct the measured central wavelengths of features under laboratory (absorption at lower temperature) conditions to the expected wavelengths under astronomical (emission at higher temperature) conditions.
In this paper, we compare the laboratory measurements of PAHs in the 14 – 25 m domain to astronomical spectra obtained by ISO.
2 Observations
High-resolution Short Wavelength Spectrometer (SWS) spectra (de Graauw et al. 1996) of NGC 7023, M17, and the Orion Bar were obtained with ISO in a 14′′27′′ beam. The data reduction was carried out with SWS-IA (update: October 1997). Bands 3A (12.0 – 16.5 m) and 3C (16.5 – 19.5 m) are subject to fringing (Schaeidt et al. 1996). Fringes were removed by subtracting a sine function, whose amplitude and phase were determined by least-squares fitting, from the high-frequency part of each detector scan. The order edge between bands 3A and 3C occurs at 16.5 m, and is visible in Figure 1. A detailed description of the data reduction scheme is given in Moutou et al. (1999).
2.1 NGC 7023
We observed the bright reflection nebula NGC 7023 at a position 27′′ W 34′′ N of its illuminating star HD 200775. The SWS01 spectrum (2.5 – 45 m) has a spectral resolution of = = 900 (Sellgren et al. in preparation). Another spectrum with SWS-AOT6, at = 1800, provided an independent spectrum in the reduced domain 14.5 – 19.5 m on which we focus here. The continuum level in this object is quite low and almost flat between 13 and 25 m, which offers the best conditions for searching for new features. Comparison of spectra taken at different times is a reliable test for distinguishing noise features from real emission bands. Both spectra are displayed in Fig. 1. The SWS slit orientation differed between these spectra, which explains the varying intensity of the 17.0 m H2 line.
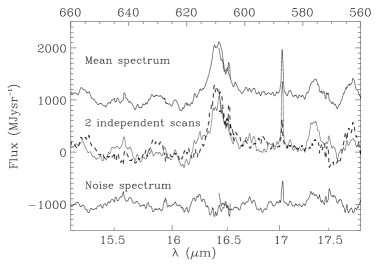
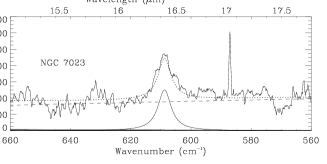
The spectra contain an emission feature at 16.4 m, detected in all independent scans. This new emission feature was first mentioned by Boulanger et al. (1998) and Tielens et al. (1999). We have fit the 16.4 m band in our SWS data by a Lorentzian profile (Fig. 2). Lorentzian fitting of AIB spectra has proven to be a useful tool for extracting the band contribution from the underlying continuum (Boulanger et al. 1998).
2.2 Detection in other objects
As shown in Fig. 3, the 16.4 m band is also detected in the ISO-SWS01 ( = 900) spectra of the Orion Bar (, ), and in M17-SW, at the interface between the HII region and the molecular cloud (, ). More details on these spectra are given in Verstraete et al. (in preparation).
Individual values of the band parameters are listed in Table 1. The average central wavelength of the feature is 16.42 m (608.9 cm-1) and the average band width is 0.16 m (5.8 cm-1). The uncertainty in the intensity is based on the difference between independent scans and does not include the overall calibration uncertainty of SWS. Some variation in the band-to-continuum ratio at 16.4 m is observed, likely due to the stronger radiation field in M17-SW and the Orion Bar. This will be discussed further in a forthcoming paper.
| Parameter | NGC 7023 | M17-SW | Orion Bar |
|---|---|---|---|
| 1 | 609.0 | 609.3 | 608.4 |
| FWHM 2 | 6.6 | 5.3 | 5.6 |
| I 3 | 1.15 (0.11) | 1.07 (0.17) | 2.65 (0.26) |
1 Band center in cm-1,
2 Full width at half maximum in cm-1,
3 Integrated band intensity in 10-6 W m-2 sr-1.
The 1 uncertainty is given in parenthesis.

3 Laboratory spectra
The laboratory spectra of many PAHs contain a frequently observed mode peaking at 16.2 m (Moutou et al. 1996; Schmidt et al., not published; Hudgins & Sandford 1998a,b,c). This mode appears slightly shifted from one molecule to the other, because its frequency depends on the internal structure of the molecular skeleton. In total, 29 molecules out of 63 show a band in between 611 and 623 cm-1 (16.21 – 16.52 m).
The central wavelength of a PAH vibrational mode should appear redshifted in interstellar spectra, with respect to the position measured in absorption at cooler temperatures (Joblin et al. 1995). The averaged redshift observed for coronene over 300 Kelvins is approximately 1% of the vibration wavenumber. This would move the measured wavelength of the laboratory 16.2 m band to the observed wavelength of the interstellar 16.4 m band.
Fig. 4 shows the measured histograms of the laboratory absorption modes, obtained by counting the modes, in 5 cm-1 bins (or 0.13 m bins). It has been done separately for the seven PAH families previously defined in the far-infrared data base of PAH spectra (Moutou et al. 1996). This number is a percentage, normalised to the total number of species in the corresponding family. Each family contains generally 5 to 9 individual species. The ”PAHs with pentagons” family has 19 components and the ”chain PAHs” contains 6 additional species taken from the work of Hudgins and Sandford (1998a,b), leading to a total number of 11 ”chain” species. The 0.16 m redshift is applied to the laboratory data. We deliberately did not take into account in this statistical approach the relative strength of the modes and it is thus not similar to a spectrum, because of the difficulty of combining spectra from three different laboratory groups. However, the average spectrum of each PAH family measured by Moutou et al. 1996 is displayed in their Figure 1, and these average laboratory spectra can be directly compared to the interstellar spectra after applying a 0.16 m redshift to the laboratory data.
We find that the 16.4 m band is especially active in the spectra of PAHs containing pentagonal rings and of linear PAHs. In this latest category, the band appears more likely at 16.25m and is dominated by the spectra of small chains containing 2 to 5 rings. These molecules are not thought to be good candidates as IR emitters, as they will probably not survive the interstellar radiation fields (Omont, 1986). Comparatively, the distribution of modes for other kinds of PAHs in this spectral domain is more spread out in wavelength or has another accumulation point. The contribution of the PAHs containing pentagons could then possibly dominate the interstellar emission spectra we observe.
4 Discussion
Calculations of infrared spectra are rare for large molecules. In our sample of PAHs with pentagons, only the theoretical spectrum of fluoranthene (C16H10) has been calculated (Klaeboe et al. 1981). The mode is observed at 616 cm-1 in the laboratory and predicted by simulations to lie at 668 cm-1; it is identified as a B2 in-plane vibration of C–C bonds. It is a complex vibration of the global ring structure, which could be described as a tentative “rotation” of the central pentagonal ring (J. Brunvoll, private comm.) and consecutive movement of all carbon atoms. In other molecules, it may also correspond to a global vibration of the carbon skeleton. Since the mode is also present in PAHs without pentagons, it is not clear yet if the five-membered rings have a special role in the IR activity at 16.4m. We investigate in any case the implications of the presence of pentagonal rings in PAHs:

-
•
Pentagonal rings inside a PAH molecule are known to produce a strong feature around 7 m (Moutou et al. 1996, Hudgins & Sandford 1998c). No individual feature is detected at 7 m in NGC 7023, but we can place an upper limit on any 7 m band from pentagonal rings from the 7.0 m continuum level (Moutou et al. 1999). We adopt the laboratory width of 0.14 m for a pentagonal 7 m band. We can then estimate an upper limit on the ratio of flux in the 7 m band to flux in the 16.4 m band of 10 in NGC 7023. This upper limit on the flux ratio is not in conflict with the measured laboratory value (2.5).
We conclude that the non-detection of a 7 m feature would not rule out a possible signature of pentagons in the ISM at 16.4 m .
-
•
In laboratory spectra where a 16.2 m mode is observed, other modes may be present, but at positions that vary a lot from one molecule to another (Moutou et al. 1996, and Fig. 4). These weak features are therefore under the detectability limit in our spectra.
-
•
The fullerene molecule C60, which contains pentagonal rings, and its related cation C are not detected in NGC 7023 (Moutou et al. 1999). However, the C60 infrared spectrum does not show the 16.4 m band (Krätschmer et al. 1990), for symmetry reasons. The low abundance of 60-atom fullerenes is therefore not evidence against pentagonal rings in the ISM.
-
•
In the evolution of aromatic molecules, pentagonal rings tend to curve a molecular plane composed of pure hexagonal PAHs. The molecules will then become tri-dimensional while growing. A global scheme of aromatic compounds, from simple planar PAHs to small carbon grains or anthracite coals such as have been shown to fit the spectra of some planetary nebulae (Guillois et al. 1996) requires such an intermediate evolution state, where molecules of 100 carbon atoms are curved. It is also consistent with proposals for grain formation in carbon star shells. For instance, Goeres & Seldmayr (1992), with their self-consistent model DRACON of carbon chemistry, predict the formation of large aromatic molecules containing pentagons, mostly from C3 accretion, because pentagons offer the best trade-off between entropy and energy in the process of carbon dust growth. Also, Kroto & McKay (1988) proposed an alternative growth sequence to produce carbon grains, involving pentagonal rings. Their presence in the network would lead to “quasi-icosahedral carbon particles with spiral structures” (see also Balm & Kroto, 1990).
We have shown that the 16.4 m mode observed in interstellar spectra could
be explained by PAH vibrational activity. More work is required to assess the
possible dominant role of five-membered ring PAHs.
Other mid-infrared features should also be searched for in other ISO spectra,
as the identification of other far-infrared features could give some important
hints as to the nature of the AIB spectrum.
Acknowledgments: We are grateful to J. Brunvoll, S.J. Cyvin and P. Klaeboe for very helpful discussions. Thanks to the anonymous referee for useful comments.
References
- (1) Allamandola, L.J., Tielens, A.G.G.M., & Barker, J.R., 1985, ApJL 290, L25
- (2) Allamandola, L.J., Bregman, J.D., Sandford et al., 1989, ApJ, 345, L59
- (3) Balm S.P. & Kroto H.W., 1990, MNRAS 245, 193
- (4) Boulanger F., Boissel P., Cesarsky D. et al., 1998, A&A 339,194
- (5) de Graauw T., Haser L.N., Beintema D.A. et al., 1996, A&A 315, L49
- (6) Goeres, A. and Seldmayr, E. 1992, A&A 265, 216
- (7) Guillois O., Nenner I., Papoular R. et al. 1996, ApJ 464, 810
- (8) Hudgins D.M. & Sandford S.A., 1998a, J.Phys Chem. 102, 329
- (9) Hudgins D.M. & Sandford S.A., 1998b, J.Phys Chem. 102, 344
- (10) Hudgins D.M. & Sandford S.A., 1998c, J.Phys Chem. 102, 353
- (11) Joblin C., Boissel P., Léger A. et al., 1995, A&A 299, 835
- (12) Karcher, W., et al., 1985, 1988, 1991, Spectral Atlas of PAH Compounds, Vol 1, Reidel, Dordrecht and Vols 2&3, Kluwer, Dordrecht.
- (13) Kessler M., et al. 1996, A&A 315, L27
- (14) Klaeboe P., Cyvin S.J., Asbojornsen P. et al., 1981, Spectrochimica Acta 37A, 655.
- (15) Krätschmer W., Lamb L.D. & Fostiropoulos K., 1990, Nature 347, 354
- (16) Kroto H.W & McKay K., 1988, 331, 328
- (17) Léger, A., Puget, J.L. 1984, A&A 137, L5
- (18) Léger A., d’Hendecourt L. & Défourneau D. 1989, A&A 216, 148
- (19) Moutou C., Léger A., d’Hendecourt L., 1996, A&A 310, 297
- (20) Moutou C., Sellgren K., Verstraete L. et al., 1999, A&A 347, 949
- (21) Omont A., 1986, A&A 164, 159
- (22) Schaeidt S.G. et al., 1996, A&A 315, L55
- (23) Sellgren K., 1984, ApJ 277, 623
- (24) Tielens A.G.G.M., Hony S., van Kerkhoven C. et al., 1999, in “The Universe as seen by ISO”, eds P. Cox & M.F. Kessler, p. 579