X-ray Observations of Groups and Clusters – A Relic of the High Redshift Universe
Abstract
I review the evidence from clusters and groups of galaxies for ‘relic’ evidence of the high redshift universe. Contrary to the received wisdom, clusters are old. Their x-ray emitting intergalactic medium in massive clusters is a reservoir of metal and energy injection from the main epoch of star formation. There are strong indications that non-gravitational energy was extremely important in the formation of low-mass clusters and groups, implying that gravity did not dominate the process on all scales below that of massive, rich clusters. The data indicate that most of the metals in the universe are not in stars but in the hot gas and thus the use of stars to trace metal formation and evolution misses most of the processed material. The group data shows that galaxies are very poor tracers of mass on the scale of and since groups are the ‘average’ place in the universe this probably holds for most of the visible universe.
NASA/Goddard Space Flight Center, Greenbelt, MD 20771
email: mushotzky@lheavx.gsfc.nasa.gov
1. Introduction
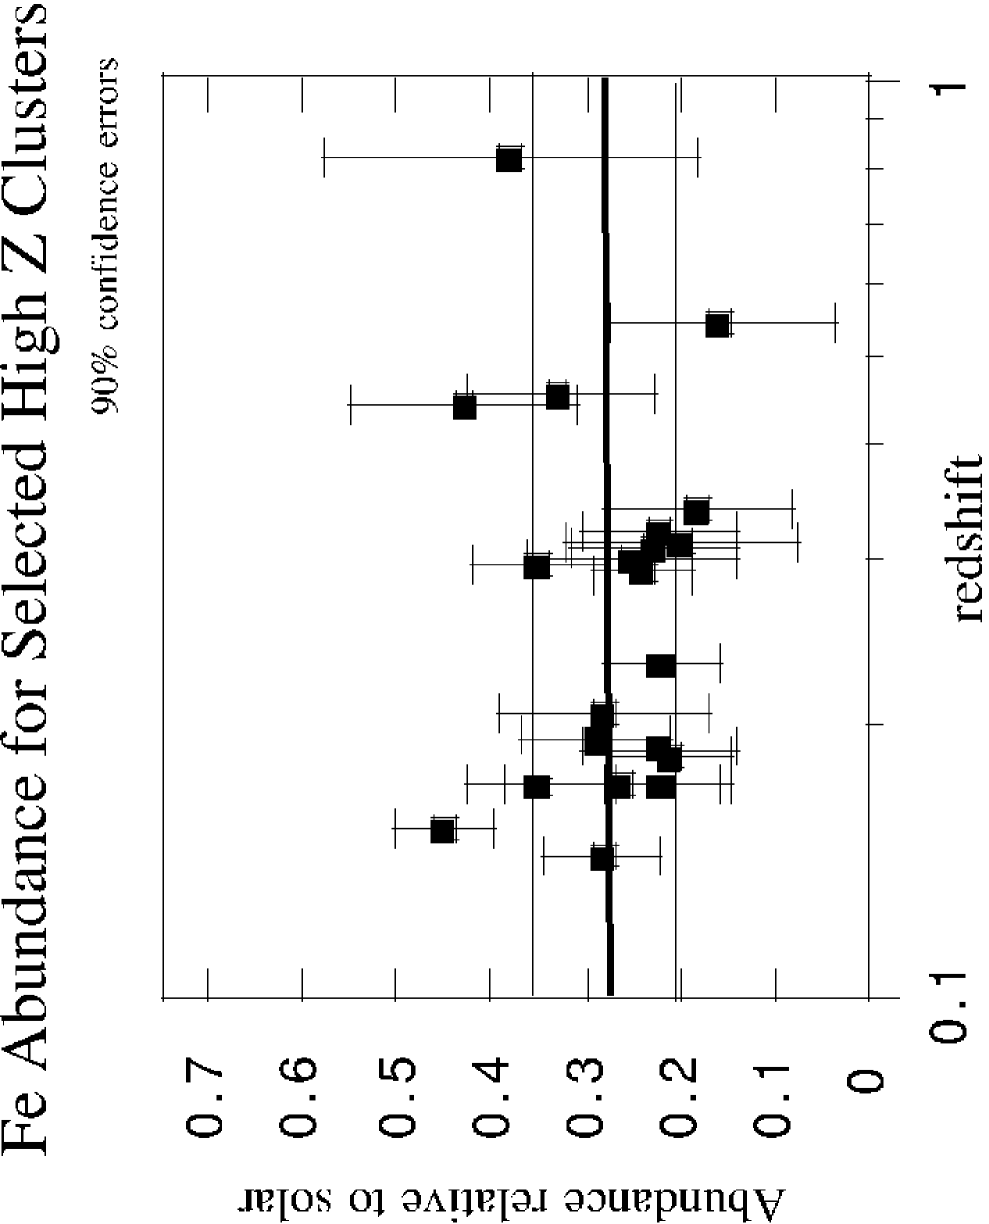
While classically clusters are presumed to be rather young (Gunn 1977), and the present epoch is thought to be the era of cluster formation, recent results strongly indicate that clusters are ‘old’ and thus are relics of the high-redshift universe. These indications are primarily due to Rosat and ASCA results for clusters: the lack of evolution in the x-ray luminosity function of clusters at (Jones et al. 1998; Ebeling et al. 1999; Vikhlinin et al. 1998); the relatively small change in the cluster temperature function out to (Henry 1997; Donahue & Voit 1999); the lack of evolution in the x-ray luminosity temperature relation to (Mushotzky & Scharf 1997; Donahue et al. 1999); the lack of evolution in the metallicity in the cluster gas to (Fig. 1; Mushotzky & Loewenstein 1997; Donahue et al. 1999); and the lack of evolution in the galaxy velocity dispersion temperature relation (Tran et al. 1999). In addition, the detection of massive clusters at (Bahcall & Fan 1998) and their possible existence at (Dickinson et al. 1999; Stanford et al. 1997) are highly unlikely in a high- universe (however for a different opinion see Blanchard et al. 1999). Other, independent, evidence is derived from HST and Keck observations that indicate that the stars in cluster ellipticals are very old (Renzini 1999). However it is not known, at present, if the galaxies themselves are old. Thus for the high-redshift universe the question is: what can we learn about the formation of large scale structure, galaxies and clusters from studies of these relics?
2. Cluster Results
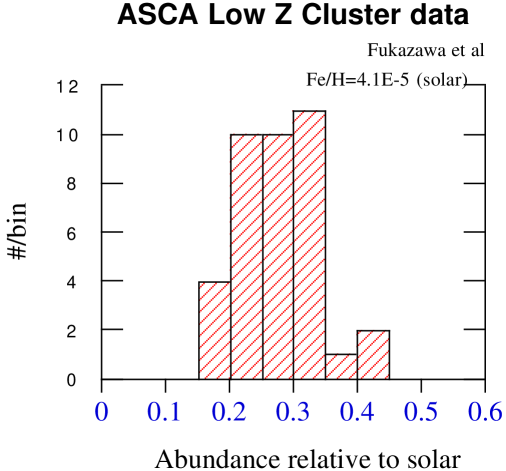
Clusters are, of course, the largest bound objects in the universe and are thought to be fair samples of the content of the universe (baryons, dark matter and metals). As has been known for many years, x-ray observations of groups and clusters indicate that most of the observable baryons in these systems reside in the hot phase ( K, Fig. 2). If clusters and groups are ‘representative’ samples, the stellar content of galaxies is, on average, % of the gas mass (see Nevalainen 1999 for a recent detailed analysis). The mean stellar ‘metallicity’ (Fe) is ‘solar’ (normalizing to the solar abundances of Anders & Grevesse 1989 and using the Jorgensen et al. 1999 data, averaging out over the metallicity gradients and the dependence of metallicity on luminosity). The metallicity of the gas is % of solar (Fig. 3). Thus with 80% of the mass in the gas and a similar metallicity for the gas and the stars, of the metals are in the gas phase. Since there are only subtle differences in the stellar spectra of ‘bulges’ in groups and clusters from the field, these results should apply to most galaxies and therefore we expect that % of the observable baryons and ‘most’ of the total mass in stars is in bulges and that the rest of the baryons are in the hot gas phase. It is amusing that this radical result is actually found in semi-analytic models (Somerville & Primack 1999).
What do these results imply for the formation and evolution of galaxies?
-
•
Galaxies are open systems – much of their evolution involves outflow and inflow of gas.
-
•
The presently-observable stars do not contain most of the metals.
-
•
One cannot study the history of metal creation by looking only at the ‘relic’ stars.
-
•
The relic gas contains most of the ‘stuff’ – where is this gas when it is not in groups and clusters?
-
•
Estimates of the total metals created by counting only stars are wrong – c.f., the controversy (Madau this symposium) over the evolution of the star formation rate in the universe.
-
•
There has been a lot more metal creation/star formation in the universe than indicated by normalizing to present day stellar data (Loewenstein & Mushotzky 1996) because most of the metals are in the hot gas phase and not in the stars. This is also essential for the semi-analytic models, which require a large contribution from supernova energy to explain the observed pattern of mass-to-light ratio and metallicity in galaxies (see next section).
3. The History of Star Formation has Very Strong Implications for the Evolution of the Gas
3.1. Evidence for Extra Heat
The gas in clusters and groups contains a history of the total energy deposited in it. This energy originates from two general sources: (1) gravity (infall shocks and mergers) and (2) star formation (supernova and stellar winds). Since massive star formation produces most of the metals, we can use the metallicity as an estimate of the total heat produced. For a fixed metallicity the fraction of the energy from star formation increases as the mass of the system is reduced; in other words the available energy per particle from infall is reduced as the mass of the system is lowered while, for a fixed metallicity, the energy produced by stellar processes remains constant. However it is important to know when and where the energy is produced. It is believed that for massive clusters most of the gravitational energy is produced by the infall shock during “cluster formation”. Theoretical N-body hydrodynamical estimates of the creation of entropy (heat) via shocks (Eke, Navarro & Frenk 1998) are in good agreement with the data for massive clusters.
However at low masses (Ponman, Cannon & Navarro 1999) there is excess entropy compared to these simulations. This effect has also been noted by many in the context of the luminosity temperature relation and the distribution of entropy in clusters (David et al. 1996). The theoretical work predicts while the data show that (Markevitchl 1989) and this can also be explained by ‘extra’ (e.g., non-gravitational) heat input (Kaiser 1991).
Detailed calculations (Loewenstein 1999; Tozzi & Norman (TN) 1999; Suginohara & Ostriker 1998; Balogh et al. 1999) indicate that this energy can be provided by star formation but requires a fairly high efficiency of conversion of stellar energy into heat since the keV/particle that is required is about the maximum that can be provided by the supenova that produce the metals. Since entropy (at the time of energy injection) for a given heat input one gets more entropy if the density is low at time of energy injection. These calculations strongly constrain the total amount of energy and the epoch at which this energy is injected. Following the scenarios of TN, where the entropy is produced at a single epoch before the collapse of cluster, the mass scale of the transition from a shock (gravity dominated) entropy to a adiabatic model at a given mass scale is a strong function of the total entropy and the redshift of energy injection. The appearance of a floor in the entropy at a mass scale of ( keV) requires in their model a redshift of for the injection of the energy. Suginohara & Ostriker (1998), who use a rather different set of constraints based on the absence of thermal cooling runaway in clusters also require a similar redshift for energy injection . While the situation is unclear it seems as if certain structure formation scenarios (the semi-analytic models presented by Valageas & Silk 1999 and Wu, Fabian & Nulsen 1999) are not consistent with the required amount of extra energy being provided solely by supernova.
This additional energy can also be checked (Loewenstein 1999; Davis et al. 1999) by:
-
•
calculating the cluster mass vs. relation (Horner et al. 1999) – some of the ‘extra’ energy goes into ‘temperature’ and at low masses the observed temperatures are “too high” for the the N-body hydrodynamical model masses.
-
•
measuring the surface brightness distribution: the gas tends to get puffed-up and have a flatter surface brightness distribution than predicted by the N-body hydrodynamical models.
-
•
comparing the ratio of gas to total mass vs. temperature. If there has been no energy input other than gravity this should be roughly constant from object to object (White et al. 1993). However recent analysis (Mohr et al. 1999; Fujita & Takahara 1999) find that the ratio of gas mass to total mass rises as , that is, more massive clusters have a larger fraction of their virial mass in gas (as originally suggested by David et al. 1995 and as indicated in Fig. 2).The obvious solution is that some of the gas gets expelled in low mass systems. This is further supported by the metallicity found in groups and the wide range of other parameters found in groups (see next section).
3.2. What can we say about when the heating occurred?
The observations that low redshift elliptical galaxies are old and have mostly stopped forming stars at , the lack of evolution in the cluster metallicity since (Fig. 1) and the predominance of ellipticals in rich clusters all indicate that most of the star formation in clusters, and thus the source of the additional entropy occurred at . If the heating occurred only prior to collapse (Ponman et al. 1999) one expects that low mass systems are isentropic (Balogh et al. 1999) and thus have a steep temperature gradient. This has not been observed and the best data to date indicate that groups are roughly isothermal.
However, as noted above, the effects of heating are much more efficient if they occur at early times, when the gas was of lower density. It thus seems likely that the heat was created at moderate to high redshift sometime near the collapse of the cluster. Clearly, detailed calculations are necessary to determine the critical observations which can determine the amount of energy injected, the epoch at which it is injected and the source of the energy.
While clusters may be ‘rare’ high density perturbations, groups are the average place in the universe (see next section). The effects of heating are most pronounced in groups, as evidenced by their high specific entropy, their relatively low gas fractions and flat surface brightness profiles. Thus most galaxies have been subjected to this process. As indicated in the semi-analytic models heating has profound implications on galaxy formation and the epoch of formation – the lesson that one learns is that ONE CANNOT UNDERSTAND GALAXY FORMATION BY MODELING DARK MATTER HALOS ALONE . There are many other implications of this; for example: when overdense regions “get hot” due to gravitational collapse (cluster and group formation), star formation stops because the cooling times increase drastically (Cen & Ostriker 1999) – this gives a time dependent bias such that overdense regions which collapse early (rich clusters) cease star formation at high redshifts and the regions in which star formation proceeds occur in lower and lower overdensities at lower redshifts. The effects of heating due to star formation has a strong feedback loop (Menci & Cavaliere1999) and strongly effects the timescale in semi-analytic models.
If the true energy is keV/particle, as indicated by the entropy models (Loewenstein & Mushotzky; Loewenstein 1999) then the mean energy per particle of most of the baryons exceeds the binding energy of even the most massive galaxies and galactic winds were important for ALL galaxies (not just dwarfs). The x-ray data for groups and clusters strongly argues that the galaxies are poor tracers of mass , baryons and metals and use of them as tracers may give a very poor ‘picture’ of the universe.
4. Data on Cluster and Group Metallicity
The Fe abundances are strongly peaked near solar and do not vary with redshift out to at least and perhaps (Donahue et al. 1999). This lack of evolution of gas metallicity combined with the absence of major star formation in the same clusters strongly constrains the epoch of major metal formation. The absence of large number of A stars means that the period of massive star formation has ceased in these systems Gyrs (the age of A stars) before the age of the objects at . For , , this implies that the epoch of metal formation is these clusters is at . The highest- cluster with measured Fe abundance is at (Hattori et al. 1997) and if we adopt this as the highest redshift at which cluster metallicity is not evolving this would constrain the epoch of metal formation in clusters to .
4.1. Abundance Pattern:
The data are fairly robust with respect to Fe and Si (Fukazawa et al. 1998) moderate for S but poor for Mg, O, Ca, Ar, Ne. Recent analysis of ASCA, XTE and SAX data (Dupke & White 1999) give a strong indication that Ni maybe be very overabundant with respect to Fe. One needs to combine these patterns with supernova models to derive constraints (Gibson, Loewenstein & Mushotzky 1998) and the relative numbers of type I and type II supernova. Unfortunately the uncertainties in yields and SN models make strong statements very uncertain. The existence of abundance gradients in Si/Fe in about of all clusters and groups (Finoguenov & Ponman 1999; Ezawa et al. 1997) seem to show that the centers of clusters are relatively enriched in type I products and the outer regions are almost ‘pure’ type IIs. The bulk of all the heavy elements is in the outer regions. As shown in Lowenstein & Mushotzky (1996) the toal mass of Si seen in clusters indicates that type II’s have dominated the total metal production, consistent with the early origin of the metals in bursts of star formation. However the situation is not yet fully resolved (c.f., Arimtoto et al. 1997) and in order to determine the true ratio of type I to type II will require better data for O, Ni and Mg – the elements that most sensitive to the relative number of different types of supernova.
5. Results For Groups
Groups are the average place in the universe, over 70% of all the galaxies in the local volume of space occur in groupings and it is very rare indeed to find truly isolated galaxies (Burstein 1999 pc. – of the 2700 galaxies in the Tully Nearby Galaxies Atlas, only 35 are not in a group, and none of those 35 are more than 0.75 Mpc from another giant galaxy). Thus the results for groups should apply to the universe as a whole if the x-ray emittings groups are representative.
Recent x-ray results show that large x-ray halos are a common property of bulge dominated groups (Mulchaey et al. 1998) but are very rare in spiral dominated systems. The masses determined for the groups are determined via the same techniques as for clusters (via use of hydrostatic equilibrium and spatially resolved temperatures).
The derived masses are ‘typically’ at the viral radius (but only two groups have been measured to the virial radius and if the systems are really dominated by non-gravitational heat the extrapolation to the virial radius is uncertain – see Loewenstein 1999).
The space density of these systems is large and in rough agreement with that predicted for virialized systems in LCDM models. Thus use of an x-ray selected survey can derive the mass density of virialized systems over a mass range (from the lowest mass groups to the richest clusters).
There is a very poor correlation between the optical richness of the group and the x-ray temperature or luminosity (Mulchaey et al. 1996). However there is an excellent agreement between the velocity dispersion as derived from observations of the numerous small galaxies in x-ray luminous groups (Mulchaey & Zabludoff 1998) and the x-ray temperature. This essentially implies that in groups the optical light does not trace mass at all! The x-ray emission is a much more direct tracer of mass than optical light and determination of the group mass and mass distribution will be a strong test of all structure formation models. This is a serious warning about the use of optical light to trace mass in the universe since most galaxies are in poor groups.
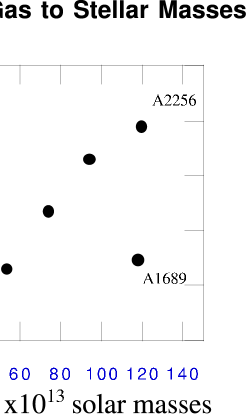
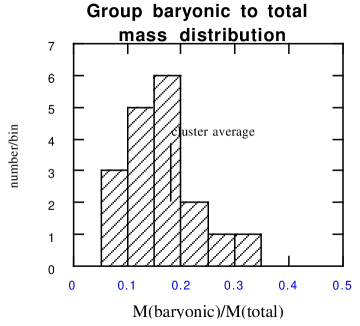
The baryonic fraction, the gas to stellar mass and the ratio all show wide variations in groups, but the mean values are distributed around the cluster average (Fig. 4)
5.1. Abundance Data
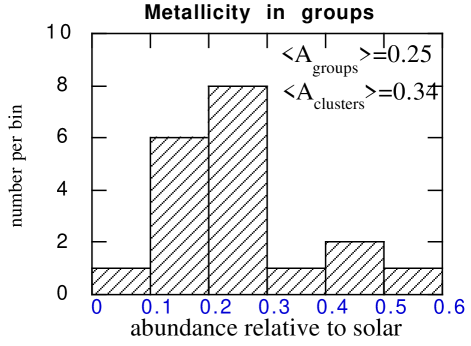
The metallicity in groups has a much larger range than that found in clusters and is often less (Fig. 5).
The “iron mass to light ratio” (ratio of total mass in Fe (stars+gas) to the total light – Renzini et al. 1997) tends to be much lower than in clusters. If we believe that the stars visible today in the groups are the tracers of the population that produced the metals then this indicates that the groups have lost a substantial fraction of their metals.
The abundance pattern is not well determined (Davis et al. 1999) but the Si/Fe ratio is smaller than in clusters (Fukazawa et al. 1998) indicative of either a larger ratio of type I to type II supernova than in clusters, which is hard to understand, or a loss of type II material (Davis et al. 1999). Since the groups tend to have a higher specific entropy than clusters (normalized to the expected shock value) and have a wider range in baryon fraction, all these signatures are consistent with mass ejection via the energy input from stellar sources associated with massive star formation (SN+winds) on the group mass scale.
5.2. What does this mean for the high redshift Universe?
The low iron mass to light ratios strongly constrain evolution scenarios and indicate (1) either these systems have lost much of their baryons and metals (winds from galaxies and groups) and/or (2) they have been much more strongly effected by infall of primordial material than clusters. And thus even the most massive “normal systems” have been affected by non-gravitational processes.
6. Conclusions:
The picture of the high redshift universe that one obtains from x-ray observations of groups and clusters in the universe is radically different from what was the standard picture five years ago. Clusters are old, and because they can hold onto all their material (and even accrete from the IGM), they are the only systems that are representative of the universe as a whole. There are strong indications from observations of groups and clusters that non-gravitational effects are extremely important in the formation of galaxies and groups and that gravity is not dominant on all scales. One finds that at the group scale that galaxies are very poor tracers of mass. The combination of all these effects may help to explain the difficulty of comparing numerical N-body simulations of structure formation against the available galaxy data. Finally the importance of feed-back from non-gravitational energy sources, as indicated in the semi-analytic models, cannot be underestimated. We anticipate that the study of large scale structure with x-ray samples will radically change our understanding of the universe.
In the next year, with the new data from Chandra (now operating), XMM and Astro-E there will be a qualitative change in the signal to noise, angular resolution and spectral resolution of the data and many of the conclusions reached in this review will be strongly tested.
Acknowledgments.
I would like to thank the organizers for the chance to present the “Hy-Energy” view of the universe and for an exciting and well organized meeting. I would like to thank my collaborators: M Loewenstein, U. Hwang, J. Mulchaey, D. Davis, C. Scharf and D. Horner who have done so much of this work. Andrew Bunker is thanked for his assistance in assembling this manuscript.
References
Anders, E. and Grevesse, N. 1989 GeCoA..53..197
Arimoto, N, Matsushita, K, Ishimaru, Y, Ohashi, T., Renzini, A 1997 Ap. J. 477..128
Bahcall, Neta A.and Fan, X 1998 Ap. J. 504 .1
Balogh, M. Babul, A. and Patton, D. 1998 astro-ph/9809159
Blanchard, A Sadat, R. Bartlett, J.G, Le Dour, M.1999 astro-ph/9908037
Cen, R and Ostriker, J, P. 1999 Ap. J. 519 L.109
David, L, Jones, C, Forman, W 1996 Ap. J.. 473, p.692
David, L, Jones, C, Forman, W 1995 Ap. J. 445, p. 578
Davis, D., Mulchaey, J. , Mushotzky, R. 1999 Ap J 511 34
Dickinson,M. et all 1998 Ap. J. submitted
Donahue, M. and Voit, M astro-ph/9907333
Donahue, M., Voit, M., Scharf, C., Gioia, I., Mullis, C., Hughes, J. and Stocke, J. 1999 astro-ph/9906295
Dupke, R. and White III, R.E.1999 astro-ph/9907343
Ebeling, H. Allen, S. W. , Edge, A. C, Crawford, C. S. 1999 HEAD 31.1303
Eke, V, Navarro, J, and Frenk, C 1998 Ap. J. 503..569
Ezawa, H., Fukazawa, Y. Makishima, K., Ohashi, T., Takahara, F., Xu, H Yamasaki, N. Y. 1997 Ap. J. 490L..33
Finoguenov, A. and Ponman, T.J. 1999 MNRAS.305..325
Fujita, Y and Takahara, F 1999 Ap. J. 519, L.55
Fukazawa,Y. 1996 PhD thesis University of Tokyo
Fukazawa,Y. et al 1998 PASJ 50, 187
Gibson, B. K.,Loewenstein, M, Mushotzky, R. F. 1997 MNRAS.290..623
Hattori, M., Ikebe, Y. Asaoka, I., Takeshima, T. Boehringer, H., Mihara, T, .Neumann, D. M., Schindler, S., Tsuru, T. Tamura, T. 1997 Natur.388..146
Henry, J. Patrick 1997 Ap. J. 489 L 1
Horner, D, Mushotzky, R, Scharf, C 1999 Ap J 520 78
Jones, L. R. , Scharf, C. Ebeling, H. , Perlman, E. Wegner, G. , Malkan, M. and Horner, D. 1998 Ap. J. 495..100
Jorgenson, I. 1999 MNRAS. 306..607
Kaiser, N. 1991 Ap. J. 383..104
Loewenstein, M. 1999 Ap. J. in press
Loewenstein, M and Mushotzky, R. F. 1996 Ap. J. 466..695
Madau, P. this symposium
Markevitch, M 1998 Ap. J. 504 27
Menci N and Cavaliere, A. 1999 astro-ph/9906103
Mohr, J., Mathiesen, B. and Evrard, G. 1999 astro-ph/9901281
Mulchaey, J. and Zabludoff, A. 1998 Ap. J. 496 73
Mulchaey, J, Davis, D., S., Mushotzky, R. and Burstein, D.1996 Ap. J. 456 80
Mushotzky, R. F., Loewenstein, M. 1997 Ap. J. 481 L..63
Mushotzky, R. F., Scharf, C. A. 1997 Ap. J. 482 L..13
Nevalainen J. M. Markevitch M , and Forman, W. 1999 astro-ph/9906286
Ponman, T. J., Cannon, D. B and Navarro, J. F 1999 Nature 397, 135
Renzini, A. 1999 astro-ph/9902108
Schindler, S. 1999 astro-ph/9908130
Somerville R. and Primack, J. 1999 astro-ph/9811001
Stanford, S.A. , Elston, R, Eisenhardt, P, Spinrad, H, Stern, D, and Dey, A 1997 AJ .114., 2232
Suginohara, T. and Ostriker, J . 1998 Ap. J. 507 16
Tozzi, P. and Norman, C. 1999 astro-ph/9905046
Tran, K-V et al 1999 Ap. J. 522 39
Valageas, P. and Silk , J. 1999 astro-ph/9907068
White, S.D.M., Navarro, J. F., Evrard, A.E., Frenk, C.S. 1993 Nature .366..429
Wu, K.K.S. , Fabian, A. and Nulsen , P astro-ph/9907112
Vikhlinin, A., Mcnamara, B. R, Forman, W., Jones, C., Quintana, H., Hornstrup, A. 1998 Ap. J. 498 L..21