NIR spectroscopy with the VLT of a sample of ISO selected
Hubble Deep Field South Galaxies
\toctitleNIR spectroscopy with the VLT of a sample
of ISO selected Hubble Deep Field South Galaxies
11institutetext: Max-Planck-Institut für extraterrestrische Physik,
Postfach 1603, 85740 Garching, Germany
22institutetext: Dipartimento di Astronomia, Viccolo Osservatorio 5 I-35122,
Padova, Italy
33institutetext: Leiden Observatory, PO Box 9513, 2300 RA, Leiden, The Netherlands
44institutetext: European Southern Observatory, Karl-Schwarzschild-str. 2, 85740 Garching,
Germany
55institutetext: Institut d’Astrophysique de Paris - CNRS,98bis Boulevard Arago,
75014 Paris, France
66institutetext: Imperial College of Science Technology and Medicine,
Astrophysics Group, Blackett Laboratory, Prince Consort Rd.,
London, SW2 1BZ, U.K.
*
Abstract
A new population of faint galaxies characterized by an extremely high rate of evolution with redshift up to z1.5 has recently been discovered by ISO. These sources are likely to contribute significantly to the cosmic far-IR extragalactic background. We have carried out near-infrared VLT-ISAAC spectroscopy of a sample of ISOCAM galaxies from the Hubble Deep Field South. The rest-frame R-band spectral properties of the ISO population resembles that of powerful dust-enshrouded active starburst galaxies.
1 Introduction
IRAS observations show that about 30% of the total starlight is emerging in the mid and far-infrared (Soifer and Neugebauer 1991). About 25% of the high mass star formation within 10 Mpc originates in dusty infrared luminous galaxies. IRAS counts indicate evidence for evolution at low flux levels in (Ultra)luminous Infrared Galaxies ((U)LIRGs, L 1012 L⊙, Lonsdale et al. 1990, Franceschini et al. 1988). However, the IRAS survey only sampled the local Universe (z0.3) and the extrapolation of this evidence for cosmic evolution to higher redshifts is speculative. Since then, almost all information about high-z galaxies relied on optical surveys. Although these surveys have been succesful in discovering distant galaxies (e.g. Steidel et al. 1996) and constraining the star formation history of the Universe (Madau et al. 1996) they were able to tell only part of the story. The COBE detection of an extragalactic infrared background (Puget et al. 1996) with an integrated intensity similar or higher than that of optical light (Hauser et al. 1998, Lagache et al. 1999) suggests that a significant part of the star formation in the Universe is obscured and thus missed by the various optical surveys.
The advent of the Infrared Space Observatory (ISO) has had a very significant impact on the studies of high -z star forming galaxies. Operating in the sensitive to dust and PAH emission mid-infrared regime, ISOCAM on board ISO, was more than 1000 times more sensitive than IRAS and thus had the potential to study infrared bright galaxies at redshifts beyond 0.5. A number of cosmological surveys have been performed using ISOCAM ranging from large and shallow ones to pencil-beam deep ones reaching down to a few Jy sensitivities (see Cesarsky et al. this volume). The source counts from all ISOCAM surveys combined with those of IRAS are in good agreement with a no evolution model (= -2.5) up to a flux level of 100 mJy. However at fainter flux levels the situation rapidly changes: the counts lie an order of magnitude higher than the predictions of no-evolution models. This steepening in the log N–log S plot at 0.4 mJy implies that ISOCAM surveys have probably revealed a new population of strongly evolving galaxies (Elbaz et al. 1999)
Among the deepest surveys performed by ISOCAM are the observations of the Hubble Deep Field North (N) and South (S) regions (Williams et al. 1996) resulting in the detection of 150 sources down to Jy levels. The next major step is to explore the nature of the ISOCAM population with opticalnear-IR spectroscopy. The results we discuss in this work focus on a sample of galaxies drawn from the ISOCAM survey of the HDF-S field. We present the results of near-infrared spectroscopic followup carried out using the Very Large Telescope (VLT) in an attempt to characterize the nature of this new population.
2 ISOCAM Observations of HDF-S
The Hubble Deep Field S was observed by ISOCAM as part of the European Large Area ISO Survey (ELAIS, see Oliver et al, this volume). The observations were carried out at two wavelengths, LW2( 6.75 m) and LW3(15 m). The data have been analysed independently by Oliver et al. (2000) and Aussel et al. (2000). The latter analysis was carried out using the PRETI method (Starck et al. 1999) and resulted in the detection of 63 sources in the LW3 band. The results presented here are based on the Aussel et al. (2000) analysis.
3 The VLT ISO-Hubble Deep Field-S sample
The sample presented here was selected from the ISOCAM LW3 detections of the Hubble Deep Field-S (hereafter ISOHDFS sample). For the sample selection we imposed two criteria: a) a secure LW3 detection and b) a secure counterpart in the I band image (Dennefeld et al. 2000), or a counterpart in the K band image (EIS Deep, DaCosta et al. 1998). The latter was necessary because in a number of cases there were more than just one I band counterparts for one ISOCAM candidate. We did not apply any selection based on colours. Our sample (hereafter VLT ISOHDFS sample) is thus a fair representation of the strongly evolving ISOCAM population near the peak of the differential source counts (Elbaz et al. 2000).
Our VLT ISOHDFS sample contains about 25 galaxies. The LW3 flux ranges between 100–400 Jy. For the near-infrared observations we used spectroscopic redshifts from optical spectroscopy where available for z0.7 (Dennefeld et al. 2000) or photometric redshifts estimated based on the model PEGASE (Fioc and Rocca-Volmerange 1997). Our photometric redshift determination turned out to be accurate to 0.1 and provided a very powerful tool for ISAAC followup.
4 VLT Observations
The observations were carried out during 1999 September 20-24 with the infrared spectrometer ISAAC (Moorwood et al. 1998) on ESO telescope UT1, on Paranal in Chile. For the observations we used the low resolution grism R 600 and a slit of 1”. The choice of filter was dictated by our aim to detect Hα line emission. Based on our spectroscopic andor photometric redshift estimates we chose the equivalent Z, SZ, J or H filter. To maximise the observing efficiency we positioned the slit (which had a 2′ length) in such a way as to include at least two galaxies at any given orientation.
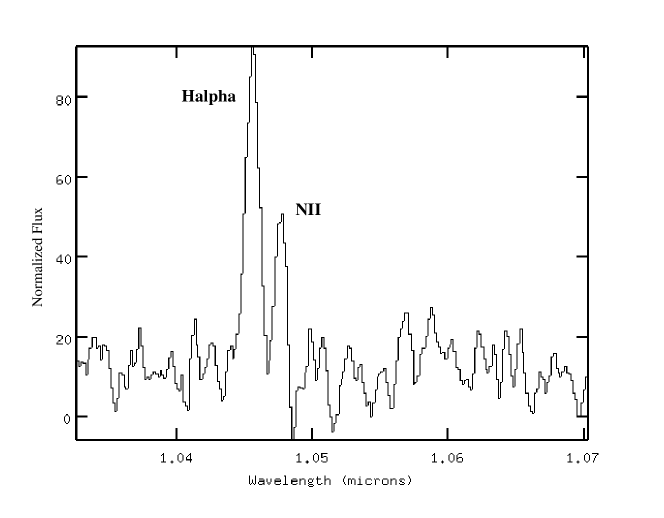
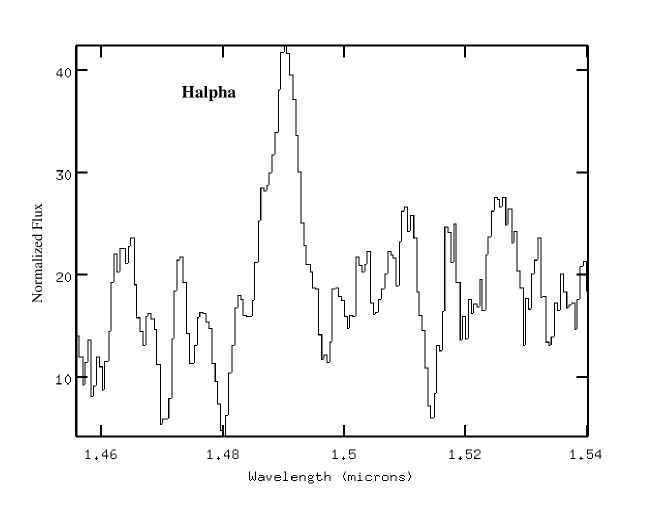
We observed 13 galaxies and Hα was succesfully detected in all but two of them. [NII] emission is also seen in some spectra. Finally, in some cases we have also detected emission from the [SII] 6717 6731 lines. The H magnitudes of the observed galaxies varied in the range 19-22 mag.
Most of the spectra were acquired with a 1hr on source integration time. With this integration time we were able to detect emission lines as well as continuum in almost all of the galaxies. Observations of spectroscopic standard stars were also performed to allow proper flux callibration of the galaxy spectra. The spectra were reduced in part using the ECLIPSE software (Devillard 1998) and standrard IRAF routines.
Spectra of two of the galaxies observed are shown in Figures 1 and 2.
5 The nature of the ISOCAM faint galaxies
Prior to our study no near-infrared (rest-frame R-band) spectroscopy had been carried out for the ISOCAM population, primarily because of the faintness of the galaxies. Optical spectroscopy (rest-frame B-band) has been done for HDF-N (Aussel et al. 1999a) and the Canada France Redshift Survey (CFRS) field (Flores et al. 1999). The ISOCAM HDF-N galaxies have been cross-correlated with the optical catalog of Barger et al. (1999) resulting in 38 galaxies with confirmed spectroscopic redshifts. Flores et al. have identified 22 galaxies with confirmed spectroscopic information. In both of these samples the median redshift is about 0.7. Our VLT ISOHDFS sample contains 1 galaxy with z0.5, 6 galaxies 0.5z0.75 and 6 galaxies with 0.9z1.3. Thus our sample has a z-distribution very similar to the HDF-N (Aussel et al.) and CFRS (Flores et al.) samples.
Rest-frame B-band spectra host a number of emission and absorption lines related to the properties of the starburst in a galaxy. Based on these features galaxies can be classified according to their starburst history. Strong Hδ Balmer absorption and no emission lines are characteristic of kA galaxies. The presence of significant higher level Balmer absorption lines implies the presence of a dominating A-star population. Such an A-star population may have been created in a burst 0.1–1 Gyr ago (post-starbursts). The simultaneous presence of Balmer absorption and moderate [OII] emission, known as e(a) or EA galaxies, may be characteristic of somewhat younger, but still post-starburst systems or, alternatively, active but highly dust absorbed starbursts. As we will show, the ISOCAM galaxies are in fact powerful starbursts hidden by large amounts of extinction.
Despite the fact that the local mid-infrared luminosity function is dominated by AGNs (Fang et al. 1998), both Aussel et al. and Flores et al. find a large fraction of the ISOCAM galaxies are predominantly powered by star formation. Based on spectrophotometric SEDs of 19 galaxies Flores et al. deduce that the majority of the CFRS ISOCAM population exhibits post-starburst characteristics with the star formation occuring about 1 Gyr prior to the observed event.
5.1 ISOHDFS Galaxies are dusty luminous active starbursts
As discussed in the previous section kA galaxies can be naturally explained as post-starbursts with a prominent burst 0.1–1.0 Gyr ago. E(a) (or EA) galaxies would then equally naturally be explained as being somewhat younger systems. B-band spectra of local dusty starbursts such as M82 (L 1010 L⊙, Kennicutt et al. 1992), LIRGs (L 1011 L⊙, Wu et al. 1998), and ULIRGs (L 1012 L⊙, Liu and Kennicutt 1995), surprisingly enough, look like e(a), yet Hα is strong (typical for an HII or liner galaxy). The apparent discrepancy between these two signatures can be reconciled: differential dust extinction is at play.
Large amounts of dust exist within the HII regions where the Hα and [OII] line emission originates. [OII] emission is affected more than Hα simply because of its shorter wavelength. The continuum is due to A-stars. This A-star signature comes from an earlier (0.1–1.0 Gyr) star formation epoch that is not energetically dominant, in fact plays a small role once the dusty active starburst is dereddened. Such a scenario implies that these galaxies undergo multiple burst events: the less extincted population is due to an older burst while in the heavily dust enshrouded HII regions there is ongoing star formation.
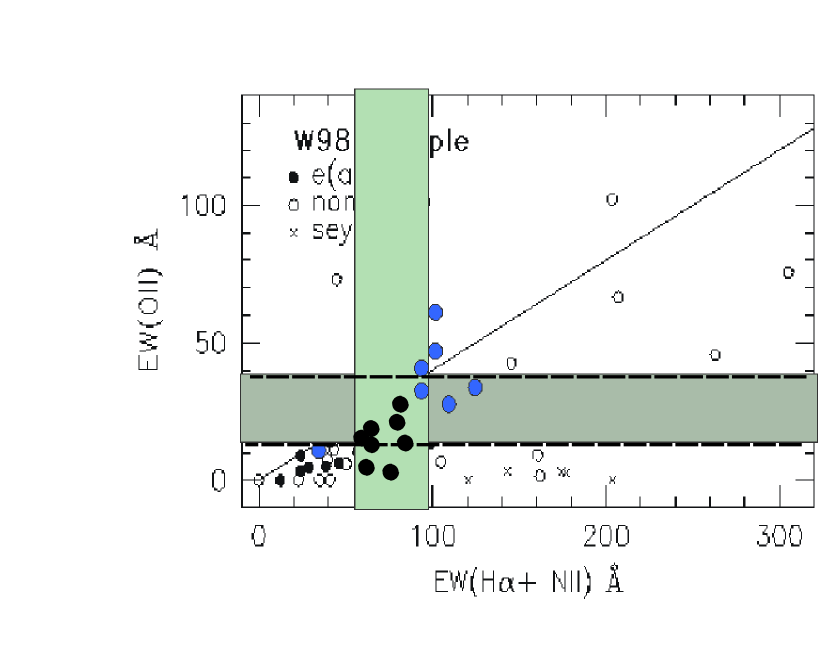
A notable property of the e(a) galaxies appears to be their low EW(OII) EW(HNII) ratio. Such low ratios have already been observed in the spectra of distant clusters (Dressler et al. 1999) and nearby mergers (Poggianti 99). Similar behaviour is found among the dusty Luminous Infrared Galaxies (LIRGs) studied by Wu et al. (1998) or the ULIRGs studied by Liu and Kennicutt (1995). The behaviour of the (OII)(HNII) ratio is shown in the EW(OII)–EW(H NII) diagram (Figure 3): The majority of the points lie below the straight line, which represents a fit for normal field galaxies at low redshifts. Since for our ISOHDFS sample there aren’t any B-band spectra available yet we use the values reported for the CFRS galaxies (median 2015, Flores et al. 1999). It follows from Figure 3 that the ISOHDFS galaxies occupy the same region in the EQW(OII)EQW(H NII) diagram as the LIRGs and ULIRGs.
6 Star Formation Rates
In ionization bounded HII regions the Balmer emission line luminosities scale directly with the ionizing fluxes of the embedded stars. It is thus possible to use the Balmer emission lines to derive quantitative star formation rates in galaxies (e.g. Kennicutt 1983). Since Hα is typically the strongest of the Balmer lines is thus the best for such applications. However, beyond redshifts of z 0.2-0.3 Hα redshifts into the near-IR which is not easily accessible with 4m class telescopes. Due to this constraint several workers (e.g. Dressler et al. 1995) have relied on measurements of the [OII] 3727 doublet as a star formation index for distant galaxies.
The conversion factor between ionizing flux and star formation rate (SFR) is usually computed using an evolutionary synthesis model. Only massive stars ( 10 M⊙) with short lifetimes (a few million years) contribute significantly to the integrated ionizing flux. Based on our recent measurements of the Hα line strength and following the recipe of Kennicutt (1998):
SFR(M) = 7.9 10-42L(Hα)(erg s-1).
Using this formula we estimate that the SFR rates in the ISOHDFS galaxies range between 10-40 Myr, corresponding to total luminosities of 1–41011 L⊙ (assuming Ho = 75 km/s/Mpc, =1). These values imply that the ISOCAM galaxies would fall in the LIRG class. However, the present SFR estimates can be used only as an indicative lower limit of the real SFR in these galaxies. An upward correction of a factor of 3 should be applied to correct for the extinction (assuming A1.5).
A preliminary calculation of SFR rates based on the LW3 fluxes (Franceschini et al. 2000) shows indeed that the SFR is 3-4 times higher than estimated from Hα measurements.
7 Conclusions
We have presented first results of a followup program aiming to characterize the nature of the strongly evolving population discovered by the ISOCAM surveys. The detections of strong Hα emission and large EW in almost all of the galaxies we observed implies that these objects are active star-bursts. Our results imply that the star forming regions inside these galaxies are affected by differential extinction which is responsible for the low EW(OII)EW(Hα) often observed in these galaxies. This result demonstrates that it is very dangerous to derive star formation rates from UV data alone since these wavelengths are susceptible to higher extinction. Thus a significant fraction of star formation could may have been missed by optical surveys.
Using the observed Hα emission lines we estimate that the SFR rate in the VLT ISOHDFS galaxies ranges between 10 -40 M yr. This SFR rate serves as a lower limit to the true SFR in these galaxies. The SFR as derived from ISOCAM observations is about 3 times higher. We conclude that the ISOCAM surveys have unveiled a new population of active dusty starbursts which probabaly account for a substantial fraction of the FIRsubmm background (see Elbaz et al. 2000).
References
- [1] Aussel, H., Cesarsky, C.J., Elbaz, D., Stark, J.L., (1999a) A&A 342, 313
- [2] Aussel, H., Elbaz, D., Cesarsky, C.J., Stark, J.L., (1999b) In The Universe as seen by ISO, eds. P. Cox, M.F. Kessler, ESA SP 47, 1023
- [3] Barger, A.J., Cowie, L.L., Trentham, N., Fulton, et al., (1999) AJ 117, 102
- [4] DaCosta, et al., 1998,
- [5] Fioc, M., Rocca-Volmerange, B., (1997), A&A 326, 950
- [6] Flores, H., Hammer, F., Thuan, T.X., Cesarsky, C., (1999) Ap.J., 517, 148
- [7] Dressler, A., Smail, I., Poggianti, B.M., Butcher, H., et al. (1999) astroph9901263
- [8] Elbaz, D., Cesarsky, C.J., Fadda, D., Aussel, H., et al. (1999) A&A 351, L37
- [9] Elbaz, D., et al., 2000 in prep.
- [10] Fang, F., Shupe, D., Xu, C., Hacking, P., (1998) Ap.J., 500, 693
- [11] Franceschini, A., Danese, L., de Zotti, G., Xu, C. (1988) MNRAS 233, 175
- [12] Hauser, M.G., Arendt, R.G., Kelsall, T., 1998, ApJ 481, 49
- [13] Kennicutt, R.C., (1992) Ap.J., 388, 310
- [14] Kennicutt, R.C., (1998) Ann. rev. Astr. Ap. 36, 189
- [15] Lagache, G., Abergel, A., Boulangerm F., Desert, F.X., Puget J-L., (1999), A&A 344, 322
- [16] Liu, C.T., Kennicutt, R.C., (1995) Ap.J., 450, 547
- [17] Lonsdale, C. J, Hacking, P., (1989) Ap.J. 339, 712-23
- [18] Lonsdale et al. (1990) Ap.J. 358, 60-82
- [19] Moorwood, A.F.M., et al. (1998), Msngr 74, 7
- [20] Oliver, S., et al., (2000) in prep.
- [21] Poggianti, B.M., Wu, H., (1999) astroph9908180
- [22] Puget, J-L., Abergel, A., Bernard J-P., Boulanger, F., Burton W.B., et al. (1996) A&A 308, L5
- [23] Starck, J.L., Abergel, A., Aussel, H., Sauvage, M., et al., (1999) A&AS 134, 135
- [24] Steidel, C.C., Giavalisco, M., Pettini, M., Dickinson, M., Adelberger, K.L. (1996) ApJ 462, L17
- [25] Soifer, B. T., Neugebauer, G. (1991) A.J. 101, 354-61
- [26] Williams, R.E., Blacker, B., Dickisnon, M., Dixon, W., (1996) AJ 112, 1335
- [27] Wu, H., Zou, Z.L., Xia, X.Y., Deng, Z.G., (1998) A&AS, 127, 521