Proceedings of the 5th Huntsville Gamma-Ray Bursts Symposium (1999)
BeppoSAX and Ulysses data on the giant flare from SGR 1900+14
Abstract
The extraordinary giant flare of 1998 August 27 from SGR 1900+14 was the most intense event ever detected from this or any other cosmic source (even more intense than the famous March 5th 1979 event). It was longer than any previous burst from SGR1900+14 by more than one order of magnitude, and it displayed the same 5.16-s periodicity in hard X-rays that was detected in the low energy X-ray flux of its quiescent counterpart. The event was detected by several gamma-ray experiments in space, among them the Ulysses gamma-ray burst detector and the BeppoSAX Gamma Ray Burst Monitor. These instruments operate in different energy ranges, and a comparison of their data shows that the event emitted a strongly energy-dependent flux, and displayed strong spectral evolution during the outburst itself. Here we present a joint analysis of the BeppoSAX and Ulysses data, in order to identify the energy-dependent features of this event and understand some of the physical conditions in the environment of the neutron star which generated this flare.
Introduction
After several years of quiescence SGR 1900+14 became extremely active in May 1998. ASCA and RXTE observations after the 1998 May activity episode revealed a periodicity of 5.16 s in the quiescent X–ray (2–10 and 2–20 keV, respectively) emission with period derivative hurley99a ; kouveliotou99 . This spindown rate is consistent with a magnetar-strength field duncan92 ; thompson95 .
On 1998 August 27 a giant flare from SGR1900+14, lasting more than five minutes, was detected by Konus-Wind, Ulysses BeppoSAX and NEAR hurley99b ; feroci99 ; mazets99 . Gamma rays during the first second were extraordinarily intense, overwhelming detectors on several other spacecraft as well. The Compton Gamma-Ray Observatory was Earth-occulted for this flare. The 5.16 s neutron star rotation period was strongly detected during the giant flare. Indeed, the periodic signal was intense enough to produce a marked 5.16-second modulation in the height of the Earth’s ionosphere, which affected long-wavelength radio transmissions inan99 . After seconds, the flare evinced a 1.03 s repetitive pattern that is unlike any emission previously detected from any source feroci99 ; mazets99 . A radio afterglow was found with the Very Large Array frail99 . This source was apparent in the error box of SGR1900+14 on 1998 September 3, but it faded away in less than one week, providing evidence for an abrupt outflow of relativistic particles during the flare.
In this paper we show preliminary results of a comparative analysis of BeppoSAX and Ulysses observations of the August 27th event. Additional analysis, results and their interpretation may be found in feroci00 .
The instruments
The BeppoSAX Gamma Ray Burst Monitor (GRBM, frontera97 ; feroci97 ) consists of the four anticoincidence CsI(Na) detectors of the Phoswich Detection System (PDS, frontera97 ), forming a square box, surrounding the main PDS detectors and located in the core of the BeppoSAX payload. Each shield is 1 cm thick and has dimensions 27.5 x 41.3 cm. The GRBM electronics records data from each shield with both low (1 s) and high (8 ms) time resolution. The 1 s data consist of count rates in the 40-700 and 100 keV energy ranges. Additional details on the GRBM may be found in feroci97 .
The Ulysses GRB detector hurley92 consists of two 3 mm thick hemispherical CsI(Na) scintillators with a projected area of about 20 cm2 in any direction. The detector is mounted on a magnetometer boom far from the body of the spacecraft. The energy range is 25-150 keV. The lower energy threshold is set by a discriminator, and is in practice an approximate one; photons with energies keV can penetrate the housing and be counted either because of the rather poor energy resolution at low energies, or, in the case of very intense events, due to pulse pile-up. The instrument takes time history data with time resolutions of 31.25 ms for 64 s, and 0.5 s for the full duration of the event.
Data Analysis
Low Time Resolution Data
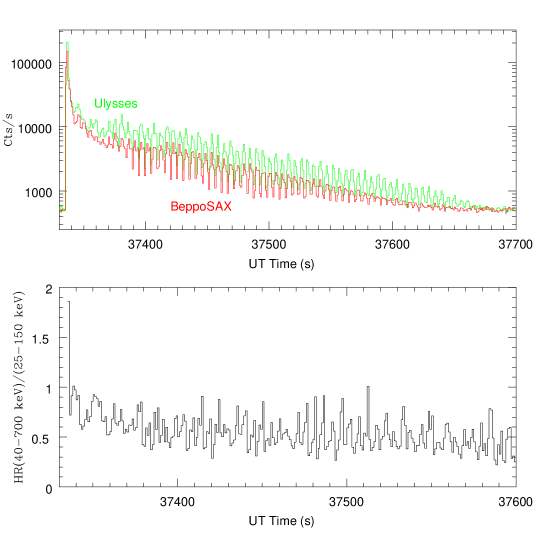
In Figure 1 (top panel) we show the event light curve as detected by the two above experiments. The 5.16-s pulsation is evident in both energy ranges for the entire duration of the event (300 s). Even if the low resolution data are independently synchronized with the onboard clocks of the two spacecrafts, and the event was detected at different UT times due to spatial separation, the relative timing between the two light curves turned out to be, purely by chance, synchronized within approximately 100 ms. This allows one to use the light curves in the two energy ranges (25-150 and 40-700 keV) to produce a hardness ratio as a function of time, with a time resolution of 1 s. The result is shown in Figure 1 (bottom panel).
It is clear from the hardness ratio plot that the energy spectrum of the emitted radiation significantly changes during each 5.16-s pulse. In fact, performing a Fast Fourier Transform of the hardness ratio curve we obtain the power density spectrum presented in Figure 2, where the fundamental harmonics at 0.2 Hz is clearly detected. The minor peaks are easily identified as well. The two peaks around 0.4 Hz derive from aliasing of the higher order harmonics, due to the limited frequency span. The peak at 0.08 Hz is actually spurious, deriving from the spinning motion of the Ulysses spacecraft at about 5 rpm. The modulation in the Ulysses count rate is likely due to a partial occultation by the carbon fiber magnetometer boom.

High Time Resolution Data
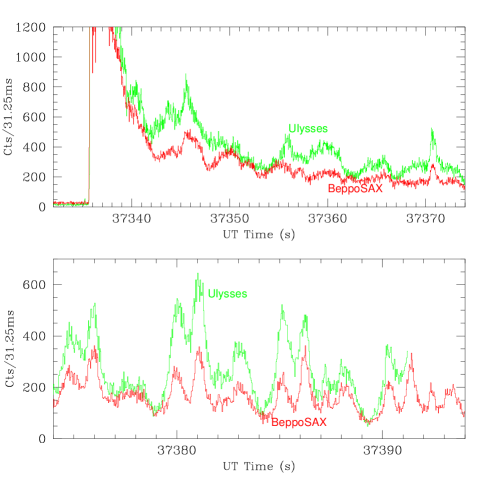
High time resolution data are available from both the instruments for a limited lapse of time. In particular, these Ulysses data stop about 60 s after the event onset, whereas the BeppoSAX/GRBM recorded the high resolution light curve for approximately 106 s after the trigger. In Figure 3 they are shown with a time resolution of 31.25 ms, over the time interval in which they are both available.
Conclusions
The data from experiments operating at different energy ranges (the Ulysses count rate is dominated by 10-40 keV photons, whereas only photons above 40 keV contribute to the BeppoSAX count rate) allow for a time-resolved study of the giant outburst from SGR 1900+14.
From the low time resolution data it appears that the energy spectrum of the emitted X-ray flux is strongly modulated by the 5.16-s rotation of the neutron star. From the high time resolution data in Figure 3, we see that the relative contribution of soft (i.e., Ulysses ) and hard (i.e., GRBM) X-rays changes over the spin phase, in a different way in subsequent pulses, at least during the initial 60 s of the event. It is also interesting to note that the soft counts usually exceed numerically the hard ones, except near the 5.16-s pulse minima, where they are basically equal. This indicates that harder emission persists during the occultation of a softer radiation beam.
Hence, both data sets indicate significant spectral evolution over the spin phase and from one pulse to another. These data likely reflect the complex behaviour of bubbles of relativistic plasma trapped by the star’s magnetosphere following a transient outflow that gave rise to the hard initial spike in the event light curve. The late-time stability of the four-peaked pulse shape (see also feroci99 ; mazets99 ) strongly suggests a multipolar structure for the magnetic field. These facts, in addition to the harder emission at the minima, suggest the existence of two spatially distinct emission components dominating the soft and hard energy domains, undergoing separate histories both in time and space.
References
- (1) Hurley, K. et al. 1999a, ApJ 510, L111
- (2) Kouveliotou, C. et al. 1999, ApJ 510, L115
- (3) Duncan, R.C. & Thompson, C., 1992, ApJ, 392, L9
- (4) Thompson, C., and Duncan, R.C., 1995, MNRAS, 275, 255
- (5) Hurley, K. et al. 1999b, Nature 397, 41
- (6) Feroci, M. et al. 1999, ApJ 515, L9
- (7) Mazets, E.P., et al., 1999, preprint (astro-ph/9905196 v2)
- (8) Inan, U., et al. 1999, Geophys. Res. Lett., 26(22), 3357
- (9) Frail, D., Kulkarni, S., and Bloom, J., 1999, Nature 398, 127
- (10) Feroci, M. et al. 1999, in preparation
- (11) Frontera, F. et. al. 1997, Astron. Astrophys. Suppl. Ser., 122, 357
- (12) Feroci, M. et al. 1997, SPIE Proceedings, 3114, 186
- (13) Hurley, K., et al. 1992, Astron. Astrophys. Suppl. Ser., 92(2), 401