Thermal and Dynamical Equilibrium in Two-Component Star Clusters
Abstract
We present the results of Monte Carlo simulations for the dynamical evolution of star clusters containing two stellar populations with individual masses and , and total masses and . We use both King and Plummer model initial conditions and we perform simulations for a wide range of individual and total mass ratios, and . We ignore the effects of binaries, stellar evolution, and the galactic tidal field. The simulations use stars and follow the evolution of the clusters until core collapse. We find that the departure from energy equipartition in the core follows approximately the theoretical predictions of Spitzer (1969) and Lightman & Fall (1978), and we suggest a more exact condition that is based on our results. We find good agreement with previous results obtained by other methods regarding several important features of the evolution, including the pre-collapse distribution of heavier stars, the time scale on which equipartition is approached, and the extent to which core collapse is accelerated by a small subpopulation of heavier stars. We briefly discuss the possible implications of our results for the dynamical evolution of primordial black holes and neutron stars in globular clusters.
1 Introduction
Remarkable advances have been made over the last three decades in our understanding of globular cluster dynamics (see, e.g., Meylan & Heggie 1997 for a recent review). The simple case of a two-component cluster is traditionally regarded as the second level of sophistication and therefore a logical challenge for new methods that have tackled the single-component case. Two-component clusters were originally examined because they better resemble real clusters, which contain a continuous spectrum of masses. While somewhat more realistic in this regard, clusters with only two mass components still represent a simplification with respect to real clusters. It has been suggested recently, however, that for a range of configurations in mass types and the relative size of the two populations, two-component clusters can resemble real clusters that are mostly comprised of compact objects and main-sequence stars (Kim, Lee, & Goodman 1998). Similarly, clusters containing both single main-sequence stars and primordial binaries can be modeled, in first approximation, as two-component systems, although dynamical interactions involving binaries are expected to play an important role for these systems (Gao et al. 1991). Perhaps the best reason to examine a simplified model of any stellar system, however, is to obtain a more profound understanding of individual physical processes.
Much of the discourse regarding two-component systems has focused upon the following questions. First, for what configurations of the cluster is dynamical equilibrium precluded (i.e., the system is not stable on dynamical time scales)? Second, for what configurations of the cluster is thermal equilibrium precluded (i.e., equipartition of kinetic energies between each component is not allowed)? Both questions originate from an analysis by Spitzer (1969), in which he noticed that simultaneous thermal and dynamical equilibrium is impossible for some clusters. In particular, the heavier stars sink into the center as they lose kinetic energy to the lighter stars during the approach to equipartition. If equipartition is not attained, then the heavier stars will continue sinking until their self-gravity dominates the cluster’s potential in the core. Shortly thereafter, the heavier component will undergo a gravothermal collapse, forming a small dense core comprised mainly of the heavier stars (Spitzer (1969)). Refinements to this analysis have obtained similar constraints upon the configurations of two-component clusters in dynamical and thermal equilibrium (Lightman & Fall (1978)).
Several methods have been used to address questions about dynamical and thermal equilibrium in two-component systems. These include the construction and study of one-parameter families of models in dynamical equilibrium (Kondrat’ev & Ozernoy (1982); Katz & Taff (1983)), Monte Carlo approaches to the numerical integration of the Fokker-Planck equation (Spitzer & Hart (1971)), direct integration of the Fokker-Planck equation in phase space (Inagaki & Wiyanto (1984); Kim, Lee, & Goodman (1998)), and also direct -body simulations (Portegies Zwart & McMillan 2000). The majority of work using any one of these methods has been undertaken at least partly in order to confirm Spitzer’s conclusion (Yoshizawa et al. (1978)) or refute it (Merritt (1981)).
Dynamical equilibrium is attained and maintained on time scales that are very short compared to the amount of time needed for relaxation or equipartition. A so-called “equilibrium model” (i.e., whose phase-space distribution function satisfies the equation for hydrostatic equilibrium) therefore resembles a possible stage or snapshot in the evolution of a dynamically stable cluster. It is interesting to construct a parametrized family of equilibrium models, for which equipartition is either assumed or the temperature ratio allowed to vary, in order to determine under what conditions the dynamical equilibrium becomes impossible. In the majority of previous work, the distribution functions of such families take the form of lowered Maxwellians or spatially-truncated isothermal spheres.
Yoshizawa et al. (1978) examined a linear series of equilibrium models of two-component isothermal spheres with reflecting walls and found that turning points of the total energy (stability limits) were positive for some clusters. In such cases, a cluster was not self-bounded and would dissociate if the walls were removed. These configurations, which were interpreted to preclude dynamical equilibrium, occurred under conditions corresponding closely to the ones Spitzer proposed. Katz & Taff (1983) examined the limits of stability for a linear series of equilibrium models of self-bounded two-component clusters with a lowered-Maxwellian velocity distribution. They found that the number of possible configurations for clusters in dynamical and thermal equilibrium were diminished dramatically in the regime that Spitzer proposed. Kondrat’ev & Ozernoy (1982) constructed a family of equilibrium models, based upon a generalization of the single-component King models, for which equipartition of kinetic energies was generally impossible. By contrast, Merritt (1981) described a one-parameter family of equilibrium models for which equipartition in the core is possible for all cluster configurations within Spitzer’s unstable regime. It seems clear, however, that these models violate an important assumption of Spitzer’s analysis, and that they are highly unrealistic (Merritt (1981)).
Few studies that examine the evolution of two-component systems have been undertaken for a wide range of cluster configurations and using the other methods mentioned above. Among the more notable efforts are the Monte Carlo calculations of Spitzer & Hart (1971; later extended to three-component systems by Spitzer & Shull 1975), which were interpreted to partially confirm Spitzer’s original analysis, and the direct Fokker-Planck integrations of Inagaki & Wiyanto (1984; see also Inagaki 1985), which also partially support Spitzer’s claim, although by examining a limited range of clusters that do not totally satisfy his assumptions. The former study finds that a single model, which belongs to the unstable regime in which equipartition is precluded, develops a collapsing subsystem of heavier stars. Both studies find that central equipartition of kinetic energies is never attained throughout the evolution of some clusters.
In this paper we present the results of calculations used to model the evolution of two-component clusters with a wide range of configurations. We examine several features of the evolution, including the tendency toward equipartition, the evolution of mass densities in the core, and the tendency for core collapse to be accelerated by the presence of a small subpopulation of heavier stars. Our aim is partly to assess the accuracy of Spitzer’s analysis and also the refinement supplied by Lightman & Fall (1978). We have used a new Monte Carlo code for modeling the evolution as a sequence of equilibrium models whose velocities are perturbed according to the average effect of long-range stellar encounters (Joshi, Rasio, & Portegies Zwart 2000a). Our initial two-component systems are isolated King and Plummer models with a subpopulation of heavier stars.
Our paper is organized as follows. In §2 we review the theoretical arguments that suggest conditions under which simultaneous dynamical and thermal equilibrium are not allowed. In §3 we discuss our numerical method and the quantities we calculate, and in §4 we present our main results. In the last section, §5, we discuss some additional comparisons between our findings and those of other studies, as well as some astrophysical implications of our results for subpopulations of compact objects in globular clusters.
2 Equipartition of Kinetic Energies in Two-Component Clusters
According to Spitzer (1969), simultaneous dynamical and thermal equilibrium is impossible for two-component star clusters within a certain range of configurations. Let us consider a cluster with stars of two masses, and , where . Moreover, let and be the total mass in each component. Spitzer assumed that , which is normally the case for real clusters. He concluded that for certain values of the ratios and , equipartition will not be attained as the heavier and lighter stars exchange kinetic energy, and hence the heavier stars will sink very far into the center. Moreover, the heat exchange with lighter stars promotes them to higher orbits, so that eventually insufficient numbers will remain in the center to conduct heat rapidly away from the heavier stars. If the mass-stratification proceeds far enough, then the self-gravity of the heavier stars will dominate the potential in the core, and this subsystem will undergo gravothermal collapse. The result is a very dense core comprised exclusively of heavier stars.
In his analysis, Spitzer begins by assuming global equipartition. Global equipartition is not realistic, however, because the relaxation and equipartition times vary greatly throughout the cluster, becoming longer than the age of the universe in the outer halo. In fact, we expect equipartition only in the inner region where relaxation times are shortest. His discussion is mostly unchanged by this, so long as we confine its relevance to processes in this inner region. We shall reproduce here only the main strategy of his argument and its conclusions. Let and represent the mean-square velocities of stars in each component. As mentioned, The assumption of equipartition implies that the temperature ratio is equal to unity,
| (1) |
Spitzer then applies a component-wise virial theorem, which for the heavier component gives
| (2) |
where the first term represents the gravitational self-binding energy of the heavier stars, is the virial radius of the heavier stars, is the density of the heavier stars at a distance from the center, is the total mass of the heavier stars contained within the radius , and is the volume element. Spitzer assumes that, since , the second term in the corresponding equation for can be ignored, and also that, since , the heavier stars will be concentrated in the center of the system and may be approximated by in equation (2). Spitzer & Hart (1971) noticed that the second assumption often does not hold strictly. In particular, even far into the evolution many heavier stars can still reside well outside of the core. Merritt (1981) constructed equilibrium models that violate this assumption by great amounts and discovered that equipartition is possible for some (admittedly unrealistic) configurations which can be realized for all values of and .
Under Spitzer’s assumptions, after a series of manipulations one obtains the following expression for the quantity , as a direct consequence of equation (1),
| (3) |
where and are the densities within the half-mass radii for each component, and where depends on the distribution of mass within the cluster. In particular, if we denote by and the rms and half-mass radius for the heavier component, respectively, then is given by
| (4) |
Spitzer estimates a value of 5.6 for . Merritt (1981) contests the value 3.5 assigned by Spitzer to for polytropes with between 3 and 5, but finds that it corresponds approximately to its minimum value, which, as we shall see, does not change Spitzer’s conclusion. In particular, since the RHS of equation (3) has a maximum value with respect to variation in , it follows that equipartition is possible only if does not exceed a critical value ,
| (5) |
Spitzer suggests that for smaller values of the individual mass ratio , the inequality (5) remains valid, except that as .
While it is useful to assess under what conditions simultaneous dynamical and thermal equilibrium are not expected, it is also interesting for our purposes to estimate the extent of departure from thermal equilibrium where dynamical equilibrium holds. To that end, let us maintain the condition stated in (2), while not insisting that in equation (1). By following the value through Spitzer’s analysis, we find that the temperature ratio has a lower bound for a given value of ,
| (6) |
Inagaki & Wiyanto (1984) performed an analysis similar to Spitzer’s, except by casting equations (1) and (2) in terms of core values for the component-wise total mass, mean-square velocity, and density. They obtained a minimum difference between the core temperatures of each component. Letting and denote the total mass contained within the core for the heavier and lighter components, respectively, and letting represent the core-radius of the lighter stars, this difference is given by:
| (7) |
For now, we note that the minimum ratio (given by the inequality [6]), and difference (given by eq. [7]) of component-wise temperatures increases with increasing values of the total mass ratio, and that this increase is steeper for increasing (in eq. [6], recall that as ).
Lightman & Fall (1978) developed an approximate theory for the core collapse of two-component clusters which resembles that of Spitzer. They examined two constant-density isothermal spheres representing the cores of the heavier and lighter components, where the radius of the former is smallest. By applying a component-wise virial theorem and several simplifying assumptions, they find a set of four ordinary differential equations for the virial radii and total masses in each component. They obtain the following condition for equipartition of energies between the two components, where we let and :
| (8) |
Solutions to the differential equations exhibit a minimum temperature ratio which they suggest bears the following approximate relation to ,
| (9) |
In this case also, the minimum temperature ratio increases with increasing values of the individual and total mass ratios.
The majority of attempts to evaluate the theoretical predictions of Spitzer (1969) and Lightman & Fall (1978) have met with moderate success. For example, Yoshizawa et al. (1978) obtained 0.25 for the value of in the case of spatially-truncated two-component isothermal spheres. Nevertheless, few investigations have examined models with a comprehensive range of individual and total mass ratios (outside of studies based upon turning points along a sequence of equilibrium models). In the next two sections we discuss the methods we used and results that we obtained for a relatively broad survey of the parameter space determined by and .
3 Numerical Methods and Definitions
We used a Monte Carlo method for modeling the dynamical evolution of clusters as a sequence of equilibrium models subject to regular velocity perturbations. The velocity perturbations represent the average effect of long-range stellar encounters (Hénon (1971)). Our Monte Carlo code has been described in detail by Joshi, Rasio, & Portegies Zwart (2000a) and Joshi, Nave, & Rasio (2000b). The code allows us to perform dynamical simulations for realistic clusters containing up to stars on a parallel supercomputer. In the present study, we ignore the effects of binaries, stellar evolution, and the galactic tidal field. Our units are defined in Joshi et al. (2000a, §2.8). The unit of length is close to the virial radius of the cluster, the mass is measured in units of the total initial cluster mass, and the unit of time is of order the initial half-mass relaxation time . In this paper, when reporting times in units of , we have adopted the same definition used in previous studies of two-component clusters since Spitzer & Hart (1971),
| (10) |
where is the total cluster mass, is the initial cluster half-mass radius, and is the average stellar mass.
We undertook two sets of calculations, hereafter called sets and . All calculations are performed for a cluster containing single stars. The initial model used in each calculation of set was a two-component King model (King (1966)). In particular, the velocities and positions for all stars with a mass were chosen according to the King model distribution function with dimensionless central potential . Although the initial King model is truncated at its finite tidal radius, we do not enforce that tidal boundary during the evolution, allowing the cluster to expand indefinitely. In each case, some fraction of the stars were then changed to a mass according to a chosen value of the total mass ratio . The initial ratio of mean temperatures in the heavier and lighter components was therefore . The initial models for calculations in the set were generated in a similar way, except using the Plummer distribution function (polytrope with ; see, e.g., Binney & Tremaine 1989). Both sets of calculations are listed in Table 1. The set includes calculations undertaken for a range of total mass ratios ( = to ) and a range of individual mass ratios ( = 1.5 to 6). The set comprises only 9 systems, including 4 studied by Inagaki & Wiyanto (1984), all with . Every calculation is terminated at core collapse, measured at the instant that a number density of (in our units) is attained in the core. Our results are not sensitive to the exact value of the core density used to terminate the calculation. However, the value of the core-collapse time determined numerically can have a large statistical uncertainty, particularly when the core is dominated by a small number of heavier stars near the end of the evolution (in those cases we estimate that the statistical uncertainty on the values of reported in Table 1 can be as large as %). The majority of our calculations require between CPU hours on an SGI/Cray Origin2000 supercomputer to reach core collapse.
The range of values we consider for and includes a number of astrophysically relevant cases. In particular, a subpopulation of neutron stars in a dense globular cluster might have (e.g., corresponding to for an average background stellar mass ) and depending on the neutron star retention fraction. A subpopulation of black holes might have and . Massive blue stragglers or primordial binaries containing main-sequence stars near the turn-off mass, would have and .
For each calculation we record several quantities at each program time step (the time steps are proportional to a fraction of the core relaxation time; see Joshi et al. 2000a). These continuous measurements include the total-cluster core radius and several component-wise Lagrange radii. Within each of these radii we also count the number of stars and calculate the mean temperature and mean mass density for each component. Of particular interest are the quantities calculated inside the core radius, where relaxation times are shortest and where thermal equilibrium is the most likely to occur. We use the customary definition for the total-cluster core radius (Spitzer (1987)),
| (11) |
where is the mean-square velocity and the mean density of stars at the center. We calculate the ratio of core densities in each component , and also the ratio of core temperatures. We also calculate the minimum core temperature ratio that is reached after approximately 90% of the pre-collapse evolution in all cases. Specifically, is calculated as the average temperature ratio from 90% to 95% of the core collapse time. The core collapse time and the time at which the core mass densities of each component become equal (i.e., ) are also measured. We report our main results in Table 1, and we discuss these in the following section.
4 Results
The evolution of the core temperature ratio is shown in Figure 1 for three calculations in the set (two-component King models): namely, for (top), (middle), and (bottom). Figure 2 shows the core temperatures of the lighter stars (top) and the heavier stars (bottom) for the case . Several features that we expect and that have been mentioned already in §2 are easily recognizable. The temperature ratio begins with a value and then decreases gradually as equipartition is approached. It is clear that reaches a minimum value that is greater than 1 for the case , so that equipartition is clearly never attained. Equipartition is nearly attained for , and to within 5% for . It is clear from Figure 2 that the heavier component cools initially, then maintains a constant mean kinetic energy, and then begins to heat prior to core collapse. At the same time, the lighter component steadily becomes hotter as it receives energy from the heavier component. The temperature ratio in the last time steps becomes very noisy because the temperatures are computed using the relatively few stars that remain in the core.
The temperature ratio reaches a minimum value at different times with respect to core collapse for each of the models shown in Figure 1. In cases where the minimum value is greater than 1, it sometimes appears that the gravothermal catastrophe has beaten the approach to equipartition. In such cases, one may ask whether an initial model with a less concentrated spatial distribution and a different initial relaxation time would yield a different minimum temperature ratio. In fact, we find that is robust with respect to changes in the initial value of the dimensionless potential . The evolution of the temperature ratio for three calculations, where , 5, and 10 for and , are shown in Figure 3. In all three cases the minimum temperature ratio is approximately 1.55.
The evolution of the core mass density ratio is shown in Figure 4 for the same three clusters and in the same order. The core mass densities of each component are shown in Figure 5 for the model with . One can see clearly that, as increases, the core mass densities in each component become equal sooner with respect to core collapse. That is, for larger the self-gravity of the heavier stars dominates the potential in the core for a longer period prior to the onset of the gravothermal catastrophe. Moreover, we can see that, although the core density is initially dominated by the lighter stars, the heavier stars overtake and exceed the density of lighter stars by more than an order of magnitude prior to core collapse for and .
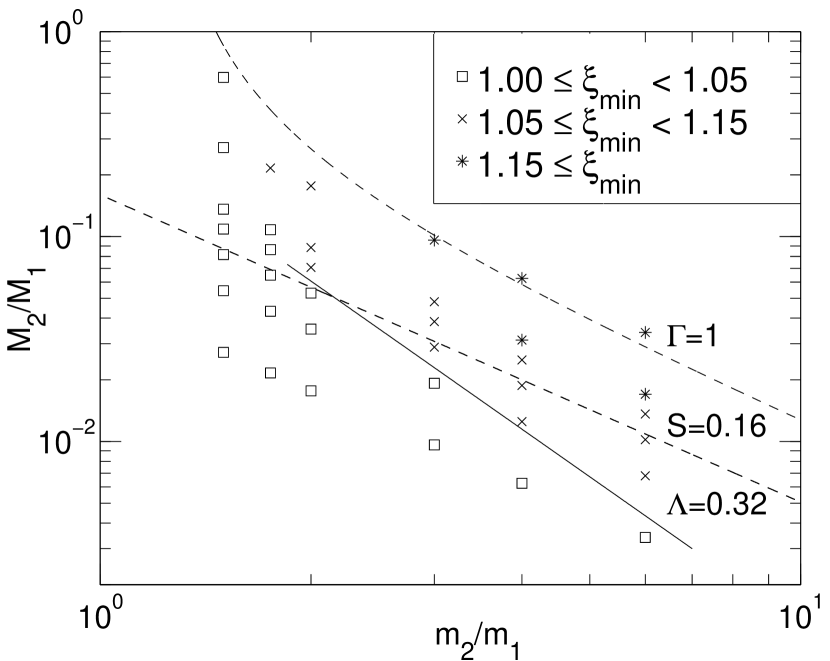
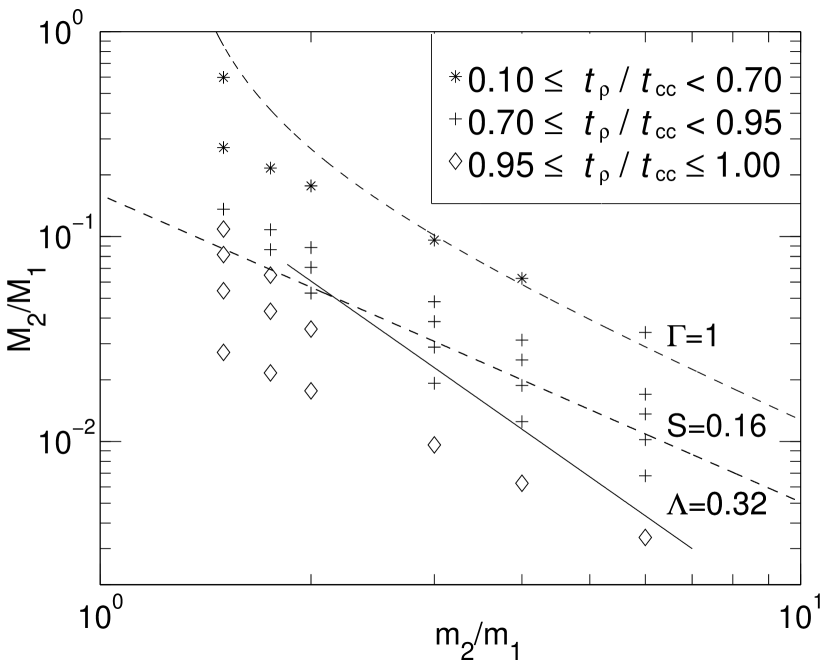
Approximate values of the minimum core temperature ratio are plotted using three symbols in the parameter space determined by and in Figure 6 for 37 calculations in the set . Also drawn are the Spitzer and Lightman-Fall “stability boundaries,” above which simultaneous dynamical and thermal equilibrium are supposedly prohibited ( and , respectively; cf. eqs. [5] & [8]). Our simulations allow us to determine with a numerical accuracy of about 5%. Specifically, is calculated as the average core temperature ratio from 90% to 95% of the pre-collapse evolution, and this average has a standard deviation of approximately 0.05 in our calculations for stars. Therefore, those calculations marked with a “” in Figure 6 have been determined to reach equipartition within our numerical accuracy. One can see that the Spitzer boundary is approximately respected for . By comparison, the Lightman-Fall boundary falls well inside the range of clusters which have clearly not attained equipartition. In spite of this, the Lightman-Fall boundary better reproduces the shape of boundaries between regions of constant . A more properly-drawn Spitzer boundary has a similar shape, recalling that as . Based upon the results shown in Figure 6, we propose our own condition for equipartition,
| (12) |
The boundary determined by equation (12) is strictly valid for , and is also drawn in Figure 6. For , equipartition is achieved for all clusters considered. For , extrapolation of equation (12) seems reasonable.
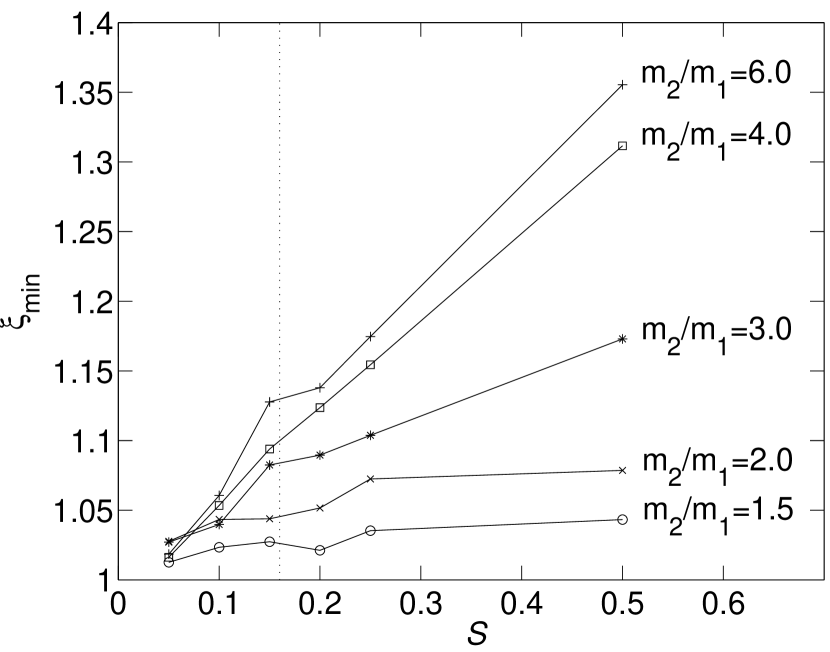
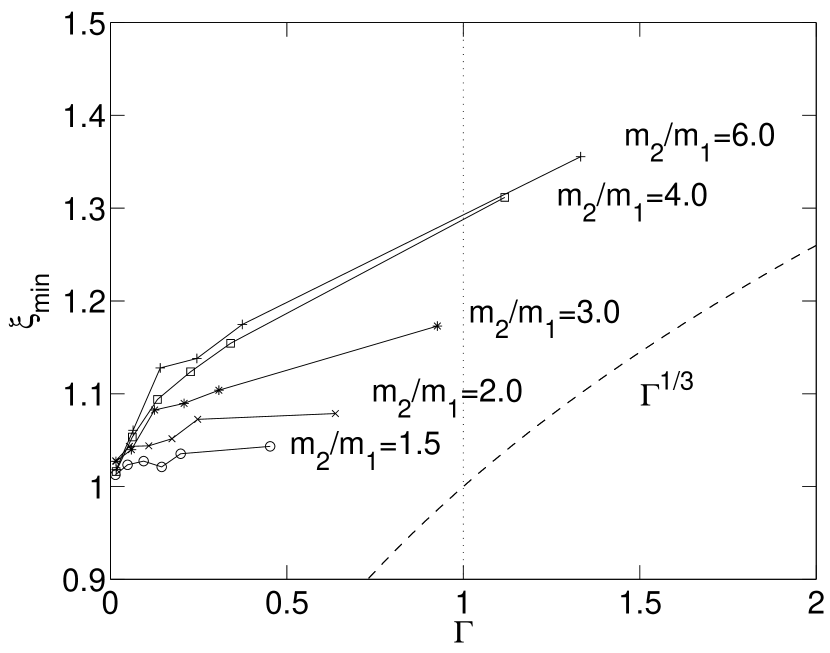
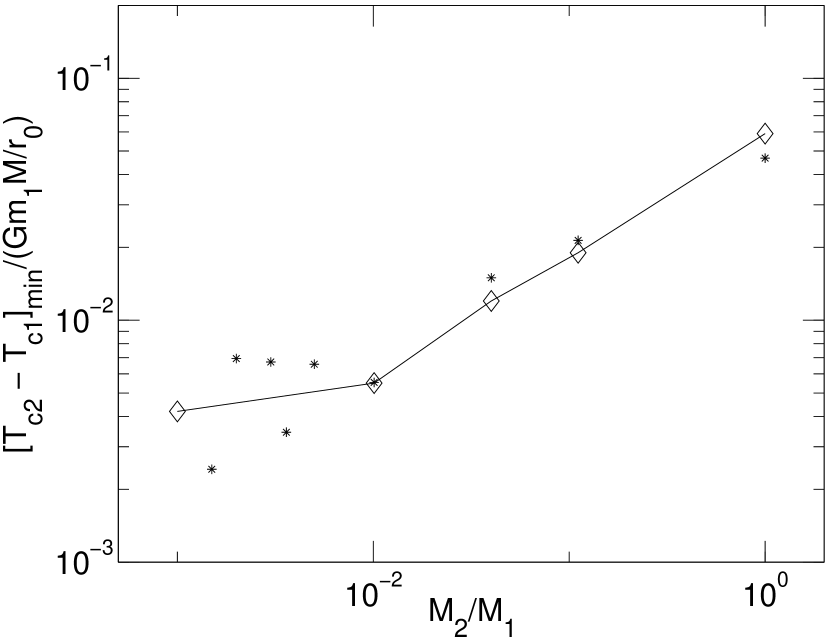
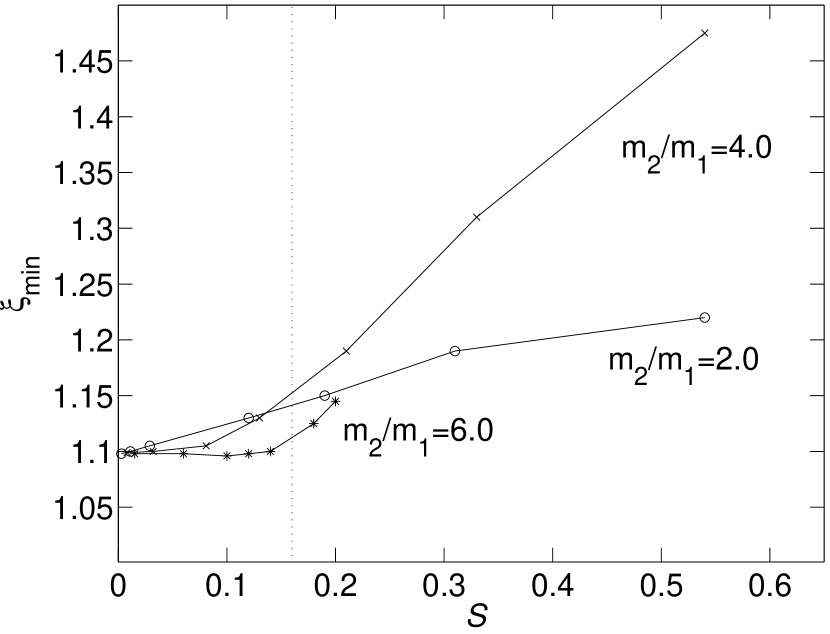
The dependence of on for several values of is shown in Figure 7. Also drawn is the Spitzer stability boundary. These curves are broadly consistent with trends anticipated by the inequality (6). In particular, increases with , and the initial slope of this increase becomes larger with increasing (again recalling that as ). The dependence of on for several values of is shown in Figure 8. Also drawn is the value of anticipated by equation (9), and the Lightman-Fall stability boundary. One can see that, while the numerical results are displaced from the predicted curve, they have the same curvature and display a similar trend. The minimum temperature difference for calculations in the set (two-component Plummer models) are shown in Figure 9, where they are compared with the results of Inagaki & Wiyanto (1984). Here, agreement is excellent except in the limit of small , where the temperature of the heavier component is calculated using very few stars, so that the difference is characterized by a large amount of noise. As a last comparison, we note that, using a Monte Carlo scheme different from ours, Spitzer & Hart (1971) found that for a Plummer model with and , whereas for the same system we obtain .
Recall that is the time at which the mass densities of each component become equal in the core. Approximate values of the time as a fraction of the core collapse time are plotted using three symbols in the parameter space determined by and in Figure 10, for 37 calculations in the set . This plot confirms the trend anticipated by the previous examination of three individual clusters (Fig. 4). Namely, the amount of time — as a fraction of the core-collapse time — during which the heavier stars dominate the potential in the core increases with . The trends appear not to respect any of the previous stability boundaries very well, but our condition (12) fares best. They may nevertheless shed light on the related question of whether a dense subsystem of heavy stars collapses independently, since the self-gravity of the heavier stars must dominate the potential in the core in order for this to happen. Where equipartition is attained, the mass segregation is retarded or stopped, so that equal mass densities may not occur until core collapse (i.e., ).
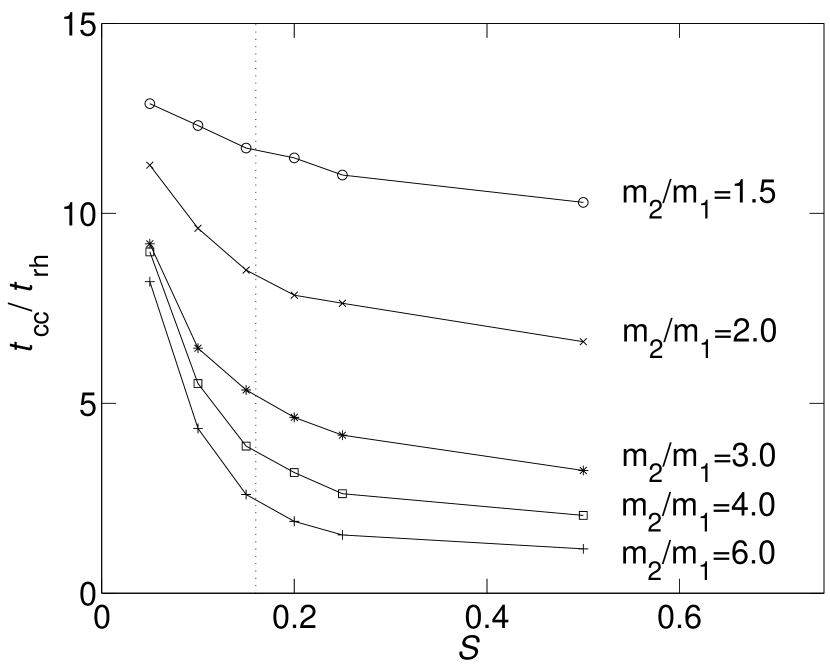
All of the calculations were terminated at core-collapse, at which time the radius containing 1% of the mass in the heavier component diminishes sharply. The time is measured at the instant when a number density of in our units is attained within the core (see §3). The variation of the core collapse time with for several values of is shown in Figure 11. The trends confirm that the onset of core collapse is accelerated by the presence of a small and heavier subpopulation, in agreement with the findings of others (Inagaki & Wiyanto (1984); Inagaki 1985; Quinlan (1996)).
5 Discussion
In this section we discuss several features of the evolution in more detail, and we mention some possible astrophysical applications of our results to the evolution of compact stellar remnants in globular clusters.
The temperature ratio in Figure 1 initially has the value . While this is an artifact of the way our initial models were constructed, happens also to be the most realistic value of for equilibrium models with a relatively shallow potential. In families of equilibrium models it is typical to find that as (Kondrat’ev & Ozernoy (1982), Katz & Taff (1983)). In trials for which initial models were modified so that had some value other than , a brief period of rapid relaxation ensued which restored the value . This effect has been observed in simpler models of the evolution calculated using other methods (Lightman & Fall (1978)).
In the core, the initial behavior of the temperature ratio is mostly determined by the temperature of the heavier component, while the mean kinetic energy of the lighter stars, which are more abundant at first, increases gradually (Fig. 2). Spitzer (1969) suggested that the approach to equipartition is characterized by the exponential decay of kinetic energy in the heavier component, with a time constant equal to twice the so-called equipartition time,
| (13) |
where is a relaxation time for the stars of mass . In the case where the mean-square velocities of each component are initially equal, the initial equipartition time is . (It should be noted that decreases as equipartition is approached.) This characterization of the decline in kinetic energy of heavier stars agrees very well with our results for stars contained within the half-mass radius, where we assume , the initial half-mass relaxation time for the cluster as a whole. In particular, the kinetic energy of the heavier component diminishes to a fraction of its initial value (after subtracting its minimum value for the entire evolution) within for , , and within for , , in good agreement with the theory (which predicts a time ). However, we find that equipartition is approached on a similar time scale in the core, where the theory predicts that should be shorter by approximately , and hence agreement is poor (the ratio of initial core and half-mass relaxation times for King models with is approximately 1/5; see Quinlan (1996)).
A leveling in the temperature ratio at a minimum value greater than 1 has been observed in calculations using other methods as well (Inagaki & Wiyanto (1984), Lightman & Fall (1978)). We find that this leveling is approximately coincident with the heavier stars reaching their maximum numbers within the core. Inagaki & Wiyanto (1984) found that an increase in the core temperature ratio prior to or during collapse is coincident with , the time at which equal mass densities are attained in the core. While we are not able to resolve adequately the late-collapse behavior of (because our calculation loses accuracy in this regime), it is clear from Figure 2 that the heavier component begins to heat prior to collapse. Indeed, we find that the temperature of the heavier component does not begin to rise until .
Katz & Taff (1983) examined the turning points in a linear series of equilibrium models. In particular, they studied a one-parameter family of self-bounded isolated equilibrium models with a lowered-Maxwellian velocity distribution. Turning points representing the limits of stability for dynamical equilibrium were obtained for several values of and in terms of maximum possible values of the dimensionless potential . Katz & Taff also calculated the core temperature ratio that corresponds to each maximum value of . Since for their models was found to approach 1 for large values of , the core temperature ratios calculated for each turning point represent the minimum allowed value of for given values of and . These are plotted with respect to for several values of in Figure 12 and should be compared with our results, shown in Figure 7. While these numbers exhibit a similar trend with for given , the trend in evidently disagrees with our results, and therefore also the prediction of the inequality (6). It is important to bear in mind, however, that these ratios are obtained just for the members of this particular family, which do not necessarily represent states that can be obtained by real dynamical processes. Our results contradict those of Katz & Taff (1983) insofar as we find clusters with smaller values of for identical values of and , and which appear to be stable on dynamical time scales. Katz & Taff found that the number of possible configurations for their models in dynamical equilibrium diminish sharply for . It is interesting to note also that the values they obtain for appear not to diminish below 1.10 for small values of .
We concur with the findings of Spitzer & Hart (1971) that many heavier stars remain outside the core throughout the evolution. This is clear from plots of Lagrange radii as a function of time for the heavier component (Fig. 13). This casts doubt on the assumption, committed in Spitzer’s original analysis, that all of the heavier stars quickly become concentrated in the core (see §2). In particular, we find that for , , and , the radius containing of the mass in the heavier component diminishes to only of its initial value (and hence remains larger than the core radius) throughout the evolution. Nevertheless, by the onset of core collapse, we frequently observe for calculations with large that no lighter stars remain in the core.
Our results may have important implications for the dynamical evolution of various subpopulations of interesting objects in globular clusters. In particular, a subcomponent of primordial black holes with is expected to remain far from energy equipartition with the rest of the cluster, and to evolve very quickly to core collapse on its own relaxation time scale. For a typical cluster IMF (initial mass function), and assuming that all black holes formed initially by the stellar population are retained in the cluster, we expect , well above our stability boundary in Figure 6. Recent -body simulations for clusters containing primordial black holes indicate that, after reaching core collapse, the dense subcluster of black holes evaporates quickly in the background cluster potential. Three-body processes occurring in the post-collapse phase produce a significant number of tight black hole binaries that will coalesce in a few billion years, making these binaries important sources of gravitational waves for current ground-based laser interferometers (Portegies Zwart & McMillan 2000; see also Kulkarni, Hut, & McMillan 1993 and Sigurdsson & Hernquist 1993). For neutron stars, with , our results suggest that equipartition can be reached if the fraction of the total cluster mass in neutron stars is . This fraction is higher than would be predicted for a standard cluster IMF and neutron star progenitor masses (even if, in contrast to what is suggested by many observations, neutron stars were born without the kicks that might eject a large fraction from the cluster). However, many multi-mass King models and dynamically evolving Fokker-Planck models of globular clusters based on fits to both photometric and kinematic data suggest that much higher fractions of neutron stars may be present in many clusters. For example, the recent Fokker-Planck models of Murphy et al. (1998) for 47 Tuc suggest that 4.6% of the total cluster mass is in the form of dark stellar remnants of mass . With such a high mass fraction, it is possible that the neutron stars in 47 Tuc may remain out of energy equipartition with the rest of the cluster. More sophisticated dynamical simulations taking into account the full mass spectrum of the cluster, stellar evolution, and binaries, will be necessary to resolve the issue.
6 Summary and Conclusions
Although we have omitted the effects of binaries (which have been shown to retard the onset of core collapse, see, e.g., Gao et al. 1991) and also stellar evolution (which can have important implications for the early evolution, see Joshi et al. 2000b), the following observations and conclusions seem justified:
-
•
For some two-component clusters the core temperature ratio becomes constant over some fraction of the evolution at a minimum value greater than 1, in agreement with previous results obtained using other methods.
-
•
The departure from equipartition calculated for a range of individual and total mass ratios approximately respects the theoretical predictions of Spitzer (1969) and Lightman & Fall (1978). The agreement with Spitzer is reasonable for , and the Lightman-Fall stability boundary () appears to reflect the shape of regions of constant in the parameter space determined by and , although it lies well inside the region occupied by clusters for which equipartition is clearly not attained. A more accurate boundary that is suggested by our results is given by equation (12). The trend in the minimum values predicted for the temperature ratio by Lightman & Fall (1978) is similar to what we observe.
-
•
Stars in the heavier component do not immediately fall into the cluster core as assumed by Spitzer in his analysis, and instead many remain well outside the core throughout the evolution.
-
•
The approach to equipartition within the half-mass radius appears to occur on the time scale , as suggested by Spitzer (1969; see eq. [13]).
-
•
A core temperature ratio of appears to be a robust quantity for equilibrium models with a relatively shallow potential, in agreement with previous results obtained using other methods.
-
•
For clusters with and , core collapse times decrease with increasing and , in agreement with previous results.
References
- Binney & Tremaine (1989) Binney, J., & Tremaine, S. 1989, Galactic Dynamics (Princeton, PUP)
- Gao et al. (1991) Gao, B., Goodman, J., Cohn H., & Murphy, B. 1991, ApJ, 370, 567
- Hénon (1971) Hénon, M. 1971, Ap&SS, 14, 151
- Inagaki (1985) Inagaki, S. 1985, in IAU Symposium 113, The Dynamics of Star Clusters, ed. J. Goodman & P. Hut (Dordrecht: Reidel), 269
- Inagaki & Wiyanto (1984) Inagaki, S., & Wiyanto, P. 1984, PASJ, 36, 391
- Joshi, Rasio, & Portegies Zwart (2000) Joshi, K. J., Rasio, F. A., & Portegies Zwart, S. 2000a, submitted to ApJ, [astro-ph/9909115]
- Joshi, Nave, & Rasio (2000) Joshi, K. J., Nave, C. P., & Rasio, F. A. 2000b, submitted to ApJ, [astro-ph/9912155]
- Katz & Taff (1983) Katz, J., & Taff, L. G. 1983, ApJ, 264, 476
- Kim, Lee, & Goodman (1998) Kim, S. S., Lee, H. M., & Goodman, J. 1998, ApJ, 495, 786
- King (1966) King, I. R., 1966, AJ, 71, 64
- Kondrat’ev & Ozernoy (1982) Kondrat’ev, B. P., & Ozernoy, L. M. 1982, Ap&SS, 84, 431
- Kulkarni et al. (1993) Kulkarni, S.R., Hut, P., & McMillan, S.L.W. 1993, Nature, 364, 421
- Lightman & Fall (1978) Lightman, A. P., & Fall, S. M. 1978, ApJ, 221, 567
- Merritt (1981) Merritt, D. 1981, AJ, 86, 318
- Meylan & Heggie (1997) Meylan, G., & Heggie, D.C. 1997, A&AR, 8, 1
- Murphy et al. (1998) Murphy, B.W., Moore, C.A., Trotter, T.E., Cohn, H.N., & Lugger, P.M. 1998, AAS Meeting 193, 60.01
- Portegies Zwart & McMillan (2000) Portegies Zwart, S., & McMillan, S. 2000, ApJ Letters, in press, [astro-ph/9910061]
- Quinlan (1996) Quinlan, G. D., 1996, New Astronomy, 1, 255
- Sigurdsson & Hernquist (1993) Sigurdsson, S., & Hernquist, L. 1993, Nature, 364, 423
- Spitzer (1969) Spitzer, L., Jr. 1969, ApJ, 158, L139
- Spitzer (1987) Spitzer, L., Jr. 1987, Dynamical Evolution of Globular Clusters (Princeton University Press)
- Spitzer & Hart (1971) Spitzer, L., Jr., & Hart, M. H. 1971, ApJ, 166, 483
- Spitzer & Shull (1975) Spitzer, L., Jr., & Shull, J.M. 1975, ApJ, 201, 773
- Yoshizawa et al. (1978) Yoshizawa, M., Inagaki, S., Nishida, M. T., Kato, S., Tanaka, Y., & Watanabe, Y. 1978, PASJ, 30, 279
| Model | |||||||
|---|---|---|---|---|---|---|---|
| 0.05 | 1.50 | 0.0272 | 1,782 | 1.010 | 12.8 | 12.8 | King |
| 0.05 | 1.75 | 0.0216 | 1,219 | 1.020 | 12.0 | 12.0 | King |
| 0.05 | 2.00 | 0.0176 | 876 | 1.028 | 11.2 | 11.2 | King |
| 0.05 | 3.00 | 0.00962 | 320 | 1.027 | 9.2 | 9.2 | King |
| 0.05 | 4.00 | 0.00625 | 156 | 1.016 | 8.7 | 9.0 | King |
| 0.05 | 6.00 | 0.00340 | 57 | 1.018 | 8.2 | 8.2 | King |
| 0.10 | 1.50 | 0.0544 | 3,502 | 1.023 | 12.3 | 12.3 | King |
| 0.10 | 1.75 | .0432 | 2409 | 1.035 | 10.9 | 11.1 | King |
| 0.10 | 2.00 | 0.0354 | 1,737 | 1.043 | 9.2 | 9.6 | King |
| 0.10 | 3.00 | 0.0192 | 637 | 1.039 | 5.9 | 6.4 | King |
| 0.10 | 4.00 | 0.0125 | 311 | 1.053 | 4.9 | 5.5 | King |
| 0.10 | 6.00 | 0.00680 | 113 | 1.061 | 3.7 | 4.3 | King |
| 0.15 | 1.50 | 0.0816 | 5,162 | 1.027 | 11.5 | 11.7 | King |
| 0.15 | 1.75 | 0.0648 | 3570 | 1.043 | 9.7 | 10.1 | King |
| 0.15 | 2.00 | 0.0530 | 2,583 | 1.044 | 7.5 | 8.5 | King |
| 0.15 | 3.00 | 0.0289 | 953 | 1.082 | 4.4 | 5.3 | King |
| 0.15 | 4.00 | 0.0188 | 467 | 1.094 | 3.3 | 3.9 | King |
| 0.15 | 6.00 | 0.0102 | 170 | 1.128 | 2.4 | 2.6 | King |
| 0.20 | 1.50 | 0.109 | 6,767 | 1.021 | 11.0 | 11.5 | King |
| 0.20 | 1.75 | 0.0864 | 4,704 | 1.049 | 8.4 | 9.5 | King |
| 0.20 | 2.00 | 0.0707 | 3,415 | 1.052 | 6.8 | 7.8 | King |
| 0.20 | 3.00 | 0.0385 | 1,267 | 1.090 | 3.8 | 4.6 | King |
| 0.20 | 4.00 | 0.0250 | 621 | 1.124 | 2.6 | 3.2 | King |
| 0.20 | 6.00 | 0.0136 | 226 | 1.138 | 1.6 | 1.9 | King |
| 0.25 | 1.50 | 0.136 | 8,318 | 1.035 | 10.3 | 11.0 | King |
| 0.25 | 1.75 | 0.108 | 5,812 | 1.049 | 8.1 | 9.2 | King |
| 0.25 | 2.00 | 0.0883 | 4232 | 1.072 | 6.2 | 7.6 | King |
| 0.25 | 3.00 | 0.0481 | 1,578 | 1.104 | 3.2 | 4.2 | King |
| 0.25 | 4.00 | 0.0313 | 775 | 1.154 | 2.0 | 2.6 | King |
| 0.25 | 6.00 | 0.0170 | 283 | 1.175 | 1.2 | 1.5 | King |
| 0.50 | 1.50 | 0.272 | 15,358 | 1.043 | 6.9 | 10.2 | King |
| 0.50 | 1.75 | 0.216 | 10,986 | 1.057 | 5.0 | 8.4 | King |
| 0.50 | 2.00 | 0.176 | 8,121 | 1.079 | 3.8 | 6.6 | King |
| 0.50 | 3.00 | 0.0962 | 3,108 | 1.173 | 2.0 | 3.2 | King |
| 0.50 | 4.00 | 0.0625 | 1,539 | 1.312 | 1.4 | 2.0 | King |
| 0.50 | 6.00 | 0.0340 | 564 | 1.355 | 1.0 | 1.2 | King |
| 1.10 | 1.50 | 0.599 | 28,529 | 1.046 | 1.64 | 10.2 | King |
| 1.24 | 5.0 | 0.111 | 2,172 | 1.60 | 0.7 | 1.2 | King |
| 0.0042 | 2.00 | 0.0015 | 74 | 1.008 | 14.5 | 14.5 | Plummer |
| 0.0057 | 2.00 | 0.0020 | 101 | 1.021 | 14.3 | 14.3 | Plummer |
| 0.0085 | 2.00 | 0.0030 | 150 | 1.021 | 14.0 | 14.0 | Plummer |
| 0.0101 | 2.00 | 0.0036 | 178 | 1.008 | 13.9 | 13.9 | Plummer |
| 0.0141 | 2.00 | 0.0050 | 249 | 1.021 | 13.7 | 13.7 | Plummer |
| 0.0286 | 2.00 | 0.0101 | 503 | 1.005 | 12.8 | 12.8 | Plummer |
| 0.113 | 2.00 | 0.040 | 1,960 | 1.049 | 9.0 | 9.3 | Plummer |
| 0.314 | 2.00 | 0.111 | 5,262 | 1.066 | 5.6 | 7.5 | Plummer |
| 2.824 | 2.00 | 1.000 | 33,333 | 1.127 | 0.014 | 7.5 | Plummer |