A photometric and spectroscopic study of the brightest northern cepheids. III. A high-resolution view of Cepheid atmospheres ††thanks: Based on observations obtained at David Dunlap Observatory, Canada
Abstract
We present new high-resolution spectroscopic observations ( 40000) of 18 bright northern Cepheids carried out at David Dunlap Observatory, in 1997. The measurements mainly extend those of presented in Paper I (Kiss 1998) adding three more stars (AW Per, SV Vul, T Mon). The spectra were obtained in the yellow-red spectral region in the interval of 5900 Å and 6660 Å, including strong lines of sodium D and H. New radial velocities determined with the cross-correlation technique and the bisector technique are presented. The new data are compared with those recently published by several groups. We found systematic differences between the spectroscopic and CORAVEL-type measurements as large as 1–3 km s-1 in certain phases.
We performed Baade-Wesselink analysis for CK Cam discovered by the Hipparcos satellite. The resulting radius is 311 R⊙, which is in very good agreement with recent period-radius relation by Gieren et al. (1999). It is shown that the systematic velocity differences do not affect the Baade-Wesselink radius more than 1% for CK Cam.
Observational pieces of evidence of possible velocity gradient affecting the individual line profiles are studied. The full-width at half minimum (FWHM) of the metallic lines, similarly to the velocity differences, shows a very characteristic phase dependence, illustrating the effect of global compression in the atmosphere. The smallest line widths always occur around the maximal radius, while the largest FWHM is associated with the velocity reversal before the minimal radius. Three first overtone pulsators do not follow the general trend: the largest FWHM in SU Cas and SZ Tau occurs after the smallest radius, during the expansion, while in V1334 Cyg there are only barely visible FWHM-variations. The possibility of a bright yellow companion of V1334 Cyg is briefly discussed. The observed line profile asymmetries exceed the values predicted with a simple projection effect by a factor of 2–3. This could be associated with the velocity gradient, which is also supported by the differences between individual line velocities of different excitation potentials.
keywords:
stars: atmospheres – stars: fundamental parameters – Cepheids1 Introduction
Detailed understanding of Cepheid variables, as strictly periodic pulsating stars with supersonic atmospheric motions, requires spectroscopic observations in a wide wavelength interval with high spectral resolution and good phase coverage. The published high-resolution (at least ) Cepheid spectroscopy addressed to the kinematic and dynamic phenomena covers only a sample of few bright stars. The recently presented extensive optical observations are as follows: Wallerstein et al. (1992) – W Sgr, Pav, S Mus, S Nor, Dor, Y Oph, U Car; Butler (1993) – FF Aql, Cep, Aql, X Cyg; Breitfellner & Gillet (1993a,b,c) – Cep, Aql, S Sge, X Cyg; Sabbey et al. (1995) – Cep, Aql, Gem, X Sgr; Baldry et al. (1997) – Car; Butler & Bell (1997) – Cep, Aql, X Cyg; Gillet et al. (1999) – Cep. Obviously, the overwhelming majority of the northern classical Cepheids – except a few (3–4) stars – suffers from the observational neglect in this point of view. This fact turned our attention to the topic and the first results based on echelle spectroscopy were already published in Kiss (1998).
The problem of spectral line formation in a moving stellar atmosphere was studied theoretically by Karp (1978). He showed that the different Doppler-shifts observed in lines of different strengths depend on the ionization balance variations as well as on the velocity gradient. Butler (1993) presented phase dependent velocity differences between lines of different excitation and ionizations. He found up to 5 km s-1 velocity residuals compared to high excitation potential (EP) Fe I lines during the phase of rapidly decreasing velocity. This important issue was explored in much details by Sabbey et al. (1995). They discussed the importance of line profile asymmetries when measuring radial velocities. In an earlier paper of Wallerstein et al. (1992) a comparison between different measuring techniques was done with similar purposes. One of the main conclusions in these papers is that assigning a Doppler-shift to a specific portion of the line profiles is a difficult and ambiguous task. Recently, Vinkó et al. (1999) studied the limitations of precise radial velocity measurements in Cepheid atmospheres and concluded that there is a natural limit of a few km s-1, which could not be overstepped. They also showed that CORAVEL-type radial velocity (i.e. cross-correlation velocity smoothed over the whole visible spectral region) curves may differ from those obtained from a selected set of spectral lines.
Another question concerning the variable line profiles is the atmospheric motions in classical Cepheids described by the turbulence variations. Turbulence is considered to be one of the most important line broadening mechanisms besides rotation, although its physical meaning is still unclear. CORAVEL-type measurements (Benz & Mayor 1982, Bersier & Burki 1996) led to the determination of turbulence variations in certain Cepheids, although these studies have neglected the effect of possible velocity gradient. Bersier & Burki (1996) pointed out the similarity of acceleration and turbulence curves with local maxima around the velocity reversal. Breitfellner & Gillet (1993a,b,c) used a nonlinear, nonadiabatic model of pulsation in order to determine an excess FWHM of the observed spectral lines. They analyzed four stars with different periods and found different turbulent velocity curves. Recently, Gillet et al. (1999) presented FWHM variations for Cep with excellent phase coverage, concluding that the strongest peak in the turbulent velocity curve at =0.85 is associated with the global atmospheric compression. They also suggested the possibility of turbulence amplification induced by shock waves of moderate intensities.
The main aim of this paper is to present new spectroscopic observations for a larger sample of Cepheid variables covering a wider period range. The (above mentioned) earlier papers dealt almost exclusively with fundamental pulsators, while in the short-period domain there are a few bright overtone Cepheids (e.g. SU Cas, DT Cyg, SZ Tau). Bersier & Burki (1996) suggested the different turbulence behaviour of classical and s-Cepheids as a possible mode-discriminator. Therefore, beside the new radial velocity data, we examine the fine spectral differences between fundamental and overtone pulsators.
The paper is organised as follows. The observations are described in Sect. 2. New radial velocities together with the earlier ones are discussed in Sect. 3, Sect. 4 deals with the line profile analysis (variations of the FWHM and the asymmetries along the pulsational cycle). A summary is given in Sect. 5.
2 Observations
The high-resolution spectroscopic observations were carried out at David Dunlap Observatory with the echelle spectrograph attached to the 74-inch telescope in 1997 September. The detector and the setup was the same as used by Kiss (1998), except the cross-grating, which was replaced by the one with 600 lines/mm. Therefore, we detected 12 orders with dispersion of 3.8 Å mm-1 giving a resolution of at H. All orders covered about 40 Å between 5860 and 6660 Å with 25 Å gaps between them. In this spectral region we could identify more than 100 lines, the strong sodium D doublet, H and photospheric metal (mostly Fe I) lines. One order was highly, another four were partially contaminated by atmospheric telluric lines, which were monitored every night with observing the rapidly rotating bright telluric standard HD 177724 (V=2.99 mag, spectral type A0V). As telluric lines change with airmass and time, we did not apply telluric line corrections, only excluded the affected spectral region from the further analysis. The exposure times were between 5 and 40 min depending on the target brightness and atmospheric conditions in order to reach a signal-to-noise ratio of 50–250. The considerably high cosmic ray contamination after 30 minutes did not allow the use of longer exposures.
| Star | Vmean | Vmin | Epoch | Period (d) |
|---|---|---|---|---|
| FF Aql | 5.18 | 5.68 | 50102.387 | 4.470936 |
| Aql | 3.48 | 4.39 | 50100.861 | 7.176726 |
| RT Aur | 5.00 | 5.82 | 50101.159 | 3.728198 |
| SU Cas | 5.70 | 6.18 | 50100.156 | 1.949325 |
| Cep | 3.48 | 4.37 | 50000.977 | 5.366316 |
| X Cyg | 5.85 | 6.91 | 50007.597 | 16.38613 |
| DT Cyg | 5.57 | 5.96 | 50102.487 | 2.499086 |
| V1334 Cyg | 5.77 | 5.96 | 50102.549 | 3.332765 |
| Gem | 3.62 | 4.18 | 44232.443 | 10.1498 |
| S Sge | 5.24 | 6.04 | 50105.348 | 8.382146 |
| SZ Tau | 6.33 | 6.75 | 50101.605 | 3.14873 |
| T Vul | 5.41 | 6.09 | 50101.410 | 4.4353 |
| SV Vul | 6.72 | 7.79 | 50104.50 | 45.0068 |
| AW Per | 7.04 | 7.89 | 50103.361 | 6.463589 |
| CO Aur | 7.46 | 8.08 | – | – |
| TU Cas | 6.88 | 8.18 | – | – |
| CK Cam | 7.23 | 7.81 | 50015.460 | 3.2942 |
| T Mon | 5.58 | 6.62 | 43784.615 | 27.024649 |
The list of observed stars is presented in Table 1. It contains mostly the same stars as in Paper I. SV Vul, AW Per and T Mon was observed only in 1997, therefore, they were not present in the spectroscopic programme of Paper I. We continued the spectroscopic monitoring of two double-mode Cepheids, CO Aur and TU Cas.
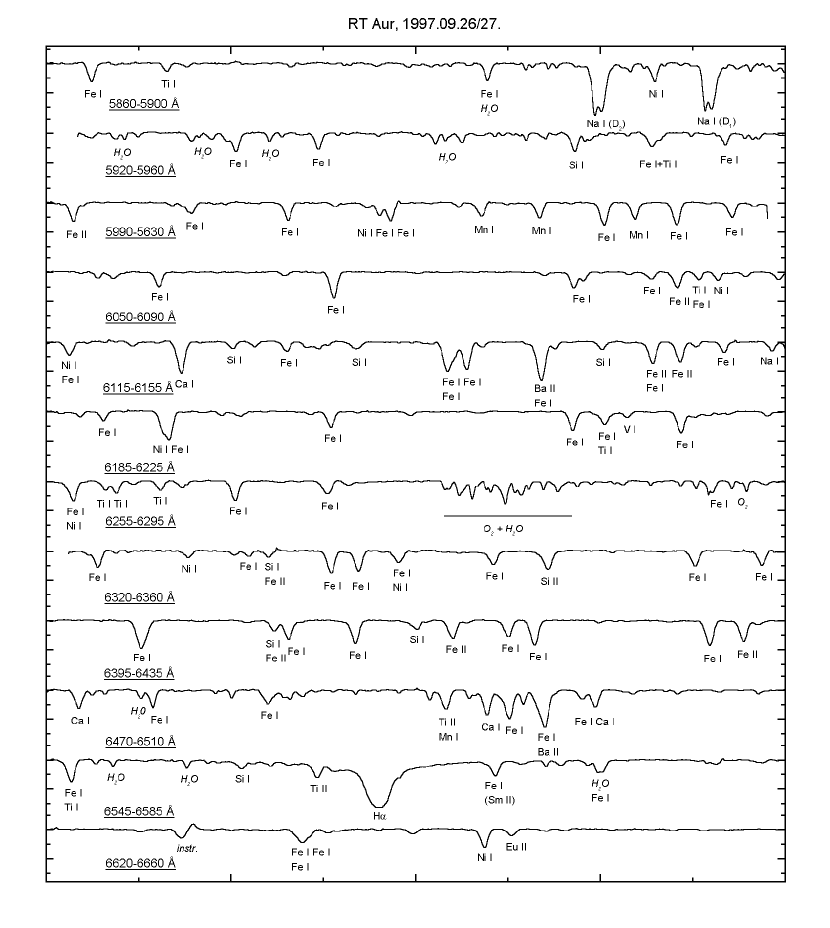
The spectra were reduced with standard IRAF tasks including bias removal, flat-fielding, cosmic ray elimination, echelle orders extraction (with the task doecslit) and wavelength calibration. For this calibration, we obtained two ThAr spectral lamp exposures, immediately before and after every stellar exposure. We applied careful linear interpolation between the spectral lamp exposures, as slow wavelength shifts in the obtained spectra were observed caused by the movement of telescope. Each order was normalized to the continuum by fitting cubic splines. The regions of strong lines (sodium D, H) were omitted from the continuum fitting. A typical spectrum with 12 orders for RT Aur is shown in Fig. 1, while the list of the marked spectral lines is presented in Table 2. Note, that spectral lines in long-period Cepheids (i.e. stars with lower effective temperatures) are more numerous and stronger, thus Table 2 gives only a rough overview of the obvious spectral features.
| ion | EP | ion | EP | ||
|---|---|---|---|---|---|
| (eV) | (eV) | ||||
| 5862.368 | Fe I | 4.55 | 6216.358 | V I | 0.28 |
| 5866.461 | Ti I | 1.07 | 6219.287 | Fe I | 2.20 |
| 5883.814 | Fe I | 3.96 | 6256.367 | Fe I | 2.45 |
| 5883.905 | H20 | Ni I | 1.68 | ||
| 5889.973 | Na I (D2) | 0.00 | 6258.110 | Ti I | 1.44 |
| 5892.883 | Ni I | 1.99 | 6258.713 | Ti I | 1.46 |
| 5895.940 | Na I (D1) | 0.00 | 6261.106 | Ti I | 1.43 |
| 5930.191 | Fe I | 4.65 | 6265.141 | Fe I | 2.18 |
| 5934.665 | Fe I | 3.93 | 6270.231 | Fe I | 2.86 |
| 5948.548 | Si I | 5.08 | 6290.974 | Fe I | 4.73 |
| 5952.726 | Fe I | 3.98 | 6322.694 | Fe I | 2.59 |
| 5953.170 | Ti I | 1.89 | 6327.604 | Ni I | 1.68 |
| 5956.706 | Fe I | 0.86 | 6330.852 | Fe I | 4.73 |
| 5991.378 | Fe II | 3.15 | 6331.953 | Si I | 5.08 |
| 5997.782 | Fe I | 4.61 | Fe II | 6.22 | |
| 6003.022 | Fe I | 3.88 | 6335.337 | Fe I | 2.20 |
| 6007.317 | Ni I | 1.68 | 6336.830 | Fe I | 3.69 |
| 6007.968 | Fe I | 4.65 | 6338.880 | Fe I | 4.79 |
| 6008.566 | Fe I | 3.88 | 6339.118 | Ni I | 4.15 |
| 6013.497 | Mn I | 3.07 | 6344.155 | Fe I | 2.43 |
| 6016.647 | Mn I | 3.07 | 6347.095 | Si II | 8.12 |
| 6020.186 | Fe I | 4.61 | 6355.035 | Fe I | 2.84 |
| 6021.803 | Mn I | 3.07 | 6358.687 | Fe I | 0.86 |
| 6024.068 | Fe I | 4.55 | 6400.009 | Fe I | 3.60 |
| 6027.059 | Fe I | 4.07 | 6407.291 | Si I | 5.87 |
| 6056.013 | Fe I | 4.73 | Fe II | 3.89 | |
| 6065.494 | Fe I | 2.61 | 6408.026 | Fe I | 3.69 |
| 6078.499 | Fe I | 4.79 | 6411.658 | Fe I | 3.65 |
| 6082.718 | Fe I | 2.22 | 6414.987 | Si I | 5.87 |
| 6084.105 | Fe II | 3.20 | 6416.928 | Fe II | 3.89 |
| 6085.257 | Ti I | 1.05 | 6419.956 | Fe I | 4.73 |
| Fe I | 2.76 | 6421.360 | Fe I | 2.28 | |
| 6086.288 | Ni I | 4.26 | 6430.856 | Fe I | 2.18 |
| 6116.198 | Ni I | 4.09 | 6432.683 | Fe II | 2.89 |
| 6116.246 | Fe I | 4.26 | 6471.668 | Ca I | 2.52 |
| 6122.226 | Ca I | 1.89 | 6475.632 | Fe I | 2.56 |
| 6125.026 | Si I | 5.61 | 6481.878 | Fe I | 2.28 |
| 6127.912 | Fe I | 4.14 | 6491.582 | Ti II | 2.06 |
| 4.28 | 6491.666 | Mn I | 3.76 | ||
| 6131.577 | Si I | 5.61 | 6493.788 | Ca I | 2.52 |
| 6131.858 | Si I | 5.61 | 6494.994 | Fe I | 2.40 |
| 6136.624 | Fe I | 2.45 | 6496.472 | Fe I | 4.79 |
| 6137.002 | Fe I | 2.20 | 6496.908 | Ba II | 0.60 |
| 6137.702 | Fe I | 2.59 | 6498.945 | Fe I | 0.96 |
| 6141.727 | Ba II | 0.70 | 6499.654 | Ca I | 2.52 |
| Fe I | 3.60 | 6546.252 | Fe I | 2.76 | |
| 6145.020 | Si I | 5.61 | Ti I | 1.43 | |
| 6147.742 | Fe II | 3.89 | 6555.466 | Si I | 5.98 |
| 6147.834 | Fe I | 4.07 | 6559.576 | Ti II | 2.05 |
| 6149.249 | Fe II | 3.89 | 6562.808 | H | 10.20 |
| 6151.623 | Fe I | 2.18 | 6569.224 | Fe I | 4.73 |
| 6154.230 | Na I | 2.10 | (Sm II) | 1.49 | |
| 6187.995 | Fe I | 3.94 | 6575.037 | Fe I | 2.59 |
| 6191.186 | Ni I | 1.68 | 6633.427 | Fe I | 4.83 |
| 6191.571 | Fe I | 2.43 | 6633.758 | Fe I | 4.56 |
| 6200.321 | Fe I | 2.61 | 6634.123 | Fe I | 4.79 |
| 6213.437 | Fe I | 2.22 | 6643.638 | Ni I | 1.68 |
| 6215.149 | Fe I | 4.19 | 6645.127 | Eu II | 1.38 |
| 6215.22 | Ti I | 2.69 |
3 Radial velocities
Radial velocities presented in Table 3 were determined with two different methods. In order to compare the data with those of in Paper I, we obtained a set of radial velocities by cross-correlating two spectral regions of the Cepheid and IAU standard star spectra with the IRAF task fxcor. We chose HD 187691 (spectral type F8V, v km s-1) as an overall template star. The cross-correlated regions were those of 6188–6220 and 6405–6435 Å, where 19 photospheric lines were identified (see Table 2).
| Hel. J.D. | Hel. J.D. | Hel. J.D. | |||||||||
|---|---|---|---|---|---|---|---|---|---|---|---|
| FF Aql | 50344.659 | 0.059 | 33.89 | 34.73 | 50718.706 | 0.878 | 4.65 | 5.70 | |||
| 50337.544 | 0.597 | 8.31 | 8.61 | 50345.704 | 0.253 | 25.02 | 25.05 | 50731.737 | 0.788 | 2.04 | 3.46 |
| 50345.540 | 0.385 | 16.54 | 16.63 | 50346.701 | 0.439 | 15.19 | 15.02 | 50732.653 | 0.063 | 7.60 | 9.13 |
| 50346.532 | 0.607 | 8.67 | 8.82 | 50347.581 | 0.603 | 6.22 | 6.17 | 50733.681 | 0.372 | 1.68 | 3.47 |
| 50347.525 | 0.829 | 14.40 | 14.84 | 50350.604 | 0.166 | 29.53 | 29.74 | 50734.652 | 0.663 | 1.59 | 0.12 |
| 50350.527 | 0.501 | 11.49 | 11.83 | 50352.544 | 0.528 | 10.26 | 10.25 | 50735.634 | 0.958 | 7.40 | 9.36 |
| 50352.521 | 0.947 | 22.57 | 22.73 | 50355.739 | 0.123 | 31.73 | 32.23 | 50736.734 | 0.288 | 3.14 | 4.42 |
| 50718.604 | 0.827 | 16.82 | 17.70 | 50356.779 | 0.317 | 21.77 | 21.97 | 50737.670 | 0.569 | 2.24 | 0.48 |
| 50731.634 | 0.742 | 11.53 | 12.60 | 50718.721 | 0.764 | 2.01 | 1.28 | 50738.683 | 0.873 | 5.45 | 5.88 |
| 50733.521 | 0.164 | 26.15 | 26.93 | 50731.754 | 0.192 | 28.79 | 29.01 | Gem | |||
| 50734.512 | 0.386 | 18.27 | 19.09 | 50732.667 | 0.362 | 19.62 | 19.93 | 50337.854 | 0.530 | 21.49 | 21.35 |
| 50735.551 | 0.618 | 10.83 | 11.27 | 50733.697 | 0.554 | 9.27 | 9.75 | 50345.875 | 0.320 | 7.74 | 7.82 |
| Aql | 50734.689 | 0.739 | 0.58 | 0.24 | 50346.855 | 0.417 | 15.37 | 15.46 | |||
| 50337.564 | 0.982 | 31.11 | 31.32 | 50735.504 | 0.891 | 11.78 | 12.26 | 50347.828 | 0.513 | 21.31 | 21.34 |
| 50345.508 | 0.089 | 30.28 | 30.12 | 50735.707 | 0.929 | 25.07 | 25.30 | 50352.856 | 0.010 | 1.59 | 1.63 |
| 50346.508 | 0.229 | 24.03 | 23.83 | 50737.683 | 0.297 | 23.37 | 23.93 | 50356.878 | 0.405 | 14.65 | 14.73 |
| 50347.507 | 0.368 | 16.14 | 16.16 | 50738.660 | 0.478 | 13.76 | 13.73 | 50718.878 | 0.070 | 5.77 | 6.17 |
| 50350.503 | 0.785 | 10.16 | 9.32 | 50731.924 | 0.356 | 10.93 | 10.56 | ||||
| 50352.499 | 0.063 | 31.08 | 31.14 | X Cyg | 50732.913 | 0.453 | 18.31 | 17.81 | |||
| 50355.677 | 0.506 | 13.78 | 13.80 | 50337.711 | 0.145 | 15.44 | 15.28 | 50733.869 | 0.547 | 21.95 | 21.19 |
| 50356.620 | 0.637 | 1.17 | 1.31 | 50344.703 | 0.572 | 22.48 | 22.42 | 50737.864 | 0.941 | 0.20 | 0.45 |
| 50731.620 | 0.890 | 15.19 | 16.27 | 50345.656 | 0.630 | 28.30 | 27.68 | S Sge | |||
| 50732.486 | 0.010 | 31.67 | 32.58 | 50346.661 | 0.692 | 33.35 | 32.16 | 50337.580 | 0.706 | 23.15 | 22.65 |
| 50733.491 | 0.150 | 27.75 | 28.19 | 50347.595 | 0.749 | 35.87 | 34.71 | 50345.562 | 0.658 | 18.86 | 18.76 |
| 50734.484 | 0.289 | 20.95 | 21.43 | 50350.616 | 0.933 | 12.75 | 12.47 | 50346.617 | 0.784 | 23.85 | 23.42 |
| 50735.537 | 0.435 | 15.05 | 15.48 | 50352.601 | 0.054 | 20.51 | 20.13 | 50347.536 | 0.894 | 0.83 | 0.54 |
| 50737.614 | 0.725 | 7.07 | 6.41 | 50355.727 | 0.245 | 5.94 | 5.85 | 50350.558 | 0.254 | 4.19 | 4.46 |
| RT Aur | 50356.650 | 0.301 | 0.80 | 0.66 | 50352.554 | 0.492 | 1.41 | 1.63 | |||
| 50337.829 | 0.481 | 24.99 | 25.20 | 50718.646 | 0.393 | 7.34 | 6.92 | 50355.709 | 0.869 | 6.46 | 6.35 |
| 50345.863 | 0.635 | 33.27 | 33.28 | 50731.679 | 0.188 | 10.70 | 11.24 | 50356.665 | 0.983 | 12.59 | 12.81 |
| 50346.824 | 0.893 | 22.84 | 22.87 | 50732.599 | 0.244 | 5.24 | 5.69 | 50718.624 | 0.165 | 36.28 | 36.72 |
| 50347.795 | 0.154 | 6.78 | 6.69 | 50733.609 | 0.306 | 0.02 | 0.32 | 50731.656 | 0.720 | 3.42 | 4.45 |
| 50350.764 | 0.950 | 8.74 | 8.97 | 50734.553 | 0.364 | 5.26 | 4.78 | 50732.557 | 0.827 | 7.84 | 9.50 |
| 50352.820 | 0.502 | 26.26 | 26.47 | 50735.521 | 0.422 | 9.65 | 9.31 | 50733.560 | 0.947 | 36.10 | 36.93 |
| 50356.835 | 0.579 | 30.10 | 30.30 | 50737.649 | 0.552 | 20.69 | 20.18 | 50734.497 | 0.059 | 37.73 | 38.51 |
| 50718.844 | 0.679 | 34.87 | 34.12 | DT Cyg | 50735.591 | 0.189 | 33.31 | 33.84 | |||
| 50731.938 | 0.191 | 9.05 | 8.53 | 50337.628 | 0.091 | 7.23 | 7.34 | 50737.628 | 0.432 | 29.33 | 29.77 |
| 50732.931 | 0.458 | 23.94 | 23.48 | 50337.752 | 0.140 | 6.37 | 6.27 | SZ Tau | |||
| 50733.805 | 0.692 | 30.33 | 34.58 | 50344.746 | 0.939 | 6.87 | 7.07 | 50337.803 | 0.064 | 7.03 | 7.39 |
| 50734.794 | 0.957 | 8.16 | 6.56 | 50345.615 | 0.287 | 1.82 | 1.85 | 50345.822 | 0.610 | 7.08 | 7.00 |
| 50737.842 | 0.775 | 36.65 | 36.13 | 50345.759 | 0.344 | 0.09 | 0.03 | 50346.809 | 0.924 | 2.43 | 4.21 |
| 50738.738 | 0.015 | 2.30 | 1.77 | 50346.604 | 0.683 | 5.21 | 5.17 | 50347.748 | 0.222 | 5.46 | 5.52 |
| SU Cas | 50346.774 | 0.751 | 2.79 | 2.71 | 50350.745 | 0.174 | 6.65 | 7.49 | |||
| 50337.667 | 0.843 | 3.49 | 3.41 | 50347.638 | 0.096 | 7.17 | 7.17 | 50352.800 | 0.827 | 5.77 | 5.53 |
| 50345.581 | 0.903 | 8.61 | 8.60 | 50347.779 | 0.153 | 6.09 | 5.90 | 50356.813 | 0.101 | 7.73 | 9.03 |
| 50345.739 | 0.984 | 13.43 | 14.03 | 50350.543 | 0.259 | 2.82 | 2.73 | 50718.826 | 0.072 | 7.51 | 8.22 |
| 50346.574 | 0.412 | 4.32 | 4.34 | 50718.687 | 0.570 | 5.49 | 4.87 | 50731.879 | 0.217 | 6.42 | 6.45 |
| 50346.756 | 0.506 | 0.66 | 0.61 | 50731.719 | 0.785 | 2.82 | 1.89 | 50732.766 | 0.499 | 2.20 | 2.23 |
| 50347.652 | 0.966 | 12.44 | 12.61 | 50732.635 | 0.151 | 5.47 | 6.43 | 50733.789 | 0.824 | 7.82 | 7.00 |
| 50347.878 | 0.082 | 15.39 | 15.91 | 50733.661 | 0.562 | 5.51 | 4.90 | 50734.722 | 0.120 | 9.05 | 9.08 |
| 50350.685 | 0.521 | 0.17 | 0.28 | 50734.672 | 0.966 | 6.35 | 7.02 | 50737.746 | 0.081 | 8.42 | 9.05 |
| 50352.844 | 0.629 | 1.75 | 1.75 | 50735.672 | 0.367 | 0.13 | 0.44 | 50738.719 | 0.390 | 1.67 | 2.50 |
| 50356.900 | 0.709 | 2.31 | 2.20 | V1334 Cyg | T Vul | ||||||
| 50718.743 | 0.334 | 7.26 | 7.64 | 50337.694 | 0.555 | 12.24 | 12.11 | 50337.651 | 0.262 | 6.78 | 6.80 |
| 50731.785 | 0.024 | 15.57 | 16.83 | 50344.800 | 0.688 | 13.53 | 14.00 | 50344.720 | 0.856 | 6.45 | 5.99 |
| 50732.684 | 0.486 | 2.02 | 2.48 | 50345.691 | 0.955 | 3.11 | 2.84 | 50345.676 | 0.071 | 16.77 | 16.83 |
| 50733.717 | 0.016 | 15.45 | 16.49 | 50346.690 | 0.255 | 5.56 | 5.05 | 50346.677 | 0.297 | 4.69 | 4.72 |
| 50734.582 | 0.459 | 2.90 | 3.49 | 50347.625 | 0.535 | 12.17 | 11.87 | 50347.611 | 0.507 | 6.77 | 6.66 |
| 50737.718 | 0.068 | 15.02 | 16.36 | 50350.646 | 0.442 | 10.32 | 9.82 | 50350.632 | 0.189 | 10.77 | 10.90 |
| Cep | 50352.693 | 0.056 | 3.59 | 2.64 | 50352.676 | 0.649 | 13.06 | 13.09 | |||
| 50337.735 | 0.768 | 2.61 | 2.3 | 50356.765 | 0.278 | 5.71 | 4.91 | 50356.682 | 0.552 | 8.69 | 8.75 |
| Hel. J.D. | Hel. J.D. | Hel. J.D. | |||||||||
|---|---|---|---|---|---|---|---|---|---|---|---|
| T Vul cont. | 50346.841 | – | 20.30 | 50345.785 | 0.251 | 8.24 | 8.22 | ||||
| 50718.666 | 0.164 | 12.07 | 12.68 | 50347.812 | – | 5.85 | 50346.714 | 0.533 | 7.86 | 7.52 | |
| 50731.701 | 0.103 | 15.97 | 16.65 | 50352.875 | – | 14.94 | 50347.722 | 0.839 | 8.14 | 7.46 | |
| 50732.618 | 0.309 | 4.09 | 4.73 | 50356.861 | – | 8.05 | 50350.702 | 0.744 | 13.73 | 13.24 | |
| 50733.639 | 0.540 | 8.55 | 7.93 | 50732.870 | – | 0.66 | 50352.743 | 0.363 | 2.15 | 2.34 | |
| 50734.631 | 0.763 | 15.68 | 14.76 | TU Cas | 50355.747 | 0.275 | 6.74 | 7.29 | |||
| 50735.654 | 0.994 | 18.08 | 1865 | 50345.720 | – | 33.37 | 50356.704 | 0.565 | 8.68 | 8.28 | |
| 50738.699 | 0.680 | 13.07 | 13.14 | 50346.554 | – | 16.05 | 50718.799 | 0.466 | 3.94 | 3.28 | |
| SV Vul | 50346.741 | – | 15.07 | 50731.806 | 0.414 | 0.39 | 0.65 | ||||
| 50732.577 | 0.954 | 6.95 | 9.62 | 50347.676 | – | 27.53 | 50732.815 | 0.720 | 14.51 | 13.23 | |
| 50734.605 | 0.999 | 21.41 | 22.35 | 50347.863 | – | 37.12 | 50733.853 | 0.035 | 17.58 | 18.18 | |
| 50735.612 | 0.021 | 23.70 | 24.07 | 50350.667 | – | 11.83 | 50737.778 | 0.226 | 9.31 | 10.10 | |
| AW Per | 50352.769 | – | 25.24 | T Mon | |||||||
| 50718.771 | 0.212 | 14.01 | 14.66 | 50356.744 | – | 22.04 | 50718.862 | 0.590 | 34.98 | 33.90 | |
| 50731.832 | 0.232 | 13.97 | 13.96 | 50356.928 | – | 18.74 | 50731.910 | 0.073 | 2.14 | 2.48 | |
| 50732.789 | 0.381 | 5.28 | 5.73 | 50718.903 | – | 17.27 | 50732.895 | 0.109 | 0.65 | 0.85 | |
| 50733.767 | 0.532 | 1.72 | 50732.710 | – | 37.94 | 50733.827 | 0.143 | 1.58 | 1.15 | ||
| 50737.804 | 0.157 | 16.79 | 16.44 | 50733.742 | – | 17.52 | 50734.770 | 0.178 | 4.01 | 3.42 | |
| CO Aur | CK Cam | 50737.888 | 0.294 | 12.64 | 12.08 | ||||||
| 50345.842 | – | 5.84 | 50337.776 | 0.820 | 9.80 | 9.54 |
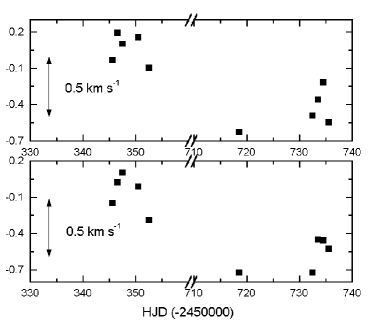
The stability of radial velocity measurements was tested by the standard star itself. We plotted the cross-correlation velocities in Fig. 2, where a systematic shift of 0.50 km s-1 is present between data obtained in 1996 and 1997. The necessary shift for matching the data is the same for the different wavelength regions. Furthermore, other non-variable stars ( Per, HD 22484) showed similar shift. This turned out to be an instrumental effect, probably the entrance slit of the spectrograph was not uniformly illuminated by the spectral lamp. Therefore, a systematic asymmetry occured in the emission line profiles of the ThAr lamp introducing a systematic subpixel-shift in the wavelength calibration. We determined the mean correction of 0.5 km s-1 and applied it to the calculated radial velocities. In order to guarantee the homogeneity of the data reduction procedure, we have also re-reduced our spectra obtained in 1996. The newly calculated radial velocities do not differ from values in Kiss (1998) more than 0.1–0.14 km s-1, the mean deviation is about 0.05 km s-1. This is less by a factor of 3 than the internal accuracy of measurements estimated to be about 0.15 km s-1. All data are tabulated in Table 3.
Three stars (FF Aql, V1334 Cyg and S Sge) show remarkable changes of the -velocity due to orbital motion in binary sytems. The best example with good phase coverage is V1334 Cyg, where Vγ changed about 11 km s-1 in one year. This is almost a half of the full orbital velocity amplitude, which is 27.8 km s-1, according to Evans (1995). The sytematic velocity changes in FF Aql and S Sge are 2.3 km s-1 and 27.7 km s-1, respectively. These stars have well-determined orbits (see Evans 1995), thus we did not try to re-calculate their orbital elements.
3.1 Comparison of velocity curves
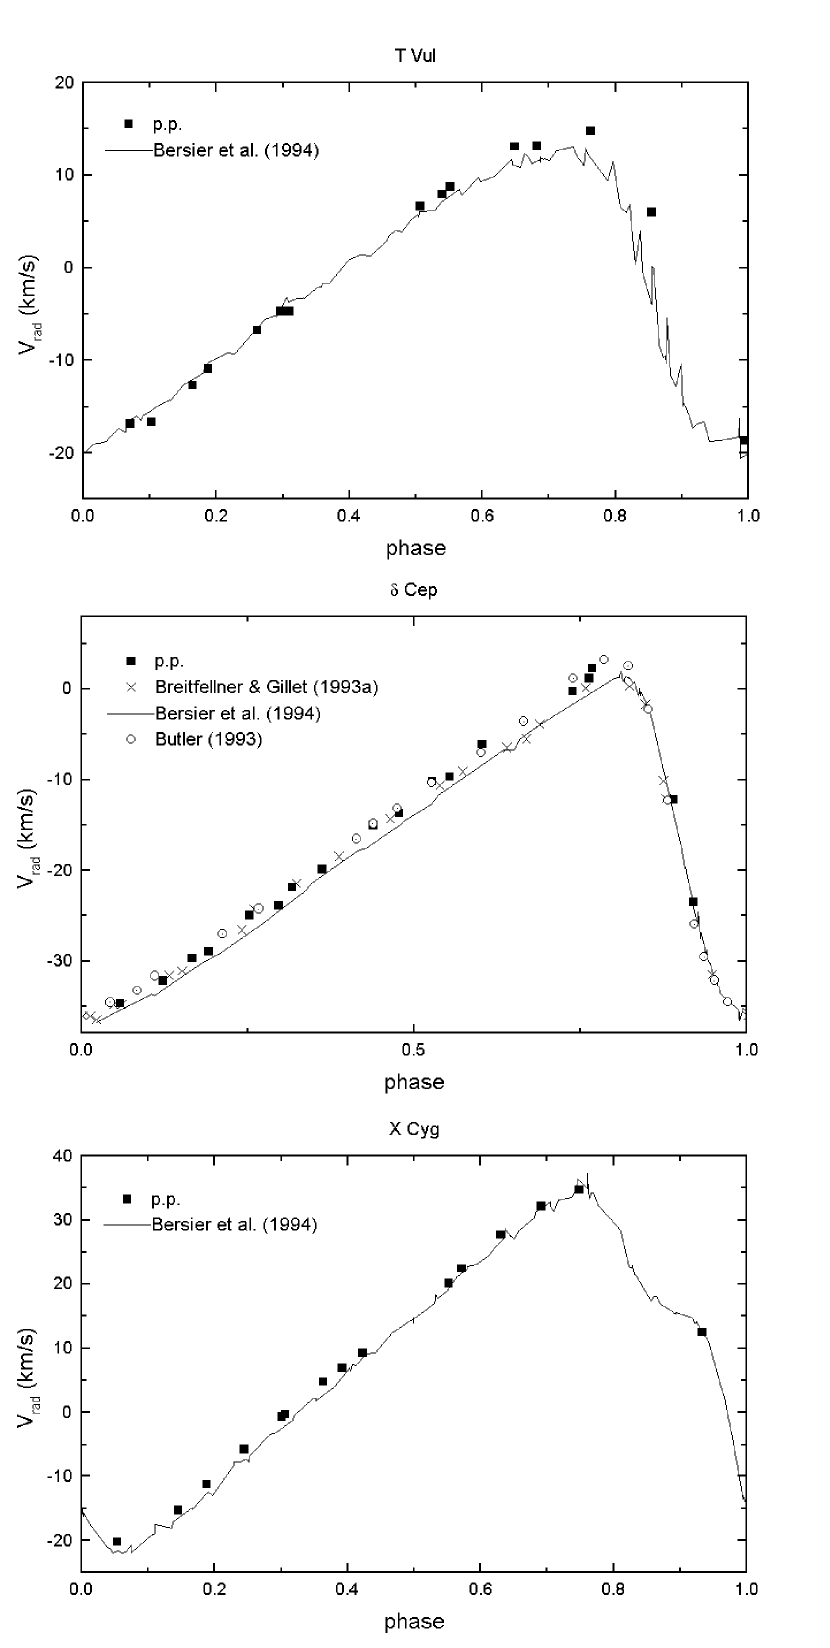
It is interesting to compare our new cross-correlation velocity curves with those obtained by others with other instruments for the same stars, especially with the CORAVEL-type velocities (Bersier et al. 1994), because those have been extensively used in many studies of Cepheid variables. This comparison can be seen in Fig. 3 for T Vul, Cep and X Cyg where the continuous lines mean CORAVEL-velocities and symbols denote others’ data including ours. These three stars have well-covered velocity curves and they are used in order to represent shorter and longer period Cepheids. In the case of Cep data of Breitfellner & Gillet (1993a) and Butler (1993) were also plotted. The velocities of Breitfellner & Gillet are based on a few selected Fe I lines, while Butler’s data have been obtained with the very precise iodine-cell technique. Note, that Butler (1993) reported that his data have no absolute zero-point, and a 2–3 km s-1 shift is necessary to match his Cep-velocities with those of others. We also added a 3 km s-1 correction to these velocities and found perfect agreement with our ccf-velocity curve as well as the velocities of Breitfellner & Gillet (1993a). Contrary to these, there is a significant difference between all these velocities and the CORAVEL data on the ascending branch of the velocity curve of Cep.
An earlier version of this graph appeared in Paper I showing larger differences between the datasets. Those larger shifts were partly due to a slightly longer period used in Paper I for Cep. In this paper we used an updated, shorter period (see Table 1) that eliminated the larger dispersion of the phased velocities on the ascending branch. However, a shift between the CORAVEL and other types of velocities is still present. The same can be observed in the case of X Cyg and T Vul, although for T Vul the largest differences occur during the velocity reversal. As in the previous case, phase shifts due to slightly incorrect epochs or periods have been eliminated by carefully taking into account the period variations of these stars, therefore all the differences can be considered real. Moreover, Vinkó et al. (1998) found similar deviations between digital ccf- and CORAVEL-velocities of Type II Cepheids.
All of these comparisons are consistent with each other and suggest that for Cepheid variables the CORAVEL-type velocities systematically differ from those obtained by direct spectral line measurements. Possible reasons for the cause of this discrepancy are the well-known effects that perturb the line profiles of pulsating variables, namely the velocity differences and/or the line asymmetries. These effects are phase-dependent, so they may be capable of explaining why the deviations of the CORAVEL-velocities get stronger at certain phases. On the other hand, it is a bit surprising that our digital cross correlation (ccf-) velocities (and also those of Vinkó et al., 1998) agree much better with line bisector- or iodine cell-velocities than with CORAVEL-type ones. The digital cross-correlation velocities should be (and probably they actually are) also sensitive to the line profile disturbances mentioned above. It is possible that another systematic effects are also present in the CORAVEL-type measurements (perhaps associated with the alignment of the mask or the usage of much more spectral features in a much wider wavelength interval) that contribute to this disagreement. The velocity data obtained with CORAVEL have very good phase coverage and also very good inner precision, therefore they contain very relevant information on pulsating stars. Therefore we conclude that the CORAVEL data should be compared with other velocity curves obtained with other techniques before using them for deriving astrophysical information that may be sensitive to a few km s-1 systematic differences.
3.2 Line level effects and velocity differences
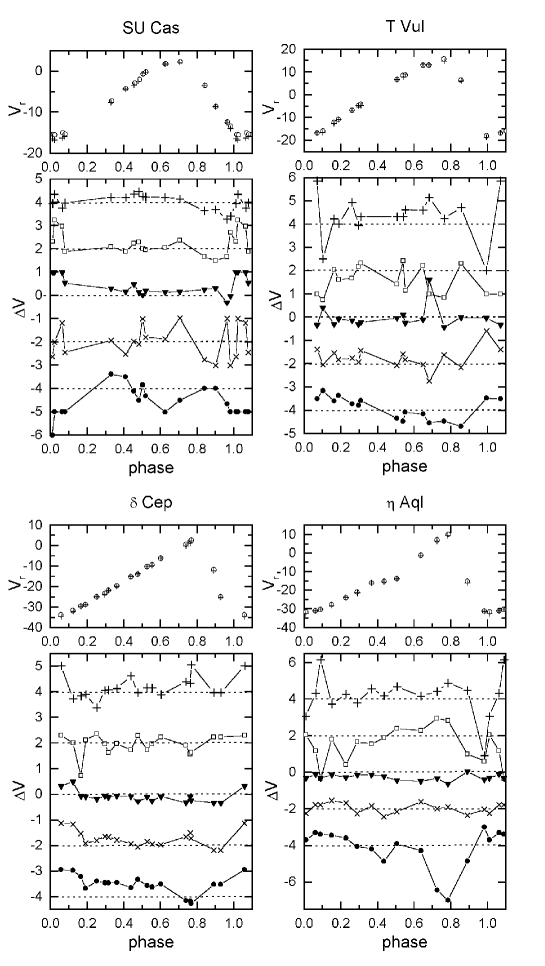
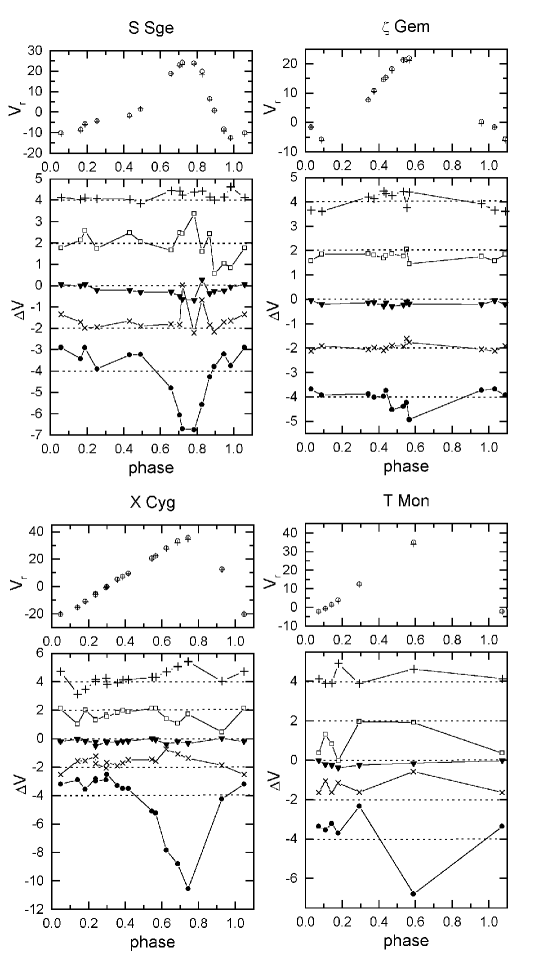
Single-line radial velocities were also calculated for a set of well-defined, unblended lines observed in both seasons. We used the line bisector technique (see Wallerstein et al. 1992 for the definition) to derive radial velocities measuring Doppler-shifts of unblended Fe I, Ni I, Ti I and Si II lines in the 6100–6450 Å region. We chose the 0.7 bisector, because our tests showed that it gives the most accurate velocities. The precision of the individual line velocities were determined using artificial digital spectra with random noise co-added. The precision turned out to be and for spectra of S/N=50 and S/N=200, respectively (Vinkó et al. 1999). Mean radial velocities were calculated and plotted in Figs. 4–5 with the corresponding ccf data () for eight stars covering a wide period range (1.9–27 days). Radial velocity differences between lines of different excitation potentials (EP) and the mean metallic velocities (in sense of Vline minus Vmean) are also plotted in the subpanels of Figs. 4–5. The referee suggested to also include H velocities, however, the H profile is strongly affected by various atmospheric phenomena and, consequently, it is quite misleading to associate one velocity to the distorted line profile (see, e.g. Wallerstein et al. 1992, Vinkó et al. 1998). A detailed analysis of H-observations, especially concerning the H emission in long-period Cepheids, will be presented in a forthcoming paper (Vinkó & Kiss, in preparation). Here we want to focus on the velocity behaviour of metallic lines.
A few important conclusions can be drawn based on Figs. 4–5. First, the average 0.7 bisector velocities are in good agreement with the ccf data at level of 0.5–1 km s-1. This is an expected result, since the cross-correlation technique results in a mean Doppler-shift for lines in the selected wavelength region. Second, there are clear examples of line level effect, especially for low-EP ( eV) and high-EP ( eV) lines. Our results are very similar to those of presented by Butler (1993) for 4 stars. The Si II 6347.1 Å line is a very good indicator of the strength of level effects. Its deviations, however, cannot be explained by kinematic velocity gradients (Butler et al. 1996), because the -velocity of the Si II-velocities is quite different from the -velocity of the average velocity curve.
It is visible in the lower panels of Figs. 4–5 that the - velocities of some other lines also differs from the - velocity of the average radial velocity curve. This was also reported by Butler (1993), and it gives further support to the conclusion of Sabbey et al. (1995) that path conservation may not be valid for the integral of the observed velocity curves of Cepheids over the whole pulsational cycle.
The level effects get stronger with increasing period starting from 1–2 km s-1 for days up to 6–8 km s-1 for days. Note that the 2 km s-1 scattering in the velocity differences of SU Cas and T Vul at later phases is due to observational uncertainties rather than real physical effects. In the spectra of these stars the lowest and highest EP lines become very weak at these phases which degrades the precision of the velocity measurement. In the case of the other stars the observed velocity differences can be considered significant, especially for the longer period ones. Unfortunately, the data of T Mon have very bad phase coverage, but the observed tendencies suggest similar behaviour to X Cyg, namely the low-EP lines have positive velocity residuals while the high-EP lines have large negative velocity residuals in the 0.6–1.0 phase interval.
We tried to give an order of magnitude estimate of the dependence of the velocity gradients on the stellar parameters from the observed velocity differences. This requires the knowledge of the geometric distance between the line forming regions of low- and high-EP lines, which is difficult to determine in a dynamic atmosphere. As a very crude first approximation, we assumed that the lowest and highest E.P. lines form at the top and at the bottom of the photosphere, and that the width of the photosphere is inversely proportional to the gravity, thus where is roughly constant (Gray, 1992). The absolute value of the velocity gradient is then where is the conversion factor of radial to pulsational velocities. We chose (FeI 0.86 eV) (SiII 8.12 eV) and a constant -factor of 1.36. Therefore we obtain . It is visible that the velocity gradient has weaker dependence on the pulsational period or the radius of the Cepheid, because while increases with increasing period (or radius via the period-radius relation), the gravity decreases at the same time. Thus, the velocity gradients are expected to be roughly the same for short- and long-period Cepheids, provided the simple scaling with gravity is indeed valid. Using the gravity values presented in Paper II (Kiss & Szatmáry 1998) it can be seen that the velocity gradients calculated in this way have the same order of magnitude in the case of Cep and X Cyg. The absolute value can be estimated assuming further that the thickness of the Cepheid photospheres can be approximated with the scaling of the width of the solar photosphere (about 500 km) to , resulting in a value of s-1. However, in the case of strong shock waves forming in the photosphere, the velocity gradient can be much larger than this, at least temporarily.
3.3 Baade-Wesselink radius of CK Cam
The Baade-Wesselink analysis is a widely used tool for radius determination of pulsating variables. Here we do not want to discuss the recent theoretical and observational efforts which have been done to clarify the problems of this method, since it is beyond the scope of present paper. We recall e.g. Gautschy (1987) for a general review. On the other hand, recent surface-brightness techniques (e.g. Gieren et al. 1997) are based on different infrared colours, which enables a reliable separation of temperature and radius variation.
This subsection is addressed to CK Cam, which was discovered by the Hipparcos satellite (Makarov et al. 1994). Because of the relatively new discovery of this star, there are only few available photometric observations. Thus, the sophisticated Baade-Wesselink implemantations or surface-brightness methods cannot be used. That is why we performed a simpler analysis following the original assumptions of Wesselink (1946). This approach was used recently by Balog et al. (1997) for Type II Cepheids, and it is based on BV photometry and a full radial velocity curve.
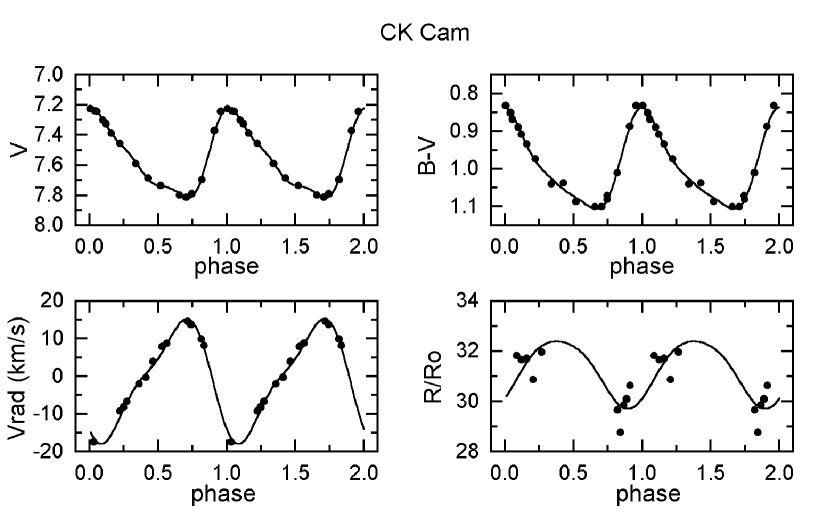
We have taken the published BV photometry of Berdnikov et al. (1996). In order to reduce the numerical uncertainties, we have fitted low-order (3–5) Fourier-polynomials to the light, colour and radial velocity curves. They are plotted in Fig. 6, where the displacement curve is also shown. The inferred radius is 311 R⊙. This is in very good agreement with the prediction of recent period-radius relation of Gieren et al. (1999) giving for P=3.29 days a radius of 31.5 R⊙. This relatively large radius implies that CK Cam is a regular Type I Cepheid (i.e. young supergiant star), which is also supported by the low galactic latitude (8.7∘).
The effect of phase-dependent velocity differences was found to be much lower than the estimated systematic errors due to the initial simplifications. By replacing V1 to V2 data the resulting radius changed only 0.2 R⊙ (0.6%).
4 Line profile variations
Different line broadening mechanisms occuring in a pulsating atmosphere can be globally described by the variation of the Full Width at Half Minimum (FWHM). Recently, Gillet et al. (1999) have used this parameter to trace the turbulent velocity variations in Cep. From nonlinear, nonadiabatic pulsational models they conclude that the main factor governing the line broadening processes is the global compression/expansion of the atmosphere. Shock wave effects turned out to be much weaker in their models.
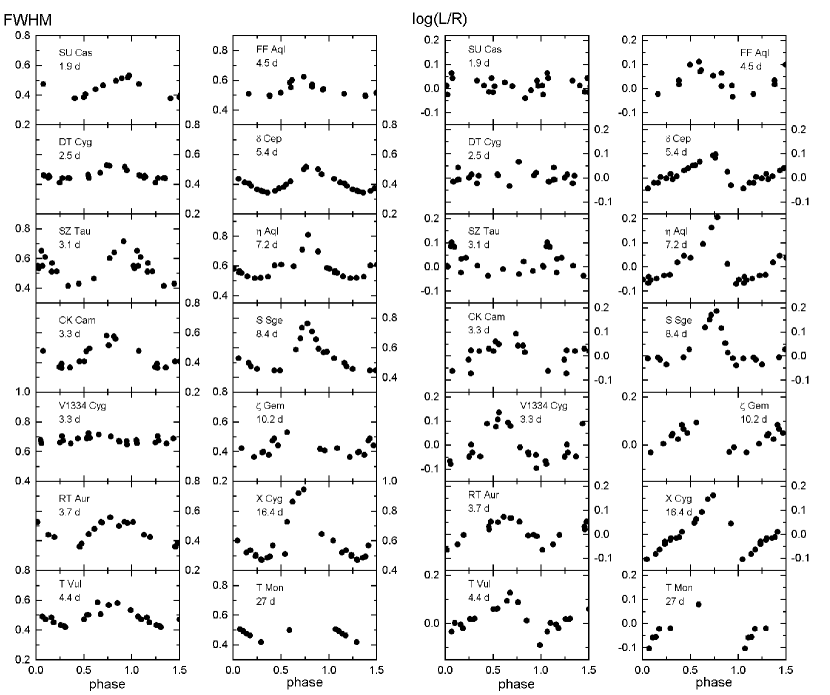
In order to get an overall picture about the period dependence of this phenomenon, we have determined FWHM curves for 14 stars similar to that of Gillet et al. (1999). We chose several unblended lines of different excitation potentials (EP) and found the shape of FWHM curves not depending on the actual EP value. We plotted the resulting curves for 14 stars in Fig. 7 calculated for line 6411.658 Å, which is a neutral iron line of EP=3.65 eV.
The general trends are very similar for the majority of the stars. The smallest FWHM always occurs very close to the phase of maximal radius. On the other hand, the largest FWHM is usually associated with the velocity reversal point (around 0.8–0.85). This is just before the smallest radius, when the global compression is the strongest, dominating the line broadening.
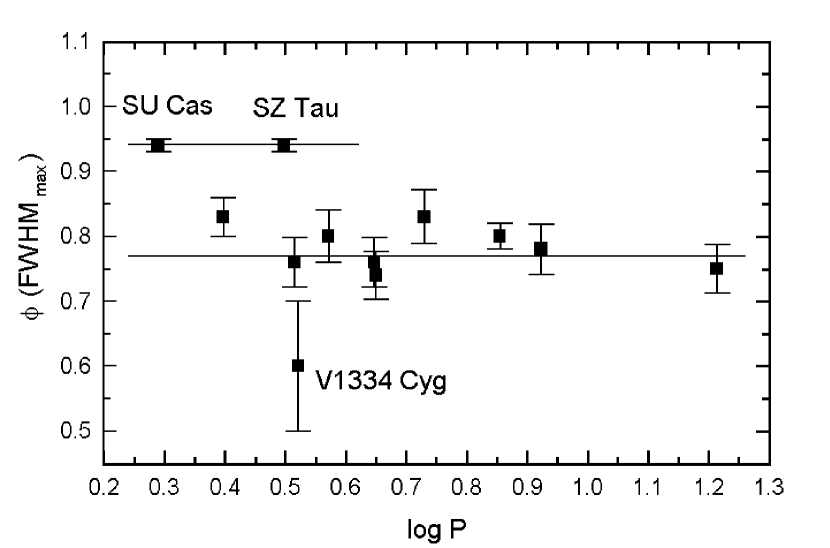
There are three deviating stars in our sample. Two of them (SU Cas and SZ Tau) have the smallest line width in similar phases than in other stars, however, the largest FWHM occurs later, between =0.95–1.00 (see Fig. 8). These variables are thought to be first overtone pulsators (referred as s-Cepheids) which could be a likely explanation for the deviation. Bersier & Burki (1996) suggested a separation between classical and s-Cepheids based on their radial velocity and turbulence variations. This aspect of atmospheric phenomena, i.e. the effects of overtone pulsation, has been rarely studied theoretically. Evans et al. (1998) explained the strong period variation of the first overtone Cepheid Polaris by the complexities of the envelope acoustic cavity. Nevertheless, there is a number of pieces of evidence for a possible connection between the atmospheric turbulence phenomena and the mode of pulsation. In our sample, there are two other s-Cepheids (DT Cyg and FF Aql), which do not follow the suggested distinction, therefore, we cannot draw a firm conclusion on this issue.
The third deviating star is V1334 Cyg, which is a well-known binary Cepheid with a bright companion. This star neither follows the overall pattern of FWHM-variations (i.e. largest FWHM occurs around =0.8–0.9), nor fits the expectations on the absolute value of the full-width. As can be seen in Fig. 7, its line profile is quite stable around 0.67 Å, while there is a slight decrease around 0.75. A possible explanation for these peculiar behaviour could be the effect of a bright companion which contributes significantly to the observed line profiles (see below).
The asymmetry of spectral lines of pulsating stars have been extensively investigated by many authors, recently Sasselov & Lester (1990), Sabbey et al. (1995) and Albrow & Cottrell (1994). The asymmetry parameter (AP) was defined in several forms in these papers. In the followings we adopt the form given by Sasselov & Lester (1990), namely the logarithm of left-to-right half-width ratio of a given spectral line (in this case the Fe I 6411.658 Å). We checked the dependence of AP on choosing the spectral line and found no significant variation in the spectral region covered by our observations. The precision of the AP values was tested using some telluric lines which are expected to be close to AP=0. The uncertainty of AP was found to be 1–2 percent.
The behaviour of AP during the pulsational cycle can be observed in the right side of Fig. 7 for the programme stars. In the case of SU Cas, DT Cyg and SZ Tau only very weak variations can be seen, while there are much larger changes in the case of long-period Cepheids. The natural explanation is the smoother pulsation in first overtone stars, where the amplitudes of pulsation are smaller and the dynamic effects are weaker. V1334 Cyg again deviates from other low-amplitude pulsators showing asymmetry variation that is comparable to long-period Cepheids. On the other hand, the large asymmetries occuring in long-period stars are associated with large FWHM variations, while there is no such phenomenon in V1334 Cyg.
Generally, the AP variation curves resemble the radial velocity curves indicating that the projection effect (the center of the stellar disk shows maximal Doppler-shift, while the limb has no Doppler-shift) contributes at least partly to the observed asymmetries. On the other hand, the model calculations by Sabbey et al. (1995) showed that there are other factors that also cause line asymmetries (mainly the varying depth of line formation over the pulsation cycle) producing larger observed asymmetries. It is visible in Fig. 7, that the amount of asymmetry variation (10–20 percent) is about the same for all fundamental pulsators in our sample. These new observations provide additional confirmation of the theoretical results obtained by Sabbey et al. (1995) and Albrow & Cottrell (1994).
4.1 The companion of V1334 Cygni
The low-amplitude pulsator V1334 Cyg is unique among other low-amplitude Cepheids in many respects, as was shown in the previous sections. Here we try to construct a self-consistent explanation of all these peculiarities by assuming a bright yellow companion star moving in a close orbit around V1334 Cyg A. Both the unusually constant FWHM and large AP variation can be explained with the presence of the spectral lines of the component star with slightly Doppler-shifted to the lines of V1334 Cyg A. The secondary lines make the combined line profiles broader, thus, the variation of FWHM due to pulsation is obscured. Furthermore, the Doppler-shift of the pulsation displace the Cepheid lines from the companion lines producing higher asymmetries. In parallel with these effects, the measured amplitude of the radial velocity variation decreases because the secondary lines move the centers of the combined lines closer to their equilibrium positions. All these effects can be seen in a numerical model using simulated data that is a subject of a follow-up publication (Kiss, in prep.).
We made a few very simple considerations on the possible nature of the hypothetic component star. The visual amplitude of V1334 Cyg is about 0.2 mag being too small compared to other short-period Cepheids. If we consider V1334 Cyg to be a fundamental mode pulsator, its amplitude should be about 0.4–0.6 mag (see, e.g., CK Cam, RT Aur, T Vul). Assuming a virtual amplitude decrease due to the significant amount of secondary light, one can compute the luminosity ratio L(2)/L(Cepheid). In order to get an amplitude of 0.2 mag instead of 0.5, a ratio of L(2)/L(Cepheid)3 is required suggesting an unphysical yellow supergiant, which is too bright and still undetected. However, a more consistent result is given by the assumption of first overtone pulsation. In that case the intrinsic visual amplitude is about 0.4 mag (see, e.g., SU Cas, DT Cyg, SZ Tau, FF Aql), and the observed 0.2 mag implies a ratio L(2)/L(Cepheid)1. This is still a very bright component, but it gives more consistent picture of the system. If it has a similar spectral type than V1334 Cyg A does, than it is almost invisible in the IUE spectra and consequently, its detection is much more difficult in the ultraviolet. The bright blue companion (B7.0V) cannot be responsible for all these effects because it is much fainter than the Cepheid itself in this spectral region and also it is a fast rotator with v sin i around 200 km s-1 (Evans, personal communication).
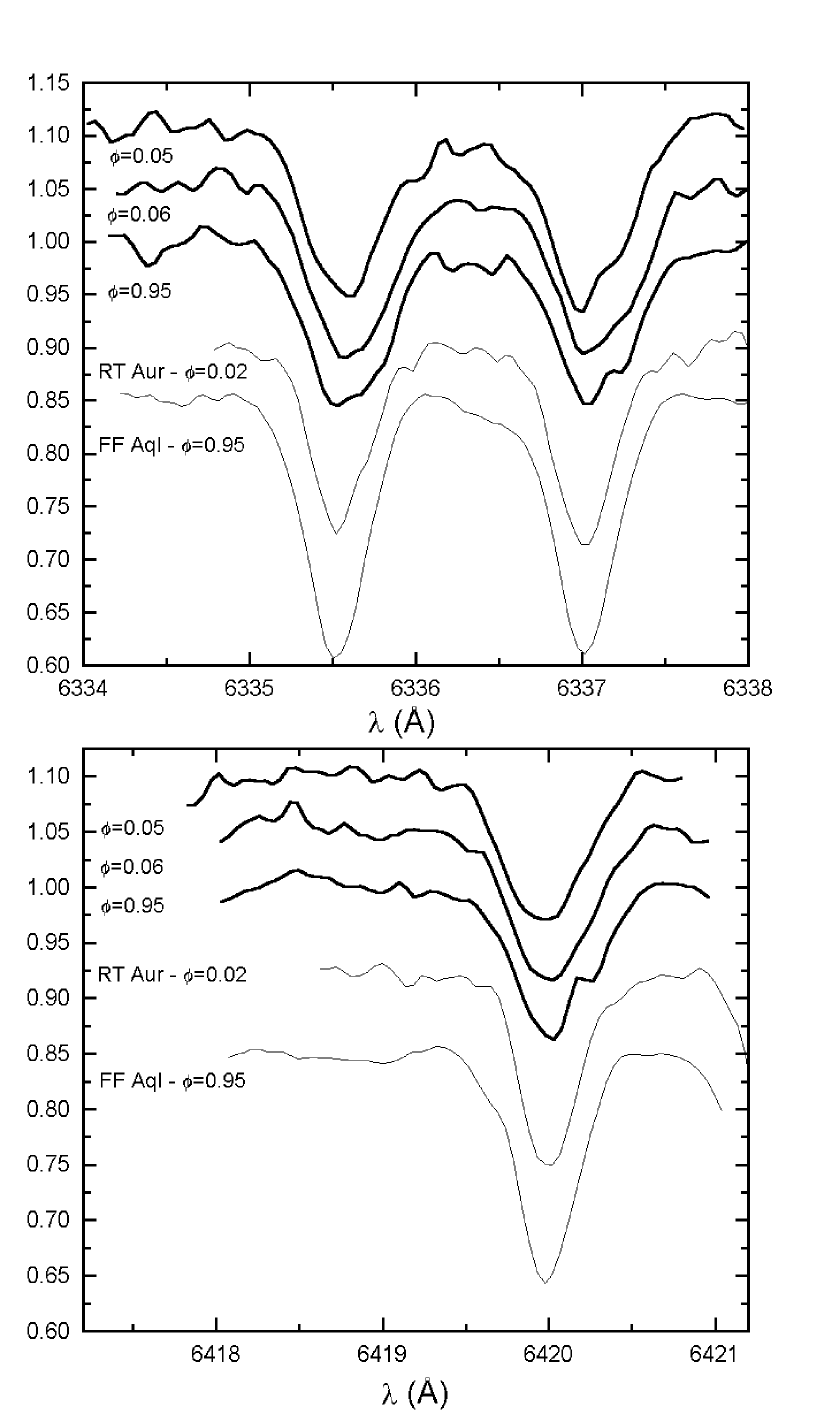
We found some observations directly suggesting the presence of a bright secondary component in the line profiles. Fig. 9. shows line profiles of V1334 Cyg at certain phases corresponding to the highest asymmetries (thick lines). As a comparison, line profiles of other Cepheids with similar period at the same phases are also plotted (thin lines). It can be seen that a) the lines of V1334 Cyg are much broader and b) a multiple structure is resolved in V1334 Cyg that is absent in the other two Cepheids (note, that FF Aql is also a binary but its component is much fainter to be detected in this spectral range). Both the broad lines and the multiple structure strongly support the hypothesis of a bright yellow companion.
We did not observe systematic shift of the FWHM and AP curves between 1996 and 1997, while during this period the -velocity of V1334 Cyg changed by 11 km s-1 due to orbital motion. Consequently, the component that causes the orbital motion cannot be the same that is responsible for the line profile anomalies. We propose that there is a close, yellow component of V1334 Cyg A on an orbit with low inclination producing no observable Doppler-shifts, but affecting the line profiles of the pulsating star. These two stars move together along an orbit around a massive third star with an amplitude of 27.8 km s-1 (Evans 1995). Because the blue component detected by the IUE may not be that massive third star, the system of V1334 Cyg might be a complicated multiple system.
5 Summary
The results presented in this paper can be summarized as follows.
1. We made high-resolution echelle spectroscopy for 18 northern Cepheids in the yellow-red spectral region, between 5900 Å and 6660 Å. New radial velocity data with internal accuracy of about 0.15 km s-1 were calculated using the digital cross-correlation technique. Single-line radial velocities were also determined by the bisector technique and their average values were compared with the ccf-data. There is a good agreement at a level of 0.5–1 km s-1 between these two techniques applied for the same observations.
2. We compared our new measurements with recently published spectroscopic and CORAVEL-type velocities. We found i) perfect agreement with conventional spectroscopic data and ii) systematic differences as large as 1–3 km s-1 between CORAVEL and our data in certain phases. Possible explanations for this discrepancy are the line profile perturbing effects of velocity gradient and line asymmetries, although our digital ccf-data are less affected than those of obtained by the CORAVEL technique.
3. Line level effects were studied for a set of spectral lines with different excitation potential. We found very clear examples of line level effect for low-EP (2 eV) and high-EP (6 eV) lines. The Si II 6347.095 Å line is a very good indicator of the strength of level effects. The observed level effect get stronger with the increasing period, starting from 1–2 km s-1 for P7 days up to 6–8 km s-1 for P7 days. Using these velocity differences we estimated the velocity gradients and their dependence on the stellar parameters. Our approximative approach gave a roughly constant value of .
4. We performed a Baade-Wesselink analysis for CK Cam discovered by the Hipparcos satellite. The inferred radius is 311 R⊙ suggesting a regular Type I Cepheid.
5. The phase dependent behaviour of FWMH and asymmetry variations were examined. The fundamental and overtone pulsators seem to follow different trends. In the case of fundamental pulsation, the smallest FWHM always occurs very close to the phase of maximal radius, while the largest FWHM is associated with the global compression of the atmosphere. In the first overtone Cepheids the largest FWHM is shifted toward the temperature maximum, around . The observed line asymmetries are consistent with theoretical predictions involving the effects of projection and varying depth of line formation over the pulsation cycle.
6. We present observational pieces of evidence for a bright, yellow companion of V1334 Cyg based on the fine spectral peculiarities of this Cepheid. This suspected decreases the measurable light and radial velocity amplitudes by a factor of 2 and may explain the other peculiarities of the line profile variations.
This work has been supported by Hungarian Eötvös Fellowship to J.V., OTKA Grants T022259, F022249 and Foundation for Hungarian Education and Science. The ADS Abstract Service was used to access references.
References
- [] Albrow M.D., Cottrell P.L., 1994, MNRAS, 267, 548
- [] Baldry I.K., Taylor M.M., Bedding T.R., Booth A.J., 1997, MNRAS, 289, 979
- [] Balog Z., Vinkó J., Kaszás G., 1997, AJ, 113, 1833
- [] Benz W., Mayor M., 1982, A&A, 111, 224
- [] Berdnikov L.N., Vozyakova O.V., Ignatova V.V., 1996, IBVS No.4375
- [] Bersier D., Burki G., Burnet M., 1994, A&AS, 108, 9
- [] Bersier D., Burki G., 1996, A&A, 306, 417
- [] Breitfellner M.G., Gillet D., 1993a, A&A, 277, 524
- [] Breitfellner M.G., Gillet D., 1993b, A&A, 277, 541
- [] Breitfellner M.G., Gillet D., 1993c, A&A, 277, 553
- [] Butler R.P., 1993, ApJ, 415, 323
- [] Butler R.P., Bell R.A., 1997, ApJ, 480, 767
- [] Butler R.P., Bell R.A., Hindsley R.B., 1996, ApJ, 461, 362
- [] Evans N.R., 1995, ApJ, 445, 393
- [] Evans N.R., Sasselov D., Short, C.I., 1998, in: The Tenth Workshop on Cool Stars, Stellar Systems and the Sun, Eds. R.A. Donahue, J.A. Bookbinder, ASP Conf. Series Vol. 154, 745
- [] Evans N.R., Carpenter K., Robinson R., Massa D., Wahlgren G.M., Vinkó J., Szabados L., 1999, ApJ, 524, 379
- [] Gautschy A., 1987, Vistas Astron., 30, 197
- [] Gieren W.P., Fouque P., Gomez M., 1997, ApJ, 488, 74
- [] Gieren W.P., Moffett T.J., Barnes III, T.G., 1999, ApJ, 512, 553
- [] Gillet D., Fokin A., Breitfellner M.G., Mazauric S., Nicolas A., 1999, A&A, 344, 935
- [] Gray D.F., 1992, Observations and analysis of stellar photospheres, Cambridge University Press, New York
- [] Karp A.H., 1978, ApJ, 222, 578
- [] Kiss L.L., 1998, MNRAS, 297, 825 (Paper I)
- [] Kiss L.L., Szatmáry K., 1998, MNRAS, 300, 616 (Paper II)
- [] Makarov V., Bastian V., Hoeg E., Grossmann V., Wicenec A., 1994, IBVS No.4118
- [] Moore C.E., Minnaert M., Houtgast J., 1966, The Solar Spectrum 2935 Å to 8770 Å, NBS Monograph 61
- [] Sabbey C.N., Sasselov D.D., Fieldus M.S., Lester J.B., Venn K.A., Butler R.P., 1995, ApJ, 446, 250
- [] Sasselov D.D., Lester J.B., 1990, ApJ, 362, 333
- [] Szabados L., 1991, Comm. Konkoly Obs. Budapest, No.96
- [] Vinkó J., Evans N.R., Kiss L.L., Szabados L., 1998, MNRAS, 296, 824
- [] Vinkó J., Kaszás G., Kiss L.L., 1999, Proc. IAU Coll. 170, “Precise stellar radial velocities”, eds. J.B. Hearnshaw and C.D. Scarfe, ASP Conf. Series, in press
- [] Wallerstein G., Jacobsen T.S., Cottrell P.L., Clark M., Albrow M., 1992, MNRAS, 259, 474
- [] Wesselink A.J., 1946, Bull. Astron. Inst. Neth., 10, 91