High–resolution imaging of compact high–velocity clouds
Abstract
Six examples of the compact, isolated H i high–velocity clouds (CHVCs) identified by Braun and Burton (brau99 (1999)), but only marginally resolved in single–dish data, have been imaged with the Westerbork Synthesis Radio Telescope. The 65 confirmed objects in this class define a dynamically cold system, with a global minimum for the velocity dispersion of only 70 km s-1, found in the Local Group Standard of Rest. The population is in-falling at 100 km s-1 toward the Local Group barycenter. These objects have a characteristic morphology, in which one or more compact cores is embedded in a diffuse halo. The compact cores typically account for 40% of the H i line flux while covering some 15% of the source area. The narrow line width of all core components allows unambiguous identification of these with the cool condensed phase of H i , the CNM, with kinetic temperature near 100 K, while the halos appear to represent a shielding column of warm diffuse H i , the WNM, with temperature near 8000 K. We detect a core with one of the narrowest H i emission lines ever observed, with intrinsic FWHM of no more than 2 km s-1 and 75 K brightness. From a comparison of column and volume densities for this feature we derive a distance in the range 0.5 to 1 Mpc. We determine a metallicity for this same object of 0.04 to 0.07 solar. Comparably high distances are implied by demanding the stability of objects with multiple cores, which show relative velocities as large as 70 km s-1 on 30 arcmin scales. Many of the compact cores show systematic velocity gradients along the major axis of their elliptical extent which are well-fit by circular rotation in a flattened disk system. Two out of three of the derived rotation curves are well-fit by Navarro, Frenk, and White (1997) cold dark matter profiles. These kinematic signatures imply a high dark-to-visible mass ratio of 10–50, for Mpc, which scales as . The implied dark matter halos dominate the mass volume density within the central 2 kpc (10 arcmin) of each source, providing a sufficent hydrostatic pressure to allow CNM condensation. The CHVC properties are similar in many respects to those of the Local Group dwarf irregular galaxies, excepting the presence of a high surface brightness stellar population.
1 Introduction
The possibility of an extragalactic deployment of high–velocity clouds has been considered in various contexts by (among others) Oort (oort66 (1966, 1970, 1981)), Verschuur (vers75 (1975)), Eichler (eich76 (1976)), Einasto et al. (eina76 (1976)), Giovanelli (giov81 (1981)), Bajaja et al. (baja87 (1987)), Burton (burt97 (1997)), Wakker and van Woerden (wakk97 (1997)), Blitz et al. (blit99 (1999)), and Braun and Burton (brau99 (1999)). Blitz et al. (blit99 (1999)) interpret several general HVC properties in terms of the hierarchical structure formation and evolution of galaxies. In this context, the extended HVC complexes would be the nearby objects currently undergoing accretion onto the Galaxy, while the more compact, isolated ones would be their distant counterparts in the Local Group environment.
It is striking that the population of anomalous velocity H i splits naturally into two rather distinct components when observed with the spatial sampling and sensitivity of modern surveys, like the Leiden/Dwingeloo Survey (LDS: Hartmann & Burton hart97 (1997)) in the North and the Parkes Multibeam Survey (see Putman & Gibson putm99 (1999)) in the South. With this new perspective, it has become clear that the large majority of the 561 objects previously cataloged as distinct HVCs by Wakker and van Woerden (wakk91c (1991)) are the local, low–contrast maxima of extended diffuse complexes with angular sizes of tens of degrees. In addition to this diffuse, yet lumpy, component there appear to be several hundred intrinsically compact objects with angular sizes of about 1 degree. Objects of intermediate angular size appear to be rather rare.
Braun and Burton (brau99 (1999)) identified and confirmed 65 examples of compact, isolated high–velocity clouds (the CHVCs) which plausibly represent a homogeneous subsample of the high–velocity clouds, in a single physical state, and arguably before their physical properties have been strongly influenced by the radiation field of the Milky Way or of M31, or by a gravitational encounter with one of these major systems. Braun and Burton showed, in particular, that the velocity dispersion of the CHVC sample is minimized in a reference frame consistent within the observational errors to the Local Group Standard of Rest. This minimization provides a quantitative demonstration of Local–Group deployment. Within this frame, the CHVC ensemble is dynamically quite cold, with a dispersion of only 70 km s-1, although strongly infalling into the Local Group barycenter at a velocity of about 100 km s-1.
Most HVCs have been identified simply by their anomalous–velocity H i emission in total–power surveys at an angular resolution of 05 or coarser. Information on characteristic intrinsic linear scales, on resolved spectral properties which might reveal, for example, opacity information, and on such kinematic properties as intrinsic widths or possible rotation, have been largely unavailable. Of the sample of 65 compact, isolated HVCs catalogued by Braun and Burton (brau99 (1999)), only two had been subject to interferometric imaging. Wakker and Schwarz (wakk91b (1991)) used the Westerbork array to show that both CHVC 11410430 and CHVC 11106466 are characterized by a core/halo morphology, with only about 40% of the single–dish flux recovered on angular scales of tens of arcmin, and, furthermore, that the linewidths of the single–dish spectra of these two sources were resolved into components of some 5 km s-1 width or less. Both of the imaged systems display systematic velocity gradients along the major axis of an elliptical H i distribution, which Wakker and Schwarz judged to be suggestive of rotation in self–gravitating systems at Local Group distances.
If the CHVC objects are in fact a population of unevolved sub-dwarf galaxies scattered throughout the Local Group, then they might reveal some morphological characteristics which would not be consistent with the expectations of other suggested scenarios, in particular for objects ejected by a galactic fountain (e.g. Shapiro and Field shap76 (1976), Bregman breg80 (1980)) or located within the Galactic halo (Moore et al. moor99 (1999)).
The Westerbork imaging discussed in this paper reveals a characteristic core/halo morphology for the CHVCs, very narrow linewidths in the cores, and, in many cases, a signature of rotation. These properties are strongly suggestive of self-gravitating systems at Local Group distances, and specifically resemble the gaseous components of some dwarf galaxies. On the contrary, if the CHVC objects were produced relatively locally by an energetic mechanism responsible for a galactic fountain, then their H i properties might have been expected to include large linewidths, motions not ordered by rotation, and a characteristic morphology other than that of a core/halo.
High–resolution imaging also makes it possible to provide specific targets for optical observations. Deep optical imaging would help clarify the distinction between the CHVCs and (sub–)dwarf galaxies, and any indication of a stellar population would allow a direct distance determination. If the CHVCs are at Local Group distances, then the diffuse H emission surrounding them is expected to be weaker than that associated with high–velocity gas in complexes lying within the halo of the Milky Way or extending from the Magellanic Clouds (Bland-Hawthorn & Maloney blan99 (1999)). Furthermore, high–resolution imaging is necessary in order to interpret existing observations aimed at detecting an HVC in absorption against a star in the halo of the Milky Way or against an extragalactic background source of continuum radiation. In either case, the absorption experiment targets an extremely small area. It is not clear if the failure to detect absorption in at least some of the published accounts should be attributed to the HVC in question not in fact covering the continuum source, rather than to the metallicity characterisics of the HVC (for the cases of a negative result toward an extragalactic background sources) or to the HVC being at a larger distance (for the cases of a negative result toward halo stars). The results shown below indicate that only a small portion of each object is characterized by the high column density H i emission from the CHVC cores, and thus that selection of suitable probes for absorption–line measurements must take the actual column density distribution into account.
If the compact HVCs discussed here are distributed throughout the Local Group as primordial objects, either surviving as remnants of the formation of the Local Group galaxies, or still raining in to these systems in a continuing evolution, then such objects would also be expected near other groups of galaxies. Several searches for such objects beyond the Local Group are currently in progress. The results presented here on the small angular sizes of the CHVCs generally and the even smaller surface covering factor of the high column density cores must be considered when designing an optimum search strategy or when calculating the expected detection statistics for a given experiment directed at other galaxies or groups of galaxies. A conclusive detection experiment of this type has not yet been carried out.
2 Sample selection
Because high–resolution H i imaging had previously only been obtained for two objects of the CHVC class, we chose a sample from the catalog of Braun and Burton (brau99 (1999)) which spanned a wide range of the source properties, paying particular attention to source position both on the sky and in radial velocity, as well as to the physical attributes of linewidth and total H i flux density. Although only six CHVC sources were imaged in our program, the sources are distributed widely in galactic coordinates, span radial velocities of km s-1, vary in linewidth from 6 to 95 km s-1, and in line flux from 25 to 300 Jy km s-1. The source properties are summarized in Table 1.
| Name | RA(2000) | Dec(2000) | LDS flux | LDS FWHM | LDS structure |
|---|---|---|---|---|---|
| CHVC | (h m) | (° ′) | (Jy km s-1) | (km s-1) | (a b @ PA) |
| CHVC 069+04223 | 19 50.1 | 33 41 | 86 | 34.0 | 10 09 @ 330∘ |
| CHVC 115+13275 | 22 56.9 | 74 33 | 105 | 95.4 | 11 06 @ 114∘ |
| CHVC 125+41207 | 12 24.0 | 75 36 | 235 | 5.9 | 13 07 @ 292∘ |
| CHVC 191+60+093 | 10 36.9 | 34 10 | 66: | 29.6 | 10 09 @ 170∘ |
| CHVC 204+30+075 | 08 27.5 | 20 09 | 305: | 33.9 | 08 06 @ 215∘ |
| CHVC 230+61+165 | 10 55.2 | 15 28 | 26: | 29.3 | 14 07 @ 182∘ |
3 Data
Observations of the six CHVC fields were obtained with the WSRT array between 12/11/98 and 17/12/98. One twelve–hour integration was obtained for each field in the standard WSRT array configuration having a shortest baseline of 36 meters. On–source integration was bracketed by half–hour observations of the calibration sources 3C286 and 3C48. At the time of the observations, 11 of the 14 telescopes of the array were equipped with the upgraded receivers having a system temperature of about 27 K in the 1150 to 1850 MHz band. (As of 11/3/99 the entire array is equipped with a receiver package covering the range from 250 MHz to 8 GHz with eight feed systems mounted in a prime–focus turret.) The interim WSRT correlator system available at the time was used to provide 256 uniformly weighted spectral channels in two linear polarizations across 2.5 MHz centered on the velocity of each source. The effective velocity resolution was 1.2 times the channel spacing of 2.06 km s-1.
Standard gain and bandpass calibrations were carried out after editing the data and deleting all baselines effected by shadowing. A component model for the continuum emission from each field was derived from an image made from the average of the line–free spectral channels. This model was subtracted directly from the visibility data. The block of spectral channels containing line emission was imaged with a visibility–based clean deconvolution proceeding down to a flux level of twice the rms noise level at a variety of spatial resolutions. Uniform weighting of the visibility data was employed, together with a series of Gaussian tapers decreasing to 30% amplitude at projected baselines of 1.25, 2.5, 5, and 10 k, resulting in spatial resolutions of about 120, 60, 30, and 20 arcsec, respectively. In a few cases, some residual continuum emission was still present in the data cubes; in those cases, several spectral channels from both edges of the cube were averaged together and subtracted from the entire cube.
The typical rms noise levels in the deconvolved cubes were 2.0, 1.7, 1.4, and 1.3 mJy per beam per spectral channel at the four spatial resolutions noted above. The corresponding brightness sensitivities were, respectively, 0.085, 0.29, 0.95, and 2.0 K in a single channel of 2.06 km s-1 width. (Flux per beam and brightness temperature are related as usual by , or for , the beam area in arcsec2.) Expressed as an optically thin H i column density, the sensitivities correspond to 0.32, 1.1, 3.6, and 7.4 cm-2, respectively, for emission filling the beam and extending over a single velocity channel. While some H i emission profiles originating in the cool atomic phase are indeed as narrow as the single–channel velocity width (as we will see below), emission profiles originating in the warm neutral phase will have substantially broader linewidths. For example, the thermal linewidth of a component with kinetic temperature, K, will be 21 km s-1 FWHM. At this velocity resolution, our column density sensitivity is degraded to 1.0, 3.5, 11, and 24 cm-2. This somewhat counter–intuitive correspondence of column density sensitivity with the expected linewidth must be borne in mind. Narrow lines are significantly easier to detect than broad ones.
Moment images (zero, first, and second) were generated from each cube after employing a blanking criterion for inclusion of each pixel in the weighted sum. This involved demanding a brightness in excess of about 2 after smoothing the cube by a factor of three both spatially and in velocity. Images of integrated emission were corrected for the primary–beam response of the instrument, which is well–approximated (at 1420 MHz) by a circular Gaussian with 2110 arcsec FWHM.
While structures extending over as much as 10 arcmin in a single spectral channel were adequately recovered in the resulting images, there were also indications of the presence of more diffuse features which could not be adequately imaged. These were apparent due to the artifacts they induced; specifically, the so–called short–spacing bowl surrounding regions of bright extended emission. Even with careful windowing during the deconvolution it was not possible to completely eliminate such artifacts. Consequently, a significant fraction of the total flux detected in the single–dish observations could not be recovered. The integrated H i flux detected in the reconstructed images after primary beam correction varied from less than 1% to as much as 55% of that detected in the LDS. The percentages of total fluxes contributed by the dense cores are indicated for each observed field in Table 2.
| Name | WSRT flux | Core flux | Core area | Distance |
|---|---|---|---|---|
| CHVC | (Jy km s-1) | % | % | (kpc) |
| CHVC 069+04223 | 21.9 | 26 | 3.4 | (40–50) |
| CHVC 115+13275 | 20.7 | 20 | 10. | (40-100) |
| CHVC 125+41207 | 130. | 55 | 25 | 500–1000 |
| CHVC 191+60+093 | 0.22 | 0.3 | 0.2 | 7: |
| CHVC 204+30+075 | 116. | 38 | 48 | (40–130) |
| CHVC 230+61+165 | 0.65 | 2.5 | 0.3 | 4: |
A crude attempt was made to correct the interferometric images of integrated H i for the non–detection of diffuse emission features. An elliptical Gaussian with dimensions and orientation as measured in the LDS and an integral flux sufficient to recover the LDS total was added to the interferometric images. These parameters are summarized for the six fields in Table 2. The resulting composite images are presented in turn below. The lowest column–density contours in these composite images follow the elliptical outlines of the LDS source model, while the higher levels are dominated by the compact structures detected interferometrically. Although not appropriate for detailed analysis on spatial scales between about 10 and 30 arcmin, these composite images are consistent with all of the data currently in hand and are indicative of the column densities likely to be present in diffuse structures as well as their overall spatial extent. In at least one case (discussed below) we were able to verify with independent data that the resulting composite provided a reasonable representation of the source structure and extent.
4 Results
In this section, we briefly summarize the structural and kinematic data obtained for each of the six observed fields using the WSRT.
4.1 CHVC 069+04223
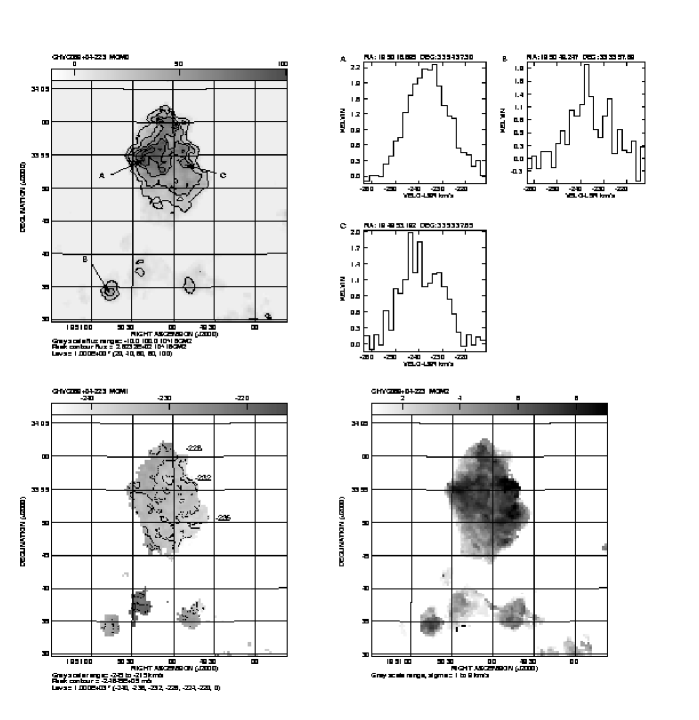
The moment images and a few representative spectra for this field are shown at 1 arcmin resolution in Fig. 1. The integrated H i distribution is dominated by a bright elongated concentration (clump A) of some 15 arcmin extent. Several fainter knots lie about 10 arcmin further to the South, and are connected to each other by a low brightness bridge of emission (more clearly seen in Fig. 2). Spectra toward some of the brightest emission regions all have () peak brightnesses of about 2 K, () relatively broad line profiles of about 15 km s-1 FWHM, and () a centroid velocity near 235 km s-1. At several local maxima within clump A the profiles become doubly peaked. These will be referred to again below. The velocity field displays at least one systematic trend: a moderate velocity gradient, oriented along PA 30∘ (East of North) along the major axis of clump A from about 230 to 240 km s-1 and extending over some 10 arcmin.
The distribution of profile linewidth shows that clump A has a moderately high linewidth throughout, but also has several distinct regions with apparent dispersions as high as 8 km s-1. These correspond to regions of line splitting rather than to simple line broadening, while the overall velocity centroid is unchanged. Two such regions are observed, centered near and . The two peaks in the line profile are separated by about 10 km s-1 in both cases, while the angular extent is only some 90 arcsec.
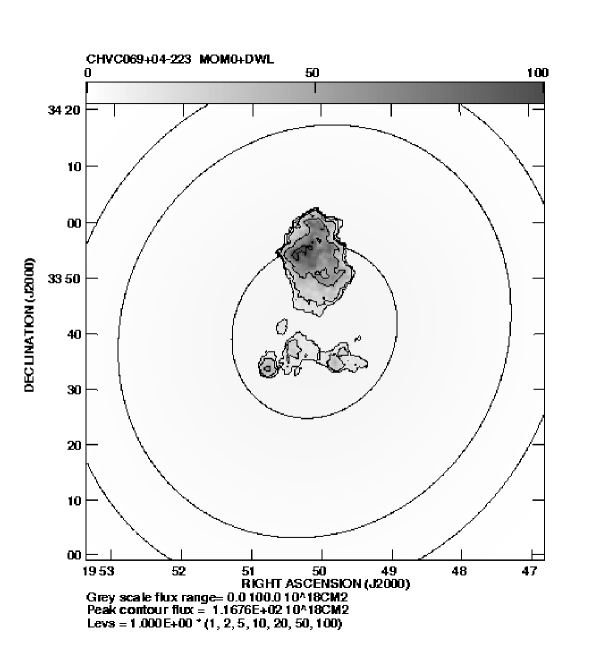
The integrated H i distribution in CHVC 069+04223, after inclusion of a simple representation of the diffuse emisison derived from the LDS data, is shown in Fig. 2. The brightest knots have column densities just in excess of 1020 cm-2, while the diffuse underlying envelope peaks at about cm-2.
4.2 CHVC 115+13275
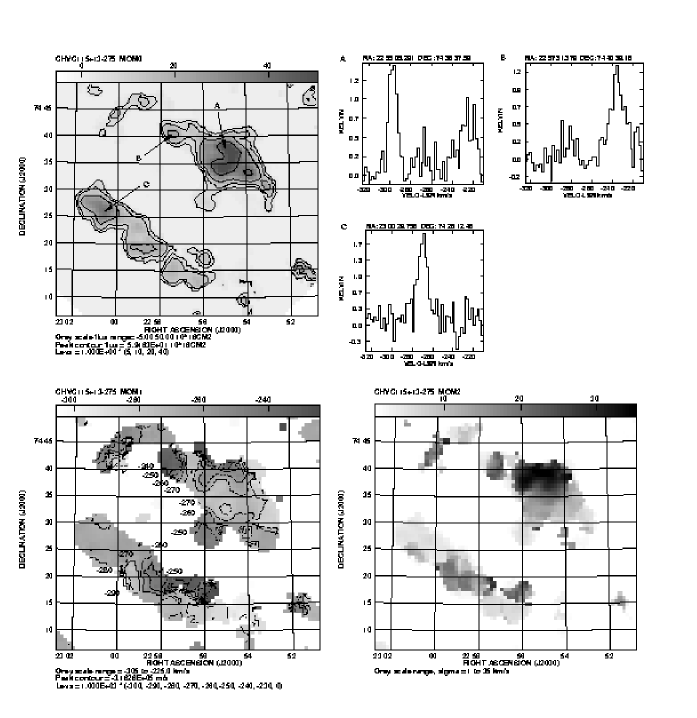
The basic data for this field are shown at 2 arcmin resolution in Fig. 3. This object is resolved in the WSRT data into a collection of approximately 10 sub–structures. Each clump is between about 1 and 10 arcmin in size, while the ensemble of clumps is distributed over a region of about 30 arcmin diameter. Spectra towards several of the clumps show that each feature has a peak brightness of about 1 K and an intrinsic velocity width of between 10 and 15 km s-1 FWHM. On the other hand, each feature has a distinct centroid velocity so that the collection spans the interval of 300 to 220 km s-1. The global distribution of the line–of–sight velocities shows no obvious pattern. High, low, and intermediate velocity clumps are distributed across the field. Some of the most extreme velocities do occur in close spatial proximity, however, near ; but comparable velocities are also seen elsewhere.
More careful examination of the individual clumps reveals that many of them have significant velocity gradients oriented preferentially along their long axes. This is true for the clumps centered near , , , and . The typical gradient observed is some 10 km s-1 over an angular extent of 5 arcmin.
The image of velocity dispersion shown in the lower–left panel of Fig. 3 serves primarily to illustrate the regions where multiple velocity components overlap along the line of sight. The morphology of the regions having multiple–velocity components does not seem peculiar, but instead suggests simply line–of–sight overlap of distinct features rather than a physical interaction.
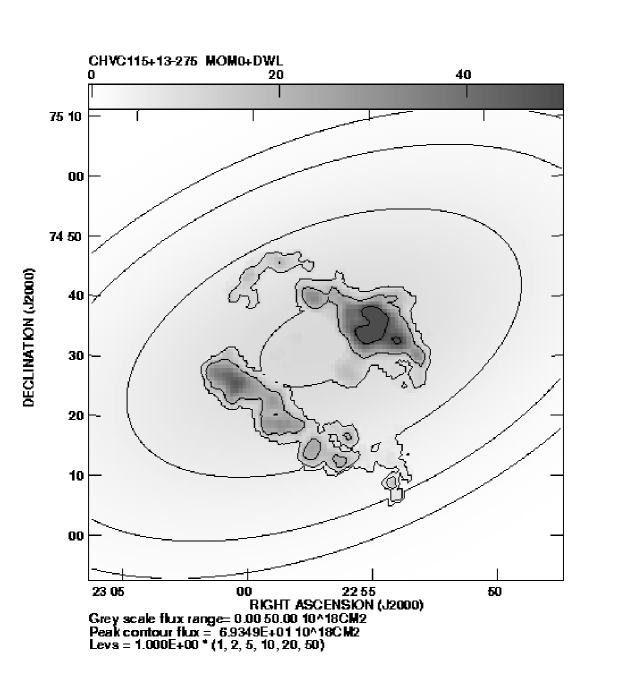
The composite image of integrated H i in CHVC 115+13275 is shown in Fig. 4. Column densities in the knots do not exceed about cm-2, while the broad underlying distribution peaks between 5 and cm-2
4.3 CHVC 125+41207
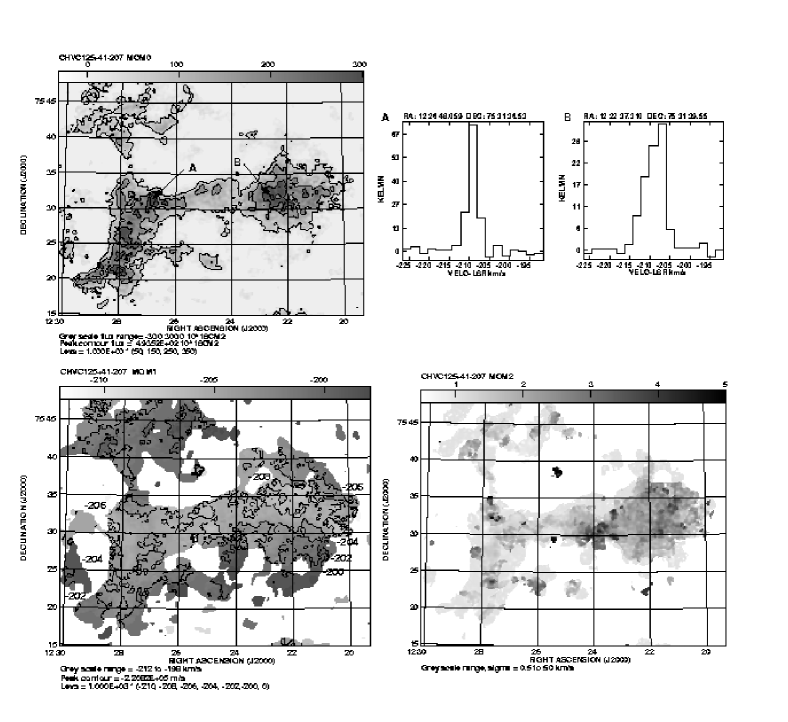
The compact high–velocity cloud CHVC 125+41207 is particularly interesting. Because of the high brightness of this source, higher angular resolution could be employed for the data presentation. Basic data at 28 arcsec resolution are shown in Fig. 5. The source has a complex filamentary morphology extending over some 45 arcmin. Several compact cores of only 1 to 2 arcmin extent are seen within the Eastern segment (clump A) of the complex. The spectrum toward the brightest compact core is quite remarkable, in having a peak brightness of 75 K as well as a linewidth which is completely unresolved with our effective velocity resolution of 2.47 km s-1. This width is one of the narrowest ever measured for the H i emission line. Velocity channels adjacent to the line peak have intensities down to about 20% of maximum while being spaced by only 2.06 km s-1. A spectrum toward the more diffuse western knot (clump B) has a more modest peak brightness of some 30 K and a linewidth of about 6 km s-1 FWHM. The most prominent systematic trend in the velocity field is a North–South gradient over clump B of about 8 km s-1 over 10 arcmin. Clump A has a shallower North–South velocity gradient of about half this magnitude. The fainter filaments have velocities which do not follow this simple pattern.
The image of velocity dispersion delineates those regions with extremely narrow linewidth from those which are only moderately narrow. Both of the compact cores in the Eastern complex as well as several other more diffuse structures are completely unresolved in velocity. Clump B is less extreme in this regard. One small region of clump B, centered near , deserves special mention. This minor local maximum in the distribution displays clear velocity splitting in the emission profile, amounting to some 5 km s-1 over a region of about an arcmin in diameter, as shown in Fig. 6. A second region displaying a similar phenomenon is centered near . Both regions are about 90 arcsec in diameter.

The composite distribution of apparent H i column density is shown in Fig. 7. The emphasis on the term “apparent” is particularly apt: as we will see below, the compact cores are likely to have opacities of about 2, so that actual column densities are about twice the apparent ones in these directions. Even so, the apparent column density exceeds cm-2 over much of the source, while the underlying halo reaches values of more than cm-2 near the knots.
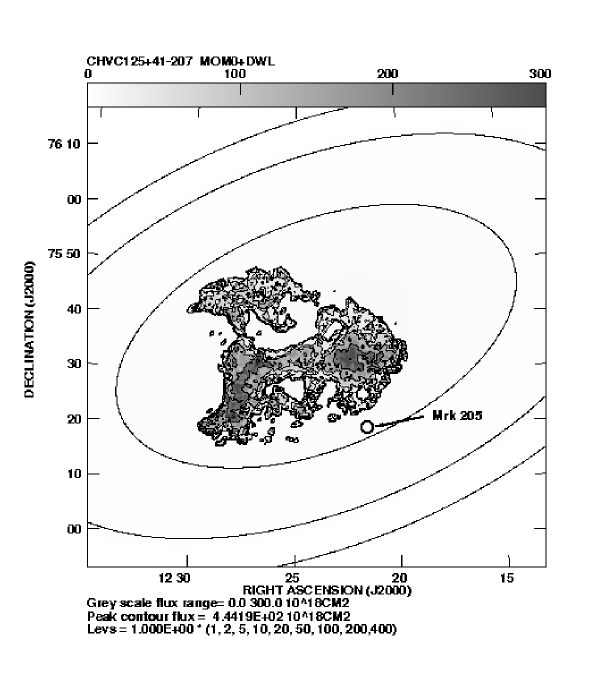
In this particular case, we can obtain some quality assessment of our simple composite image of , in which we have attempted to compensate for the limited sensitivity to diffuse structures inherent in our interferometric data. This source has recently been observed with the Lovell Telescope at Jodrell Bank by de Vries et al. (devr99 (1999)). Comparison of the cm-2 contour in the Jodrell Bank image with our composite image shows good agreement in both source size and orientation.
4.4 CHVC 204+30+075
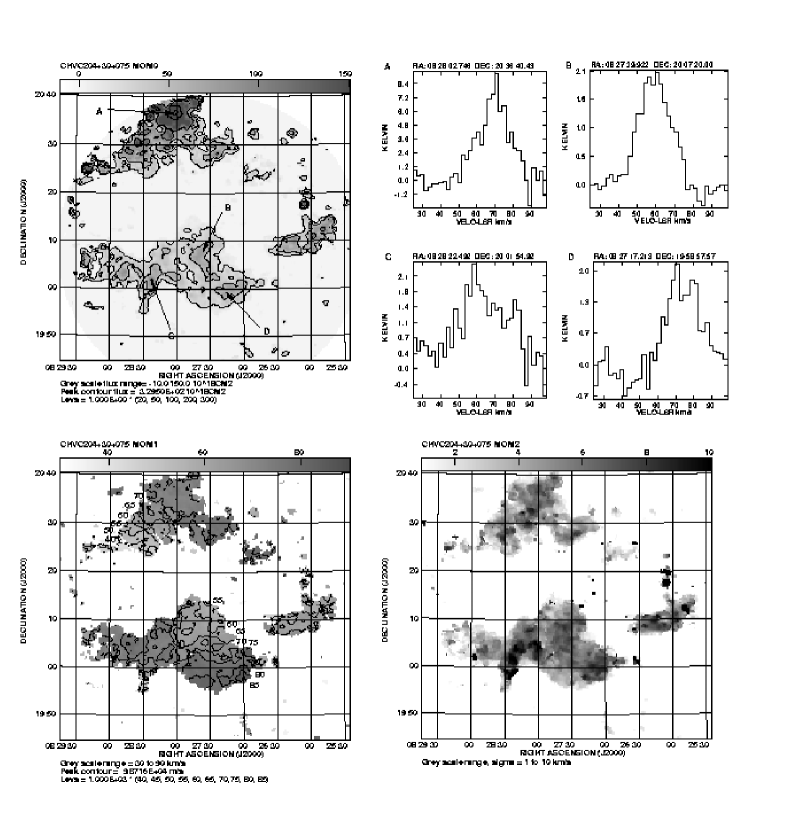
The data for this compact HVC are shown at 1 arcmin resolution in Fig. 8. Several moderately bright clumps are seen over a region of some 35 arcmin in size. The large angular extent of this object in a given velocity channel challenges reconstruction of the brightness distribution with the single 12–hour WSRT coverage which we obtained. Some questions remain regarding the reconstruction fidelity, particularly in regard to the most Northerly feature which extends down to the 10% level of the primary beam, and as such, will have had any imperfections magnified by almost a factor of 10 in the displayed result. The spectra toward the more compact local maxima have peak brightnesses between 2 K and 8 K and linewidths which are generally some 15 km s-1 FWHM. Doubly–peaked spectra are seen in two regions; in one case where two components seem to overlap along the line of sight and in another where localized line splitting is observed (as noted below). The large elliptical feature in the South–central part of the field (clump A) shows a well–defined North–South velocity gradient running from about 55 to 80 km s-1 over some 12 arcmin. The large elliptical feature in the North–East (clump B) has a similar gradient along PA 35∘ running from 45 to 70 km s-1 over 20 arcmin. Four other major clumps with more nearly discrete line–of–sight velocities fill out this system. Velocity dispersions are typically substantially less than 10 km s-1, except near where clump A appears to overlap with the smaller South–Easterly clump, and near where two velocity peaks separated by about 20 km s-1 are seen over the 60 arcsec extent of this local maxima in .
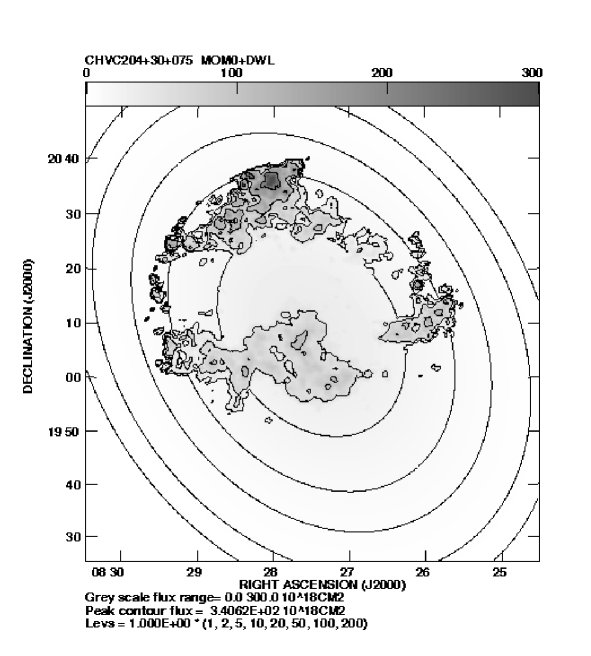
Column densities of a few times cm-2 are seen toward the brighter knots in the composite reconstruction shown in Fig. 9. A very substantial diffuse component is inferred for this field, reaching column densities of a few times cm-2 over about 30 arcmin near the source centroid.
4.5 CHVC 191+60+093 and CHVC 230+61+165
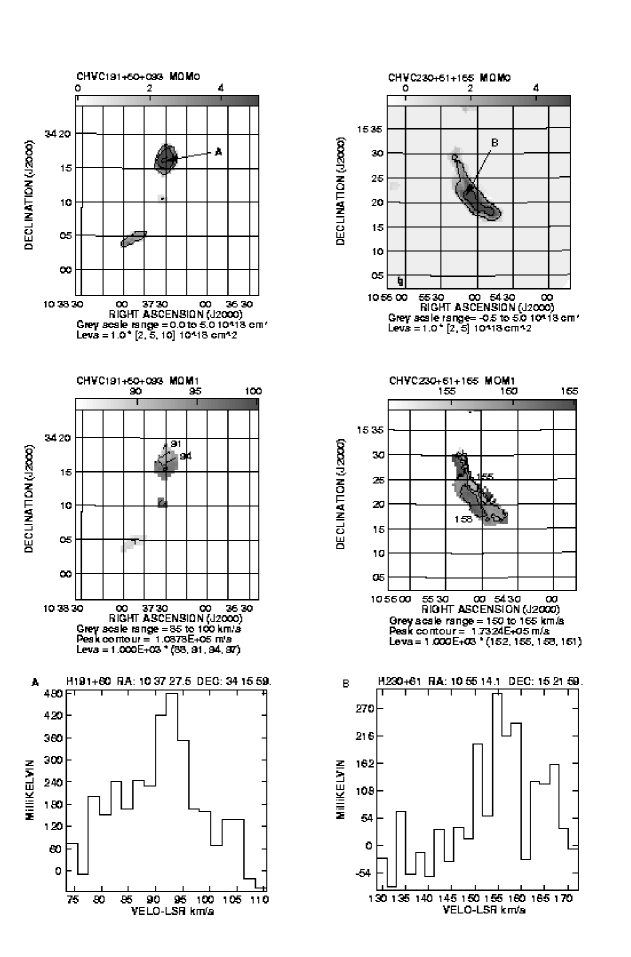
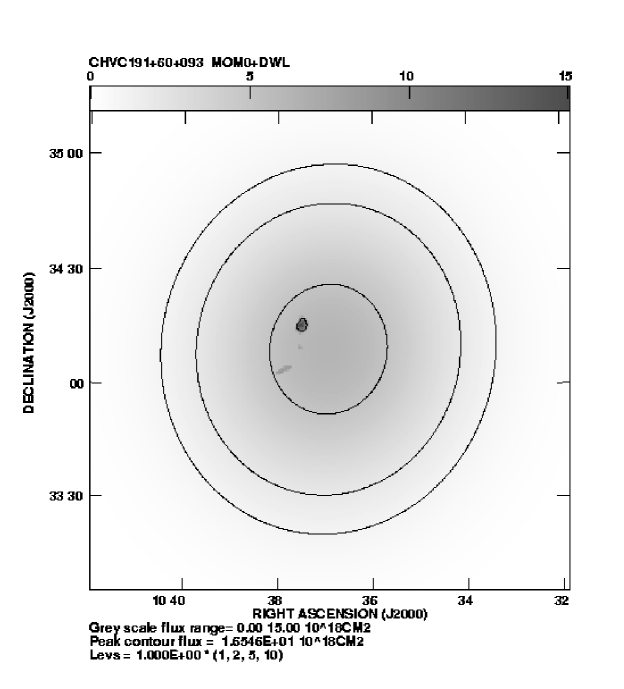
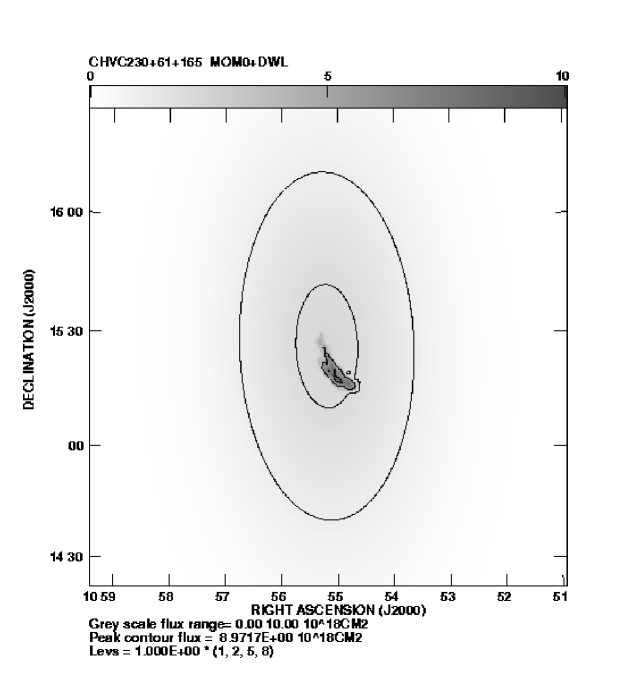
The two final sources in our sample are both quite faint and primarily diffuse, albeit small in angular size. The WSRT data at 2 arcmin resolution are shown in Fig. 10. Low–brightness clumps of 5 to 10 arcmin extent are detected in both these cases. Peak brightnesses of less than 0.5 K are seen, coupled with moderately narrow linewidths of some 6 km s-1 FWHM. The Northern clump of CHVC 191+60+093 has a moderately strong velocity gradient along PA extending from 87 km s-1 to 95 km s-1 over 5 arcmin. The velocity field of CHVC 230+61+165 shows no clear systematic trend. The composite reconstructions shown in Fig. 11 and Fig. 12 indicate peak column densities of only about cm-2, embedded in a diffuse component of only 2–5 cm-2.
5 Discussion
5.1 Overall morphology and kinematics
The six compact, isolated high–velocity clouds which we have imaged with moderately high spatial resolution span a wide range of source morphologies, but nevertheless share several noteworthy properties. In each case we detect a number of relatively compact clumps which range in size from a few arcmin to perhaps 20 arcmin in extent. These are local enhancements in the column density distribution with peak column densities in the range to cm-2. Each clump is characterized by its own line–of–sight velocity and relatively narrow line widths at 60 arcsec resolution in the range of 2 to 15 km s-1 FWHM. At the narrow linewidth extreme, very stringent limits on the H i kinetic temperature are implied which we discuss below. But even linewidths as large as 15 km s-1 FWHM are significantly less than the 21 km s-1 FWHM which corresponds to the 8000 K equilibrium temperature of the Warm Neutral Medium (WNM). Based on these modest linewidths we can already conclude that the H i in the CHVC clumps must be in the form of the Cool Neutral Medium (CNM) with typical equilibrium temperatures in the range of 50 to 200 K (e.g. Wolfire et al. 1995a , 1995b ). Each clump has a smoothly varying line–of–sight velocity across its extent, often in the form of a systematic gradient along the major axis of an elliptical distribution. We will address the best–resolved cases of velocity gradients below.
Most of the imaged CHVC systems are composed of multiple clumps. Since each clump has a distinct velocity, the total CHVC linewidth is determined primarily by the velocity spread between the clumps, and to a lesser degree by systematic velocity gradients, rather than by the intrinsic linewidth of a single entity. There are a few cases where there appears to be partial line–of–sight overlap of two distinct clumps, leading to a doubly–peaked emission profile within a single 60 arcsec beam. In the most extreme case studied so far, CHVC 115+13275, the inter–clump velocity spread amounts to some 70 km s-1. This case will also be addressed in more detail below.
In addition to the clumps, we see evidence, in all cases studied, for a substantial diffuse halo component of H i emission. The clumps account for as little as 1% to as much as 55% of the total H i emission which was detected in the single–dish observations, although a typical flux fraction is about 40%, as was also found previously by Wakker and Schwarz (wakk91b (1991)) for the two CHVCs which they imaged. The halos have typical spatial FWHM of about 1 degree and H i column densities within the inner 30 arcmin between 2 and 2 cm-2. In Table 2 we also include an indication of the surface area of the high–colum–density cores relative to the diffuse halos. This was defined as the ratio of the area with column density exceeding 5cm-2 in the WSRT-only images to the source area determined in the LDS. These values vary over a wide range, but are typically lower by a factor of about two from the fractional flux, with a mean of 15%.
The data currently available suggest a characteristic two–phase structure. The diffuse morphology of the halo is consistent with a component of WNM shielding the embedded clumps of CNM. Thermodynamic modeling of the H i (which we address in the next subsection) actually requires such a nested geometry of the warm and cool H i phases when the entire structure is immersed in an isotropic radiation field. Comparison of the H i emission spectra observed interferometrically with those seen in total power supports this conjecture, since the diffuse components generally have linewidths exceeding the 21 km s-1 FWHM thermal linewidth of an 8000 K gas. This remains a difficult issue to address in full with the limited data currently in hand. High–resolution, total–power imaging with the up–graded Arecibo telescope would allow direct assessment of the degree of sub–structure as well as the local lineshape of the halo component. This could enable unambiguous determination of the nature of the halo gas.
5.2 Narrow linewidths and opaque cores in CHVC 125+41207
A tight correlation of H i emission brightness temperature with H i opacity has been established for both the Galaxy and for M31 (Braun and Walterbos brau92 (1992)); a comparable correlation pertains for the resolved high–brightness H i structures seen in many nearby galaxy disks (Braun brau97 (1997), brau98 (1998)) which have a typical size of about 150 pc and a velocity FWHM of less than about 5 km s-1. The high brightness temperatures seen in CHVC 125+41207, amounting to about 75 K, are therefore already an indication that relatively high H i opacities are likely to be present. In this case a lower limit to the H i opacity in the bright cores can be inferred by comparing the kinetic temperature which follows from the linewidth with the emission brightness temperature. As illustrated in Fig. 5, the linewidth in the cores of clump A is completely unresolved with the available 2.47 km s-1 resolution. An upper limit to the intrinsic linewidth of about 2 km s-1 FWHM corresponds to an upper limit on the kinetic temperature of 85 K. For an isothermal gas the H i brightness temperature, , is related to the spin temperature, , by ); assuming equality of the kinetic and spin temperatures allows a lower limit on the opacity to be derived of . This must be regarded as a firm lower limit since any line broadening by turbulence, which the linewidth observed already constrains to be of order 1 km s-1 or less, would only serve to bring the implied kinetic temperature even closer to the observed brightness temperature, yielding a higher . Similarly, excitation effects which might suppress the H i spin temperature with respect to the kinetic temperature would only serve to exasperate this problem. (The interesting possibilities for constraining ISM physics with this remarkable source have prompted us to request new WSRT observations with substantially higher velocity resolution.)
Plausible lower limits to the actual H i column density toward the two compact cores in clump A of CHVC 125+41207 are therefore about cm-2 (where the apparent column is some cm-2). The angular size of these features can be determined approximately from the apparent column density distribution shown in Fig. 5. Mean spatial FWHM extents of about 90 arcsec are observed, although their flat–topped appearance suggests that opacity effects may already be partially responsible for this measured size. The FWHM of the actual column density distribution is likely to be somewhat smaller. These compact cores are seen in projection against more extended regions with apparent column densities of 1 to 2 cm-2.
The thermodynamics of H i in a variety of astrophysical settings has been studied by Wolfire et al. (1995a ; 1995b ). A stable cool phase of H i is expected when both a sufficient column of shielding gas is present, and the thermal pressure is sufficiently high. Equilibrium kinetic temperatures of 85 K are predicted to occur over a range of volume densities, depending on the dust–to–gas ratio, on the gas–phase metallicity, and on the intensity of the interstellar radiation field. These dependancies are illustrated in Figs. 5–7 of Wolfire et al. (1995a ). Since the thermal pressure in the mid–plane of our Galaxy in the solar neighborhood is fairly well–constrained to be about cm-3 K and this pressure is believed to decline substantially with height above the plane, an upper limit to the volume density of some 24 cm-3 can be assigned to H i with 85 K kinetic temperature.
Assuming that the opaque cores in CHVC 125+41207 have a roughly spherical geometry, which is indeed suggested by their projected spatial appearance and that the volume filling factor of cool H i is unity, then the column density, angular size, and volume density can be used to estimate the distance to the source, according to . This provides a lower limit to the distance to CHVC 125+41207 of 31 kpc. Of course at a distance of 30 kpc, the ambient thermal pressure is likely to have declined by more than an order of magnitude from the Galaxy mid–plane value (e.g. Wolfire et al. 1995b ), leading to a corresponding linear increase in the distance estimate. At a potential distance of few 100 kpc, it becomes important to reconsider the ionization and heating conditions that would apply.
Specific calculations of equilibrium H i conditions within the Local Group environment were made available to us by Wolfire, Sternberg, Hollenbach, and McKee (private communication) for two bracketing values of the neutral shielding column density, namely 1 and 10 cm-2, a metallicity of 0.1 solar (which we discuss further below), and a dust–to–gas mass ratio of 0.1 times the solar neighborhood value. Equilibrium volume densities at K of 3.5 and 0.65 cm-3 are found for shielding columns of 1 and 10 cm-2, respectively, as can be seen in Fig. 13. The corresponding distances are in the range of 210 to 1100 kpc. Comparison with Fig. 5 suggests that shielding columns in the higher part of this range are most relevant for the two opaque cores under consideration, suggesting a distance in the range 0.5 to 1 Mpc.

We stress that the resulting distance estimate is not dependent on details of the thermodynamic calculation, but only on the assumed thermal pressure in the source environment. Placing CHVC 125+41207 at a distance of, say, 3 kpc would require assigning it a volume density of some 250 cm-3. The well–constrained temperature of K, would then imply a thermal pressure, cm-3 K, a value vastly exceeding those observed in the local ISM. One might argue that a high pressure may be related to the high speed re–entry of the object into the Galaxy given its line–of–sight velocity in the Local Standard of Rest frame of 200 km s-1. It is difficult to reconcile such a scenario with one of the narrowest H i emission lines ever detected, showing no measurable component of turbulent line broadening. A moderately low thermal pressure, on the other hand, amounting to cm-3 K for this high–latitude, non–turbulent source, seems plausible on rather general grounds. A source distance in the range 0.5 to 1 Mpc follows directly. In this case a consistent solution for the heating and ionization of the source is also in hand, as outlined above.
Unfortunately, this method of distance determination can not be applied more generally in our current sub–sample. None of the cores in the other CHVCs we have imaged has a comparably high opacity. The typical peak brightness seen in other cores amounts to only about 2 K, suggesting opacities of about 2%, for K. With such low opacity, the likelihood of encountering unit filling factor of the gas along the line-of-sight becomes vanishingly small, so that the comparison of column and volume densities gives only a very weak lower limit to the source distance. Applying the same method blindly to the other cores in our current sample and assuming a volume density of 1 cm-3 throughout, returns lower limits to the distance which vary substantially within an individual CHVC as shown in Table 2. The method is particularly suspect for the low brightness cores (0.5 K peak) of CHVC 191+60+093 and CHVC 230+61+165, where lower limits of 7 and 4 kpc are found. Elsewhere, lower limits to the distance in the range 40 to 130 kpc are implied.
5.3 Metal abundance in CHVC 125+41207
The source CHVC 125+41207 is one of the few compact HVCs for which it has been possible to measure Mg ii absorption against a background UV source. Bowen and Blades (bowe93 (1993)) detected unsaturated Mg ii absorption at a corrected velocity of km s-1 (Bowen et al. bowe95 (1995)) toward the Seyfert galaxy Mrk 205 at . They derive a Mg ii column density of cm-2 for this component. This line of sight passes just to the South–East of the high portion of clump B shown in Fig. 7. The column density we infer in this direction from our composite image is cm-2. Wakker and Van Woerden (wakk97 (1997)) quote a value of cm-2 in a nearby direction. Analysis of the recent Jodrell Bank H i data (de Vries et al. devr99 (1999)) would provide an improved estimate. Jenkins et al. (jenk86 (1986)) provide extensive data for the gas–phase abundance of Mg ii relative to H i in the solar neighborhood. They derive relative gas–phase abundances of log( and 5.0, respectively, for low– and high–volume density lines of sight. The relative abundance we infer, log(, is about a factor of 0.07 down from the local ISM value appropriate for low volume densities. Passing as it does through only the outer reaches of the atomic halo of CHVC 125+41207, this seems the most appropriate for comparison.
We have taken care to refer to comparable measurements of gas–phase metal abundance in comparing the CHVC 125+41207 data with that of the solar neighborhood. The local ISM value is believed to be substantially depleted by deposition on dust grains from its total value, log(. If the dust abundance of CHVC 125+41207 is less than that in the solar neighborhood, which is quite likely in most formation scenarios, then dust depletion would presumably be less effective and the metal abundance might then lie somewhere in the range 0.04 to 0.07 relative to the solar value.
5.4 Localized line splitting
An interesting kinematic phenomenon to emerge from these high–resolution observations of the compact high–velocity clouds is the occurrence of several spatially localized regions which display splitting of the H i emission profiles without a related change in the velocity of the centroid of the profile. An example of the phenomenon is given by the series of spectra shown in Fig. 6. Five such regions were detected, two in each of CHVC 069+04223 and CHVC 125+41207, and one in CHVC 204+30+075. Each of these cases is associated with a relatively high column density, in excess of about cm-2. These regions are quite distinct from those instances of enhanced linewidth which are the result of localized line–of–sight overlap of extended features having different velocities. That phenomenon is also observed on several occasions (as noted above) but it can typically be recognized as such by the presence of two distinct velocity systems which are each spatially extended and have uncorrelated morphology.
The angular extent of these split–line regions is confined to 1 or 2 arcmin in all cases. The degree of velocity splitting varies from only about 5 km s-1 in CHVC 125+41207, to 10 km s-1 in CHVC 069+04223, and to as high as 20 km s-1 in CHVC 204+30+075.
Small depressions in the line core of Galactic H i emission features have often been interpreted as evidence for so–called self–absorption by the cool opaque core of a warmer semi–opaque atomic structure. Such an interpretation does not seem appropriate for the phenomena under discussion, since the line strength between the peaks declines to a rather low brightness temperature. The spatially localized and symmetric distribution of line shapes seen in Fig. 6 seems more suggestive of an organized inflow or outflow with a substantial degree of spherical symmetry. At a distance of 700 kpc, these regions would have linear sizes of 300 pc, making them comparable to some of the low luminosity super–shells detected in nearby galaxies which are powered by the supernovae and stellar winds of a stellar association (e.g. Mashchenko et al. mash99 (1999)).
5.5 Velocity gradients
A common kinematic pattern observed within the CHVC clumps which we have imaged is a velocity gradient oriented along the major axis of a roughly elliptical distribution. Specific examples of such gradients were noted above for several of the objects imaged. The observed magnitudes of the velocity gradients vary from 0.5 to 2 km s-1 arcmin-1. The cases which are best resolved are clump A of CHVC 069+04223 and clumps A and B of CHVC 204+30+075, each of which is about 20 arcmin in angular size. This same pattern was also seen in the two CHVCs imaged by Wakker and Schwarz (wakk91b (1991)), namely CHVC 11410430 and CHVC 11106466.
Since these well–resolved examples of systematic gradients in the velocity fields are reminiscent in form and amplitude of the “spider” diagrams seen for H i distributions in some dwarf galaxies, we carried out standard tilted–ring fits to assess the extent to which they could also be modeled by rotation in a flattened disk system. In the usual way, we began by allowing all kinematic parameters to vary freely from ring to ring, and then solved sequentially for the best–fitting kinematic center, for the systemic velocity, for the position angle of the receding line–of–nodes, and, finally, for the kinematic inclination. Holding all of these best–fitting parameters fixed, we then fit only for the rotation velocity of each ring.

Robust solutions for circular rotation were found in all three cases and these are shown in Fig. 14. The fits display slowly rising rotation velocity with radius; the rise is continuous to some 15 km s-1 in the case of CHVC 069+04223A, and flattens out at 500 to 600 arcsec to values of 15 and 20 km s-1 for CHVC 204+30+075A and B. An estimate of the contained dynamical mass is given by , while the mass of gas, , where is the integrated H i flux in units of Jy km s-1 and there is an assumed contribution by Helium of 40% by mass. At an assumed distance of 0.7 Mpc, these three clumps have , , and M⊙, , , and M⊙, and dark–to–visible mass ratios of , 36, and 29, respectively. The derived value of scales with the assumed distance as , given the dependencies noted above.
In addition to this crude estimate of dynamical mass, we can compare our derived rotation curves with those expected for a cold dark matter halo as parameterized by Navarro, Frenk, and White (NFW, nava97 (1997)). These authors find that such halos tend to have a “universal” shape in their extensive numerical simulations, so that the density profile and resulting rotation velocity are determined simply from the halo mass. We have calculated halo properties using the (web–retrieved 19/09/99 version) code of Navarro, Frenk, and White (nava97 (1997)) assuming =0.3, =0.7, H0= 60 km s-1 Mpc-1 and a cluster abundance normalized fluctuation spectrum. The early plateau and subsequent rise in the derived rotation velocity of CHVC 069+04223A is not well-fit by an NFW halo. For comparison, the expected rotation curve of a M⊙ (within the virial radius of 3.4 kpc) NFW halo is overlaid on the data. While this curve crudely matches the last few measured points, the shape at smaller radii deviates substantially. On the other hand, rather good agreement with the data is found for both CHVC 204+30+075A and B with halo masses of , and M⊙ (within 9.3 and 12.6 kpc) at an assumed distance of 0.7 Mpc. These rotation curves are overlaid on the data in Fig. 14. Note how well the shape of these rotation curves is reproduced by the standard NFW halo profile.
5.6 CHVC stability
The very high total linewidth seen for CHVC 115+13275 was found to arise from the broad range of distinct line–of–sight velocities of the ten individual clumps which make up this source. The angular separation of the clumps is some 30 arcmin, while their velocity centroids are separated by as much as 70 km s-1. Since this source is very isolated in position and velocity (see the appropriate panel of Fig. 1 of Braun and Burton brau99 (1999)) a chance superposition of ten unrelated components is unlikely.
It is interesting to consider the stability of this collection of clumps under several scenarios. If, for instance, this collection were located at a distance of 5 kpc, the distribution of clumps would have a linear diameter of 44 pc and would double in size on a timescale of only yr. Such a short dynamical timescale would imply that we were witnessing a rather special moment in the evolution of this source. If, on the other hand, this source were located at a distance of 0.7 Mpc and were self–gravitating, the angular radius and half–velocity width of 15 arcmin and 35 km s-1 could be used to calculate a dynamical mass from M⊙. The corresponding mass of gas at this distance, is M⊙. The dark–to–visible ratio at this assumed distance is = 51, scaling, as in the previous subsection, with .
A comparable analysis can be applied to CHVC 043, for which Arecibo imaging data was obtained by Giovanelli (giov81 (1981)). This object has only two primary core components which extend over about 40 arcmin, and are separated by 60 km s-1 in velocity, while the total line flux is 260 Jy-km s-1. Using the half-separations and line flux yields M⊙, M⊙ and = 20 for = 0.7 Mpc. Since only two core components are involved, geometric effects of orientation are more likely to play a role in this calculation than in the case of CHVC 115+13275.
5.7 Comparison with nearby galaxies
The H i imaging obtained here for our CHVC sub–sample reveals striking similarities between the gas properties of the CHVCs and those of low mass galaxies. The comparison with the Local Group dwarf irregulars, Leo A and Sag DIG, studied at high resolution by Young and Lo (youn96 (1996), 1997b ) is particularly apt. Both of these objects display the same general morphology and kinematics as the CHVCs: high column density clumps characterized by narrow linewidths (about 8 km s-1 FWHM) and angular sizes of a few arcmin embedded in a diffuse halo of lower column density gas with broader linewidths (about 20 km s-1 FWHM) extending over 10’s of arcmin. Young and Lo reach the same conclusion presented here regarding the H i phase content of the dwarf irregulars, namely that cool condensations of CNM (with 100 K) are found within WNM envelopes (with 8000 K). The peak brightness temperatures detected from the CNM in Leo A, 73 K, are almost identical to those we see in the compact clumps of CHVC 125+41207.
The velocity fields of both Leo A and Sag DIG are also very similar to those of the CHVCs. Modest velocity gradients of comparable magnitude are observed (about 10 km s-1 over 10 arcmin) along one position angle in addition to a substantial unstructured component. Unlike the CHVCs, these galaxies contain comparable gas and stellar masses, each corresponding to about 108 M⊙ in the case of Leo A and about 107 M⊙ in Sag DIG.
Young and Lo also comment on a small region of about 2.5 arcmin diameter within Leo A which they suggest might be the expansion or contraction signature of an H i shell, comparable to the five cases of line–splitting within CHVCs which we describe above.
The dwarf elliptical companions of M31, NGC 185 and NGC 205 (Young and Lo 1997a ) are rather different in their gas properties. While both the CNM and WNM components of H i are seen in these two cases, all of the neutral gas is concentrated to the central five arcmin (1 kpc) of each galaxy and the global kinematics are less systematic. The strong interaction of these objects with M31 (NGC 205 in particular is on an orbit that is likely to have recently passed through the disk of M31) and the high mass density of stars (stellar masses about 100 times greater than the 105.5M⊙ in gas) makes a direct comparison with the CHVCs less obvious.
An intermediate and less–perturbed example is given by the more isolated Local Group dwarf spheroidal LGS 3 (Young and Lo 1997b ). In this case, the stellar mass is likely only a few times that of the 105.8 M⊙ in gas. Here the H i is also confined to only the inner 5 arcmin (corresponding to 1 kpc), shows little systematic kinematics, and the cool condensed phase is almost entirely absent. Although peak H i column densities of somewhat more than 1020 cm-2 are observed over a region of a few arcmin extent, there is no sign of ongoing star formation.
Extending the comparison to even higher mass systems provides some further insight into the conditions necessary for allowing the condensation of CNM clumps in a galactic environment. Several low mass spirals were observed in the high resolution H i sample of Braun (brau95 (1995), brau97 (1997)), including the nearby SBm galaxy NGC 2366 and two of the nearest low surface brightness spirals, NGC 247 (of type Sc) and NGC 4236 (SBd). A filamentary network of CNM gas is seen in all these systems, which accounts for about 80% of the H i line flux from only about 15% of the surface area within (the radius where the average face-on surface brightness of light in the B band has declined to 25 mag arsec-2). Just beyond the flux fraction of CNM gas disappears entirely, even though the WNM continues out to a radius of almost twice . The result is that the total flux fraction due to CNM in these galaxies is about 70%, substantially more than the 40% CNM fraction in the CHVCs. Comparison with the H i thermodynamics of Wolfire et al. (1995a ) suggest that the edge of the CNM disk should occur where the thermal pressure has declined to a value of , below which CNM condensation is no longer possible. The numerical value of depends on the dust and gas phase metal abundance, the radiation field intensity and the shielding column of neutral gas. Values for /k of about 200 cm-3 K seem indicated under conditions of moderate metallicity and radiation field-intensity expected for the low mass spirals above. Comparison with Fig. 13 suggests that slightly lower values for /k of about 100 cm-3 K should be expected under the low metallicity, low field–intensity conditions that might apply to the CHVCs.
What pressures might be expected in the mid-plane of a disk–like self–gravitating distribution of H i ? The concept of hydrostatic pressure equilibrium demands that the weight of the overlying medium is balanced by the sum of the contributions to the gas pressure. This can be expressed as
| (1) | |||||
| (2) |
where is the gas volume density at height from the mid-plane. In this form, refers to the mass surface density between to , not between to . The total pressure is composed of magnetic, cosmic ray, and turbulent components in addition to the thermal component which is of relevance to the calculation of the HI kinetic temperature. In a high mass galactic disk, the thermal pressure might amount to only about 1/4 of the total pressure, while in a low mass CHVC with few if any sources of internal turbulence and energetic particles, the thermal pressure might be the dominant component. If for simplicity we assume a constant gas density, , for for some full disk thickness, , then for less than . For the moment we will neglect contributions to the mass surface density by stars or dark matter, which if present would lead to proportionally higher pressures. Equation 2 then becomes simply
| (3) |
Inserting numerical values into eqn. 3 yields
| (4) |
Thus, whenever the face–on H i column density exceeds about 1020 cm-2 in a disk–like system we can expect to see the cool condensations of the CNM. Given the quadratic dependence on column density in eqns. 2–4, we might expect the transition from purely WNM to a CNM/WNM mix to be quite abrupt. This expectation is borne out quite dramatically at the edge of the CNM disks in spiral galaxies which indeed occurs very near a face–on H i column density of 1–21020 cm-2. If a significant contribution to the mass surface density within one gas scale height were due to stars or dark matter then the minimum column density needed for CNM condensation would decrease. For the CHVCs, our current data suggest a transition column density nearer 1019 cm-2, rather than the 1020 cm-2 seen in nearby spirals. This may be an indication that the mass surface density of dark matter is already a significant contribution.
We can assess this possibility by considering the mass volume density of the implied dark halos. The density distribution of the M⊙ NFW halo which gave a good fit to the derived rotation velocity of the core in CHVC 204+30+075B (Fig. 14) is shown in Fig. 15. At a thermal pressure of cm-3 K, the 8000 K WNM halos of the CNM cores will have a volume density of about 0.01 cm-3. Comparison with Fig. 15 shows that the dark halo will provide a dominant contribution to the mass density out to several kpc. Within the central region, of perhaps 2 kpc (or 10 arcmin at Mpc) in diameter, the mass density is enhanced by more than a factor of 10 over that of the gas alone. In consequence, we can expect to achieve values of /k of about 100 cm-3 K in the CHVCs whenever the H i column densities exceed a few times 1019 cm-2.

6 Summary
We present some of the first high–resolution H i imaging of a sub–sample of the compact high–velocity clouds (CHVCs). Previously we had demonstrated that the spatial and kinematic properties of the CHVCs were strongly suggestive of a Local Group origin (Braun & Burton brau99 (1999)), although the typical distance could not be well–constrained from the low resolution (05) data then in hand.
Our imaging has revealed that these objects have a characteristic morphology, consisting of one or more quiescent, low–dispersion compact cores embedded in a diffuse, warmer halo. This is consistent with what was seen previously by Wakker & Schwarz (wakk91b (1991)) for the two CHVCs which they imaged. The compact cores can be unambiguously identified with the cool neutral medium (CNM) of condensed atomic hydrogen, since their linewidths are in all cases significantly narrower than even the thermal linewidth of the warm neutral medium (WNM). In one object we detect some of the narrowest H i emission lines yet seen, with an intrinsic FWHM of 2 km s-1. The halo linewidths, while difficult to measure directly, appear broad enough to be consistent with a WNM origin. Such a nested geometry of CNM and WNM is in agreement with the expectation from thermodynamics since a significant neutral shielding column is required for the stable existence of CNM when exposed to an ionizing radiation field (e.g. Wolfire et al. 1995a ; 1995b ). The flux fraction in compact cores varies between about 1% and 50% in our CHVC sub–sample, but is typically 40%, as also seen in the two cases studied by Wakker and Schwarz (wakk91b (1991)). The surface covering factor of the moderate column density core emission relative to the diffuse halo is usually a factor two lower, namely about 15%.
High–resolution imaging of the H i column density distribution of CHVC 125+41 has permitted an improved determination of the metal abundance in this object when combined with a previous measurement of unsaturated Mg ii absorption (Bowen & Blades bowe93 (1993), Bowen et al. bowe95 (1995)) of between 0.04 and 0.07 solar.
The current program has also allowed meaningful distance estimates for CHVCs to be made for the first time. Distances in the range 0.5 to 1 Mpc follow from two independent approaches. The first method utilizes the fact that we have resolved cool, opaque knots of H i within one of the six imaged systems (CHVC 125+41). By equating the observed angular size of these knots with the line–of–sight depth, we derive a distance from a comparison of the column and volume densities. Estimates of the column density follow directly from our data, while specific thermodynamic calculations for volume densities under the relevant physical conditions were made available to us by Wolfire, Sternberg, Hollenbach, and McKee (private communication). The second approach allows only a combination of source distance and dark matter fraction to be derived, since it relies on a comparison of dynamical with visible mass under the assumption that the system is gravitationally bound. For this approach, the CHVC 115+13 system proved particularly illuminating, since a collection of some 10 compact cores is distributed over a 30 arcmin diameter region within a common diffuse envelope, while having discrete line–of–sight velocities distributed over a 70 km s-1 range. At an assumed distance, Mpc, the dark–to–visible mass ratio is , with scaling as .
A common feature observed in the CHVCs is that the compact cores have an elliptical shape with a clear velocity gradient aligned with the major axis. These kinematic data can be well–modeled by rotation in flattened disk systems. Rotation curve fits to the best–resolved cores within CHVC 069+04 and CHVC 204+30+075, yield rather high dark-to-visible mass ratios of = 10–40 at D = 0.7 Mpc, with scaling, as above, with 1/D. Moreover, the shape of the rotation curves in two of these three cases is very well described by that due to a cold dark matter halo as parameterized by Navarro et al. (nava97 (1997)).
Well–resolved imaging has also revealed another intriguing aspect of the CHVCs. Five instances of localized line splitting are detected. These are areas of 60 to 90 arcsec extent in regions of moderately high column density in which the H i emission profile becomes doubly peaked in velocity, without displaying a shift in the velocity centroid. This appears to be a signature of localized outflow or inflow. At a distance of 0.7 Mpc they would correspond to feaures of a few hundred pc in extent, comparable in size to the stellar–wind–driven bubbles surrounding young stellar associations.
Comparison of the CHVC properties with those of nearby low mass galaxies shows striking similarities, particularly with the Local Group dwarf irregulars. The required thermal pressure for condensation of the cool CNM cores, /k 100 cm-3 K, can be achieved in hydrostatic equilibrium of a self–gravitating disk–like distribution at the observed shielding H i column of WNM of about 1019 cm-2 if the significant mass density of the dark matter halos is taken into account within the inner 2 kpc.
Our study of the compact high–velocity–clouds has helped to clarify the nature of these objects. All of the evidence points to these being strongly dark–matter–dominated, self–gravitating objects of modest mass in the Local Group potential at distances between perhaps 0.3 and 1 Mpc with physical dimensions in H i of about 10 kpc. Typical H i masses of a few times 107 M⊙ are indicated, with associated dark masses of some 109 M⊙. The total number of such objects associated with the Local Group, while still uncertain, may be about 200. It seems likely that these are the objects which recent numerical simulations suggest should still be associated with massive galaxies in a poor environment at the current epoch (Klypin et al. klyp99 (1999), Moore et al. moor99 (1999)).
The star formation history within these objects is still very much a mystery. High stellar densities, like those seen in dwarf spheroidal systems in the Local Group, are clearly not associated with the centroids of the gas distribution. A large spatial separation of the gas and associated stellar distribution, due for example to tidal effects, is not expected to be a common circumstance since the population is dynamically so cold. The peak H i column densities currently observed within the CHVC cores only rarely exceed 1020 cm-2. It is plausible that these values are insufficient to allow widespread star formation at this time. On the other hand, finite yet low metallicities have been measured in at least one source, indicating that some enrichment has clearly taken place in the past. It is quite possible that associated old stellar populations with a low surface density will be found in deep searches which can distinguish such stars from the Galactic foreground.
Acknowledgements.
We are grateful to M.G. Wolfire, A. Sternberg, D. Hollenbach, and C.F. McKee for providing the equilibrium temperature curves for H i in an intergalactic radiation field shown in Fig. 13 as well as stimulating correspondence on the ISM in general, and to U. Schwarz and H. van Woerden for showing us, in advance of publication, the Jodrell Bank data of de Vries et al. (devr99 (1999)) on the source CHVC 125+41207. The Westerbork Synthesis Radio Telescope is operated by the Netherlands Foundation for Research in Astronomy, under contract with the Netherlands Organization for Scientific Research.References
- (1) Bajaja E., Morras R., Pöppel W.G.L., 1987, Pub. Astr. Inst. Czech. Ac. Sci. 69, 237
- (2) Bland-Hawthorn J., Maloney P.R., 1999, in Stromlo Workshop on High-Velocity Clouds, eds. Gibson, B.K. & Putman, M.E., (ASP Conf 166), 212
- (3) Blitz L., Spergel D.N., Teuben P.J., Hartmann D., Burton W.B., 1999, ApJ 514, 818
- (4) Bowen D.V., Blades J.C., 1993, ApJ 403, L55
- (5) Bowen D.V., Blades J.C., Pettini M., 1995, ApJ 448, 662
- (6) Braun R., 1995, A&AS 114, 409
- (7) Braun R., 1997, ApJ 484, 637
- (8) Braun R., 1998, in Interstellar Turbulence, eds. Franco J., Carraminana A. (Cambridge: Cambridge University Press), 52
- (9) Braun R., Burton W.B., 1999, A&A 341, 437
- (10) Braun R., Walterbos R.A.M., 1992, ApJ 386, 120
- (11) Bregman J.N., 1980, ApJ 236, 577
- (12) Burton W.B., 1997, in The Physics of the Galactic Halo, eds. Lesch H., Dettmann R.-J., Mebold U., Schlickeiser R. (Berlin: Akademie Verlag), 15
- (13) de Vries G., Schwarz U.J., Smoker J., Davies R.D., van Woerden H., 1999, private communication
- (14) Eichler D., 1976, ApJ 208, 694
- (15) Einasto J., Haud U., Jôeveer M., Kaasik A., 1976, MNRAS 177, 357
- (16) Giovanelli R., 1981, AJ 86, 1468
- (17) Hartmann D., Burton W.B., 1997, “Atlas of Galactic Neutral Hydrogen” (Cambridge: Cambridge University Press)
- (18) Jenkins E.B., Savage B.D., Spitzer L., 1986, ApJ 301, 35
- (19) Klypin A., Kravtsov A.V., Valenzuela O., Prada F., 1999, ApJ 522, 82
- (20) Mashchenko S.Y., Thilker D.A., Braun R., 1999, A&A 343, 352
- (21) Moore B., Ghigna S., Governato G., Lake G., Quinn T., Stadel J., Tozzi P., 1999, ApJ 524, 19
- (22) Navarro J.F., Frenk C.S., White S.D.M., 1997, ApJ 490, 493
- (23) Oort J.H., 1966, Bull. Astr. Inst. Netherlands 18, 421
- (24) Oort J.H., 1970, A&A 7, 381
- (25) Oort J.H., 1981, A&A 94, 359
- (26) Putman, M.E., Gibson, B.K., 1999, PASA 16, 70
- (27) Shapiro P.R., Field G.B., 1976, ApJ 205, 762
- (28) Verschuur G.L., 1975, ARA&A 13, 257
- (29) Wakker B.P., Schwarz U., 1991, A&A 250, 484
- (30) Wakker B.P., van Woerden H., 1991, A&A 250, 509
- (31) Wakker B.P., van Woerden H., 1997, ARA&A 35, 217
- (32) Wolfire M.G., Hollenbach D., McKee C.F., Tielens A.G.G.M., Bakes E.L.O., 1995, ApJ 443, 152
- (33) Wolfire M.G., McKee C.F., Hollenbach D., Tielens A.G.G.M., 1995, ApJ 453, 673
- (34) Young L.M., Lo K.Y., 1996, ApJ 462, 203
- (35) Young L.M., Lo K.Y., 1997a, ApJ 476, 127
- (36) Young L.M., Lo K.Y., 1997b, ApJ 490, 710