Calibration and First light of the Diabolo photometer at the Millimetre and Infrared Testa Grigia Observatory
Abstract
We have designed and built a large–throughput dual channel photometer, Diabolo. This photometer is dedicated to the observation of millimetre continuum diffuse sources, and in particular, of the Sunyaev–Zel’dovich effect and of anisotropies of the 3K background. We describe the optical layout and filtering system of the instrument, which uses two bolometric detectors for simultaneous observations in two frequency channels at and . The bolometers are cooled to a working temperature of provided by a compact dilution cryostat. The photometric and angular responses of the instrument are measured in the laboratory. First astronomical light was detected in March 1995 at the focus of the new Millimetre and Infrared Testa Grigia Observatory (MITO) Telescope. The established sensitivity of the system is of . For a typical map of at least 10 beams, with one hour of integration per beam, one can achieve the rms values of and the 3K background anisotropy , in winter conditions. We also report on a novel bolometer AC readout circuit which allows for the first time total power measurements on the sky. This technique alleviates (but does not forbid) the use of chopping with a secondary mirror. This technique and the dilution fridge concept will be used in future scan–modulated space instrument like the ESA Planck mission project.
Key Words.:
Instrumentation: detectors – Instrumentation: photometers – Methods: observational – Cosmology: cosmic microwave background – Cosmology: observations – Radio continuum: general1 Introduction
The continuum emission of various astrophysical objects in the millimetre domain has long been proposed as one important clue to many physical processes in the Universe: such emission includes dust, free–free, synchrotron emissions, but also fluctuations of the Cosmic Microwave Background (CMB), either primordial (Smoot et al. 1992) or due to intervening matter (Sunyaev & Zel’dovich 1972). In the past 15 years, the field of millimetre and far infrared measurements has tremendously grown. The advances in instrument technology have allowed many discoveries, with ground-based observations of our Galaxy and of extragalactic sources, with the many successful ground-based and balloon-borne CMB anisotropy experiments, and with the instruments onboard the COBE satellite. Following the experience acquired with the submillimetre balloon–borne PRONAOS–SPM experiment (Lamarre et al. 1994), we have devised a millimetre photometer called Diabolo, with two channels matching the relatively transparent atmospheric spectral windows around 1.2 and 2.1 . This instrument is designed to be used for ground–based observations, taking advantage of the large area provided by millimetre antennas such as the 30 m telescope of IRAM, and of long integration times that can be obtained on a small dedicated telescope. Such observations are complementary to those that can be made with highly-performing but costly and resolution–limited space–borne instruments or short duration balloon–borne experiments.
There are two main disadvantages to ground–based measurements, which are:
-
•
a larger background, which not only produces a larger photon noise but also limits the sensitivity of bolometers because of their power load, especially when one tries to obtain broad–band measurements with a throughput () much larger than the diffraction limit
-
•
additional sky noise, mainly due to the fluctuating water vapour content in the atmosphere, and which is usually the main limitation of ground–based instruments unless properly subtracted (see e.g. Matthews 1980, Church 1995, Melchiorri et al. 1996).
There are two usual methods for the subtraction of sky noise, either spatial or spectral ones. The spatial subtraction method uses several detectors in the focal plane of the instrument and takes advantage of the spatial correlation of the atmospheric noise. For this technique to work, the source size must be smaller than the array size. It is especially suited for big telescopes for which the beams from the different detectors have not diverged much when crossing the 2–3 kilometre high water vapour layer. Kreysa et al. (1990), Wilbanks et al. (1990), and Gear et al. (1995) have used this technique with bolometer arrays (MPIfR bolometer arrays, SuZie photometer and SCUBA arrays respectively).
The spectral subtraction method takes advantage of the correlation of the atmospheric signal at different wavelengths. If the source signal has a continuum spectrum different from the water vapour emission, one can form a linear combination of the source fluxes at different wavelengths which should be quite insensitive to sky noise. This technique has been used in various photometers. For extended sources like clusters of galaxies (see below), it has been used by Meyer et al. (1983), Chase et al. (1987) and Andreani et al. (1996, see also Pizzo et al. 1995). In particular the spectra of the 3K CMB distortions (either primordial or secondary) are quite different from the water vapour emission as can be seen in Fig 1. This technique implies that the smaller wavelength channels do not work at the diffraction limit, so that the beams at the different wavelengths are co-extensive. Hence, for broad continuum measurements, the detectors can only be large-throughput bolometers.

Once and if the sky noise can be subtracted, the need for sensitive large-throughput bolometers implies the lowest possible working temperature (see Sect. 3 & Subsect. 4.3). Diabolo has been built following this line of thought. It is a simple dual-channel photometer, with two bolometers cooled to 0.1 Kelvin for atmospheric noise subtraction using the spectral subtraction method adapted to small telescopes. Its design and performance are described in the rest of this paper, which is organised as follows. Section 2 describes the optical layout of the photometers and the filters we use for the proper selection of wavelengths. Section 3 describes the dilution cryostat that is used to cool the bolometers. Section 4 deals with the design and testing of the 2 bolometers. Section 5 gives details on the new bolometer AC readout electronic circuit which is used for the measurements. Section 6 gives the characterisation of the instrument that was possible with the first observations at the new 2.6 metre telescope at Testa Grigia (Italy). Finally, we discuss in Section 7 the recent improvements that have been made over the original design.
2 Optical and Filtering systems
2.1 Optical system
In order that future versions of the photometer can accomodate small arrays of bolometers on each channel, imaging cold optics have been designed for Diabolo. Using lenses rather than mirrors, the system is compact enough that two (and possibly three in a next version) large throughput channels fit into a small portable dewar. The sky is imaged through a cold pupil lens onto a cold focal plane lens. For each channel, the light is then fed by another lens onto the bolometer and its associated Winston cone. The lenses are made of quartz (of index of refraction 2.14) with anti–reflection coatings adapted to each wavelength. As in the PRONAOS–SPM photometer (Lamarre et al. 1994), the optical plate is sustained below the cryostat by three pillars and contains the optical and filtering systems (Fig. 2). It is shielded by a 1.8 K screen covered with eccosorb. The cryogenic plate (Fig. 3), which is in direct contact with the lHe cryostat (pumped to 1.8 K), receives the dilution fridge (Section 3) which provides cooling of the two bolometers (Section 4). Ray–tracing was done including considerations on diffraction in order to optimise the parameters of the lenses and cones (with limited use of ASAP software). Care was taken to underilluminate the secondary and primary mirrors to reduce sidelobe levels (the photometer effectively uses 2 metres out of the 2.6 m of the primary mirror of the Testa Grigia telescope).


In inverse propagation mode, the beam exiting the photometer has a
5.6 f ratio and the useful diameter of the exit (plane parallel
high–density polyethylene) window is 27.5 mm. This matches the
bolometer throughput of ,
well above the diffraction limit for both channels which is 2.3 and
in channel 1 and 2.
2.2 Filtering system
We have devised a filtering system in order to select the appropriate wavelengths while avoiding submillimetre radiation that would load the bolometers. This system does not rely on the atmosphere to cut unwanted radiation. Figures 4 & 5 summarise the different filters, which are all at 1.8 K temperature except for the first infrared cutoff filter (77 K). Measurements were done on each element separately at room temperature only and at normal incidence. In the submillimetre up to 1.8 mm, this was accomplished with a Fourier Transform Spectrometer, with a 0.3 K bolometer as the detecting device at the Institut d’Astrophysique Spatiale (IAS) facility. Several measurements around 2 mm were done with a heterodyne receiver and a carcinotron emitter at the Meudon Observatory facility (DEMIRM). Once all the measured transmissions are multiplied together we find an overall expected photometer transmission which is a factor 2.5 larger than the transmission deduced from point-source measurements. A large fraction of the discrepancy can be attributed to the optical elements that were not included in the calculation: the cryostat entrance window and the lenses, as well as to some diffractive optical losses.


3 The dilution cryostat
In order to have a system noise as close as possible to the photon noise, we decided to cool the detectors to 0.1 K (see Subsect. 4.3). The development of a 0.1 K cooling system fully compatible with balloon-borne and satellite environments has been pursued at the Centre de Recherches sur les Très Basses Températures (CRTBT) in Grenoble (Benoit et al. 1994a, Benoit & Pujol 1994). The compactness and ease of use of this system render it very attractive even for ground-based photometers. Conversely, the Diabolo photometer provides a good testbed for this refrigerator before it is used on space missions. Figure 6 shows the layout of the dilution cryostat. This new refrigerator (Benoit et al. 1994b, Sirbi et al. 1996) is the first prototype of a concept that has become the baseline for the ESA Planck mission (formerly COBRAS/SAMBA). Its principle is based on the cooling power provided at low temperature by the dilution of 3He into 4He. The system does not use gravity. Instead, the fluids are forced into room temperature capillaries which, after going through a liquid nitrogen trap, are thermalised by the various shields in the cryostat down to the plate at (pumped lHe) 1.8 K. The two Helium isotopes come from high pressure storage vessels (see Fig 6) through flow controllers. Typical flow rates are 3 moles of 3He per second and 16 moles of 4He per second. The cooling at the low temperature plate is produced by mixing the two isotopes. The available power is small (only few hundred nanoWatts). Therefore the cold plate is mechanically supported by Kevlar cords and shielded electrical wires (for the bolometers) are thermalised on the heat exchanger (capillaries of 200 and 40 diameter). The output mixture flows back through the heat exchanger in a third capillary which is thermally tied to the two input capillaries. The output gas is stored in a low pressure container for later recycling through purification (it will be thrown away in space in case of a satellite version). The dilution fridge was continuously running during the campaign (i.e. for three and a half weeks), keeping the bolometers at the useful temperature of about 0.1 K, except during the main cryostat helium refilling, which required heating-up the cold plate temperature to 4 K. The absolute temperature of the 0.1 K stage is measured with a Matsushita carbon resistance ( at 0.1 K) in a AC low power bridge.

4 Design and calibration of the bolometers
4.1 Design
The bolometers have been developed at IAS, and benefitted from studies in the 40 mK - 150 mK range done for thermal detection of single events due to X–ray or sources (Zhou et al. 1993) or to recoil of dark matter particles (de Bellefon et al. 1996). The design (see Fig 7) is that of a classical composite bolometer with a monolithic sensor as devised by Leblanc et al. (1978). The absorber is made of a diamond window (3.5 mm diameter and 40 microns thickness) with a bismuth resistive coating () to match optical vacuum impedance. The sensors were cut in a selected crystal of NTD Ge to obtain an impedance around at 150 mK (the effective temperature of the bolometers during these observations, because the thermal and atmospheric backgrounds load the bolometers above the 0.1 K cryostat temperature). The whole sensitive system is integrated in an integration sphere coupled to the light cone. Moreover, by using an inclined absorber with a larger diameter than the 2.5 mm diameter of the output of the light cone we finally increase the optical absorption efficiency from 40 to 80%, before residual rays go out of the integration sphere (see Eq. 5). Indeed, the optical efficiency can be estimated with the well–known Gouffe’s formula (Gouffe 1945), by considering that the effective cavity surface is twice the surface of the resistive bismuth coating (which has an emissivity larger than 0.4: Carli et al. 1981). The entrance surface is the 2.5 mm diameter output of the cone. With , the final cavity emissivity is larger than 0.8. An additional internal calibration device (Fig 7 and 3: a near infrared light fed by a diode on the back of the bolometer via an optical fibre) was sucessfully tested but not subsequently used, once the optics was available.

4.2 Calibration
The theory of responsivity and noise from a bolometer has been written by Mather (1984) and Coron (1976). At the equilibrium, the Joule power dissipated in the bolometer, , and the absorbed radiation power, , are balanced by the cooling power due to the small thermal link to the base temperature:
| (1) |
with
| (2) |
where , , and are respectively the cross section,
length and thermal conductivity of the material which makes the
thermal link. We have approximated with a power law,
. From the I-V curves, we find that
for the reference temperature of the value of and
are typically of picoWatts and for both
bolometers. The impedance can be approximated with :
| (3) |
where , and are respectively 200K, 0.80 , and 0.38 for channel 1 and 20K, 52 , and 0.51 for channel 2. The electrical responsivity at zero frequency was deduced from the I-V curves using
| (4) |
where is the dynamic impedance calculated at the bias point on the I-V curve. We find electrical responsivities of the order of and respectively under the sky background conditions (a load of one to few hundred picoWatts). With a noise equivalent voltage of typically above 2 Hz, the electrical NEP is approximately of and for channel 1 and 2 respectively. The response of the bolometer to the optical signal is linked to the electrical response via
| (5) |
where is the optical efficiency. Thus, assuming , the optical NEP (although not measured) at zero frequency could be reliably estimated to be better than and for channel 1 and 2 respectively.
The bolometer also responds to the base plate temperature fluctuations with a responsivity that can be deduced from the previous formalism:
| (6) |
The 2 bolometers that we use have typical sensitivities to the base plate temperature of 0.2 and 1.2 respectively. We see from equation 6 that the larger the conduction to the base plate and the larger the sensitivity of the bolometer to an external signal, the most sensitive will the bolometer be to the fluctuations of the base plate temperature. As the base plate temperature fluctuates by typically over time scales of few seconds, a regulation of this temperature should be made in the near future to minimise fluctuations.
The time constant is less than 10 milliseconds for both bolometers as measured with particles absorbed by the bolometers against a small radioactive source.
4.3 The need for 0.1 K temperature in ground-based experiments
The background is relatively large in the case of ground-based experiments. There is a general prejudice that very low temperatures are thus not needed. Actually, the temperature required for optimised bolometers depends only on the wavelength, because the photon and bolometer noises both increase as the square root of the incoming background. The general formula is (Mather 1984, Griffin 1995, Benoit 1996):
| (7) |
where and is a dimensionless constant. It turns out that for classical bolometers with a resistive thermometer, one has typically , so that the maximum temperature for millimetre continuum astronomy is 0.4 K. Allowing for non ideal effects and bolometers which would be 0.7 less noisy than the background noise, a temperature of 0.1 K is required in the 2 mm cosmological atmospheric window. The ultimate noise equivalent power for a given background and temperature is then
| (8) |
The present bolometers are within a factor 3 of this limit, which is also the photon noise limit, thus leaving some margin for improvements.
5 Readout electronics
The special development made for the readout electronics is described by Gaertner et al. (1997) in detail. Here we give the basic characteristics of the electronics that were specially devised for this instrument. The bolometer is biased with a square AC modulation at typically 61 Hz. The current is injected through a capacitance (in place of the classical load resistance) and an opposition voltage is applied to ensure a near–equilibrium of the bridge (Fig 8).
Hence a small AC modulated out-of-equilibrium signal can be analysed, which is less than of the input voltage. The major advantages of this system are
-
•
a constant power dissipation in the bolometer, which keeps its dynamical impedance constant (the square-wave signal does not perturb the thermal behaviour of the bolometer because it works at a constant input power),
-
•
no additional Johnson noise due to the load (which is capacitive rather than resistive),
-
•
a reduced low-frequency noise from the electronics, due to the modulation with a square function at frequencies above a few tens of Hertz.
A cold FET amplifier (JFET NJ132 at 100 K) is used to have an amplifier noise smaller than the bolometer noise. Shielded wire is used all the way in order to avoid electronic interferences and the cable is soldered throughout to avoid microphonics.
Version 1 of this electronics uses an analog lock-in amplifier with a slow feedback on the bias of the bolometer to force the signal to be zero (with time constant of few seconds). In this way, we measure
-
•
at intermediate frequency (1-10 Hz), the voltage variation of the bolometer at constant current.
-
•
at low frequency (DC below 1 Hz), the absolute power received by the bolometer. As the impedance of the bolometer is fixed by the bridge balance, the bolometer works at constant temperature and the bias power gives us directly the DC radiation input power.

6 First observations
We describe now the observations done in March 1995 during a three and a half week campaign at the Millimetre and Infrared Testa Grigia Observatory (MITO) that gives an 8 arcminute beam with the Diabolo photometer. Here we present some results that were acquired with a sawtooth modulation of the secondary at 1.9 Hz (which provided a constant elevation scan across a source, of typically 26.4 arcmin width), combined with a slow drift of the elevation offset relative to the source (by a total of 40 arcmin, with steps of 4 arcmin i.e. half beam width every 10 seconds). The acquisition frequency of 61 Hz is twice the AC modulation readout frequency. It is synchronous with the wobbling secondary frequency of 1.9 Hz, giving 32 measurement points per period.
To our knowledge, these data are the first ever to be acquired on the sky in a total power mode using unpaired bolometers. It anticipates and proves the feasability of the total power readout mode that is planned for next submillimetre ESA missions (Planck and FIRST).
6.1 The MITO telescope
The MITO telescope has been specifically designed for submillimetre continuum observations at the arcminute scale up to the degree scale, and as such is a unique facility in Europe. The telescope (De Petris et al. 1996), which was designed in parallel with OLIMPO (Osservatorio nel Lontano Infrarosso Montato su Pallone Orientabile) ex TIR (Telescopio InfraRosso) one, is a classical Cassegrain-type 2.6 m dish with a wobbling secondary mirror designed with very low levels of vibration (Mainella et al. 1996). The MITO facility is situated on a dry cold site at an altitude of 3500 m close to Cervinia-Breuil in Italy, very near the Swiss border and the Gornergrat infrared and millimetre observatory TIRGO (Telescopio InfraRosso del GOrnergrat). During our observations, we routinely had outside temperatures of Celsius (most of the nights) and good weather for about one third of the time, making this site excellent for (sub)millimetre high angular resolution astronomy (the opacity is less than a tenth at zenith in the whole millimetre range).
6.2 Data reduction
The data were acquired with two independent acquisition systems, the first one based on the development of the PRONAOS one and the second one custom made to allow for the new readout technique. The following data analysis is based on the last system.
After deglitching, a raw map is made with the values of the signal for given azimuth and elevation offsets. The azimuth offset is deduced from the position in a given period of the secondary while the elevation offset is (or should be) a sawtooth function of time. The registration of the instrument data with the telescope pointing information is done with an absolute time line which happened to be inaccurate after ten minutes of observations. Therefore, we can only show here the data which are post-synchronised with the help of the occurence of a strong source detected in the raw data. The data present a strong systematic effect which is quite reproducible and function of the azimuth offset angle. This is easily removed from the maps by computing the mean effect (over elevation offset angles) after the source has been masked. This effect is most likely due to the instrument “seeing” the asymmetrical back of the secondary during its sawtooth motion. This can and will be reduced by adding a secondary mirror baffle as described in Gervasi et al. (1998).
Another phenomenon is the slow drift of the detectors during time which is removed with a running constant elevation average after the source is masked. Each map is then rotated by the parallactic angle and coadded to the others to make a final map in astronomical coodinates.

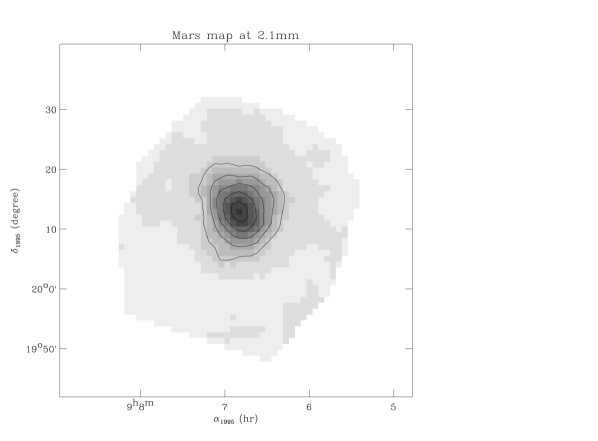
The maps of planet Mars as obtained in the two Diabolo channels, are shown in Fig 9 and 10. It corresponds to the average of 9 individual maps of arcminutes, and a total integration time of 1050 seconds. The beams are quite similar at both wavelengths and coaligned within a precision of a tenth of a beam. The beam FWHM is of 7.5 arcminutes. The integrated beam efficiency is the same as that of an 8 arcminute FWHM Gaussian beam. The signal expected from the planet after dilution in the beam is equivalent to a 110 mK blackbody.
The Orion BN-KL nebula is detected in the raw data and the final maps are given in Fig 11 and 12. It is calibrated with Mars signal, but no correction for differential extinction was applied. As Mars was at a larger elevation at the time of the observations, the fluxes of Orion which are found as and at 1.2 and 2.1 mm should really be considered as a lower limit (especially at 1.2mm). The Orion spectrum, which is dominated by dust emission in the infrared and submillimetre domains, clearly behaves differently at the 2.1 millimetre wavelength, because the flux scales as the frequency to the power 2 between 1.2 and 2.1 mm rather than of 3 to 4 for dust submillimetre emission. Free-free emission from the compact central HII region is most likely at the origin of the 2.1 mm excess.


The atmospheric noise is evident in all the data that were taken. Sensitivities were deduced from blank sky maps as 5, 8 and 7 at respectively 1.2, 2.1 mm and 2.1 mm after atmospheric noise decorrelation.
7 Recent improvements
A number of improvements to the Diabolo instrument have been made since the original design. The changes made to the Diabolo setup are listed below:
-
•
All quartz lenses have been replaced by polyethylene lenses, because the anti–reflection coatings had a tendency to fall off due to the stresses induced by temperature cycles.
-
•
A new 0.1 K cryostat has been designed with a
Joule–Thomson cycle on the mixed Helium output, which produces the 1.8 K stage, hence the main lHe vessel is now at 4 K. The major advantage is that refilling the cryostat with lHe is now faster because the 0.1 K and 1.8 K stays at the same temperature and no lHe pumping is needed any more. The cryogenic duty cycle of the instrument is now of half an hour refill every three days. -
•
One bandpass filter has been removed in channel 2, in order to increase the sensitivity by broadening the band. We have checked that the small leaks that appear at high frequencies have no effect on the detection of the SZ effect.
-
•
New electronics, now fully digitally controlled with a computer interface, have been designed and used for subsequent observations. The new system is described in detail by Gaertner et al. (1997).
-
•
The regulation of the temperature of the thermal bath has been improved. Thermometers attached to the 0.1 K stage provide temperature information, whereas resistances permit to heat up the 0.1 K stage by a feedback system to stabilise the temperature in a closed loop.
-
•
Shock absorbers have been attached to the mount in order to minimize the microphonics induced by telescope motion (as seen by a general increase of the noise at all frequencies).
-
•
Single–bolometer detectors for each channel have been replaced with bolometer arrays of three bolometers in each channel.
Subsequent, upgraded versions have been used at the IRAM 30 m antenna in Spain, and at the POM2 2.5 m telescope (without wobbling secondary mirror) in the French Alps, in the winters 1995 through 1999, yielding in particular, significant detections of the Sunyaev Zel’dovich effect towards several clusters of galaxies (Désert et al. 1998, Pointecouteau et al. 1999). The instrument has been open to the IRAM community since 1998.
Acknowledgements.
We thank Louis d’Hendecourt and M. Gheudin for their help in measuring the transmission of the Diabolo filters at the IAS and DEMIRM. We thank the Programme National de Cosmologie (ex GdR), the INSU and the participating laboratories for their continued support of this experiment. We also thank Pierre Encrenaz and Claudine Laurent for their early support of the project. Part of us (M. de Petris, P. de Bernardis, S. Masi, G. Mainella) have been supported by Italian ASI and MURST. We thank Istituto di CosmoGeofisica (CNR) in Turin for logistic support. Finally, we wish to thank the referee, C.R. Cunningham, for having suggested several significant improvements to the manuscript.References
- (1) Andreani, P., Pizzo, L., Dall’Oglio, G., et al. , 1996, ApJL 459, L49
- (2) Benoit, A. 1996, in Proc. of 3rd Aussois School “Detection de rayonnement à très basse température”
- (3) Benoit, A., Caussignac, M., & Pujol, S., 1994a, Physica B 197, 48
- (4) Benoit, A., Bradshaw, T., Orlowska, A., et al. , 1994b, S.A.E. Technical Papers, 941276
- (5) Benoit, A., & Pujol, S., 1994, Cryogenics 34, 421
- (6) Carli, B., & Iirio–Fili, D., 1981, J. Opt. Soc. Am., 71, 1020
- (7) Chase, S. T., Joseph, R. D., Robertson, N. A., & Ade, P. A. R., 1987, MNRAS 225, 171
- (8) Church, S. E., 1995, MNRAS 272, 551
- (9) Coron, N., 1976, Infrared Physics 16, 411
- (10) de Bellefon, A., et al. , 1996, Astroparticle Physics 6 35-43
- (11) De Petris, M., Aquilini, E., Canonico, M., et al. , 1996, NewA 1, 121
- (12) Désert, F.–X., Benoit, A., Gaertner, S., et al. , 1998, NewA 3, 655
- (13) Gaertner, S., Benoit, A., Lamarre, J.–M., et al. , 1997, A&A Suppl. Ser. 126, 151
- (14) Gear, W., et al. , 1995, in Proc. of Bolometers for millimetre and submillimetre space projects, Eds J. M. Lamarre, J. P. Torre & V. Demuyt, Institut d’Astrophysique Spatiale, Report RS-95-02
- (15) Gervasi M., de Bernardis P., De Petris M., Masi S., & Pisano G., 1998, Appl. Optics. 37, 4277
- (16) Gouffe, A., 1945, Rev. Opt., 24, 1-3
- (17) Griffin, M., 1995, in Proc. of “Bolometers for millimetre and submillimetre space projects”, Eds J. M. Lamarre, J. P. Torre & V. Demuyt, Institut d’Astrophysique Spatiale, Report RS-95-02
- (18) Harper, D. A., Hildebrand, R. H., Stiening, R., & Winston, R., 1976, Appl. Optics 15, 53
- (19) Kreysa, E., 1990, in Proc. 29th Liège International Astrophysical Colloquium “From ground-based to space-borne sub-mm astronomy”, Liège, Belgium, 3-5 July 1990, ESA SP-0314
- (20) Lamarre, J. M., et al. 1994, Infrared Phys. Technol. 35, 277
- (21) Leblanc, J., Dambier, G., Coron, N., Moalic, J.P., US Patent N∘ 4116063, 26 Sept. 1978
- (22) Mainella, G., de Bernardis, P., De Petris, M., et al. , 1996, Appl. Opt. 35, 2246
- (23) Mather, J. C., 1984, Appl. Opt., 23, 584
- (24) Matthews, 1990, in JCMT User’s Manual, UKT14
- (25) Meyer, S. S., Jeffries, A. D., Weiss, R., 1983, ApJL 271, L1
- (26) Melchiorri, B., De Petris, M., D’Andreta, G., et al. , 1996, ApJ 471, 52
- (27) Pardo-Carrion, J. R., 1996, PhD Thesis, Observatoire de Paris.
- (28) Pizzo, L., Andreani, P., Dall’Oglio, G., et al. , 1995, Exp. Astron. 6, 249
- (29) Pointecouteau, E., Giard, M., Benoit, A., et al. 1999, ApJL, 519, L115
- (30) Sirbi, A., Benoit, A., Caussignac, M. & Pujol, S., 1996, Czechoslovak Journal of Physics 46, S5, p 2799 (LT21)
- (31) Smoot, G. F., Bennett, C. L., Kogut, A., 1992, ApJ 396, 1
- (32) Sunyaev, R. A., & Zel’dovich, Ya, B., 1972, Comments Astroph. Space Phys. 4, 173
- (33) Wilbanks, T., Devlin, M., Lange, A. E., Sato, S., Beeman, J. W., & Haller, E. E., 1990, IEEE Transactions on Nuclear Science 37, 566
- (34) J.W. Zhou, P. de Marcillac, N. Coron, et al. , 1993, Nucl. Instr. Meth. in Phys. Res. A335, 443-452