Abstract
We use the ROSAT Deep Cluster Survey (RDCS) with the purpose of tracing the evolution of the cluster abundance out to and constrain cosmological models. We resort to a phenomenological prescription to convert masses into –ray fluxes and apply a maximum–likelihood approach to the RDCS redshift– and luminosity–distribution. As a main result we find that, even changing the shape and the evolution on the – relation within the observational uncertainties, a critical density Universe is always excluded at more than level. By assuming a non–evolving –ray luminosity–temperature relation with shape , it is and ( and ) for flat (open) models, while no significant constraints are found for the power–spectrum shape parameter . Uncertainties are confidence levels for three significant fitting parameters.
The ROSAT Deep Cluster Survey: Constraints on Cosmology
1INFN - Sezione di Trieste, c/o Dipartimento di Astronomia, via Tiepolo
11, I-34131 Trieste, Italy
2INFN - Sezione di Perugia, c/o Dipartimento di Fisica, via A. Pascoli,
I-06121 Perugia, Italy
3European Southern Observatory, D-85748 Garching bei München, Germany
4Osservatorio Astronomico di Brera, via Brera 28, I-20121 Milano, Italy
5Osservatorio Astronomico di Trieste, via Tiepolo 11, I-34131 Trieste, Italy
6Dept. of Physics and Astronomy, The Johns Hopkins University,
Baltimore MD 21218, USA
1 Introduction
The mass function of local () galaxy clusters has been used as a stringent constraint for cosmological models. Independent analyses have shown that –0.6, where is the density parameter, the r.m.s. fluctuation amplitude within a sphere of ( Mpc-1) radius and [6, 7]. The increasing availability of –ray temperatures for distant () clusters is providing a handle to estimate the density parameter which best reproduces the evolution of the cluster abundance [6, 5, 2] (see also Henry, this volume, for a review), A limitation of this approach comes from the small size of the current samples [14].
An alternative way to trace the evolution of the cluster abundance is to rely on the luminosity and redshift distribution of -ray flux–limited cluster samples [13, 3, 10]. The advantage of this approach lies in the availability of large samples, with well understood selection functions. As a limitation, however, one has to face with the uncertain relation between cluster masses and –ray luminosities. The ROSAT Deep Cluster Survey (RDCS) [12] provides a flux–limited complete sample of clusters identified in the ROSAT PSPC archive and including spectroscopically confirmed systems. In the following we will outline the main results of a comparison between the RDCS sample and the predictions of cosmological models. The analysis of RDCS for constraining the evolution of the –ray luminosity function is contained in a separate paper (Rosati et al., this volume).
2 –ray cluster bias: from luminosity to mass
The Press-Schechter approach is used in our analysis, as it provides an accurate mass function in the range of masses probed by the RDCS [3]. The conversion from masses to X-ray luminosities, which is required in analysis of any flux-limited sample is implemented as follows: (a) convert mass into temperature by assuming virialization, hydrostatic equilibrium and isothermal gas distribution; (b) convert temperature into bolometric luminosity according to ; (c) compute the bolometric correction to the 0.5-2.0 keV band.
The critical step is represented by the choice for the – relation. Low redshift data for keV indicates that –3.5, depending on the sample and the data analysis technique [15], with a reduction of the scatter after account for the effect of cooling flows in central cluster regions [1]. At lower temperatures, evidence has been found for a steepening of the – relation below 1 keV [9]. As for the evolution of the – relation, existent data out to [8] and, possibly, out to [4] are consistent with no evolution (i.e., ). Instead of assuming a unique mass–luminosity conversion, in the following we will show how final constraints on cosmological parameters changes as the – and – relations are varied.
3 Analysis and results
The RDCS subsample, that we will use in the following analysis, has a flux–limit of and contains 81 clusters with measured redshifts out to over a 33 sq. deg. area [11]. In order to fully exploit the information provided by the RDCS, we resort to a maximum–likelihood approach, in which model predictions are compared to the RDCS cluster distribution on the plane. To this purpose, let be the Press–Schechter based luminosity function, as predicted by a given model, so that is the expected number density of clusters in the comoving volume element and in the luminosity interval . Therefore, the expected number of clusters in RDCS lying in the element of the plane is . Here is the flux–dependent RDCS sky–coverage.
The likelihood function is defined as the product of the probabilities of observing exactly one cluster in at each of the positions occupied by the RDCS clusters, and of the probabilities of observing zero clusters in all the other differential elements of the plane which are accessible to RDCS. Assuming Poisson statistics for such probabilities and defining , it is , where the sum runs over the occupied elements of the plane. Model predictions are also convolved with statistical errors on measured fluxes, as well as with uncertainties in the luminosity–mass relation associated to a scatter in the – relation and to a uncertainty in the mass–temperature conversion. Best estimates of the model parameters are obtained by minimizing .
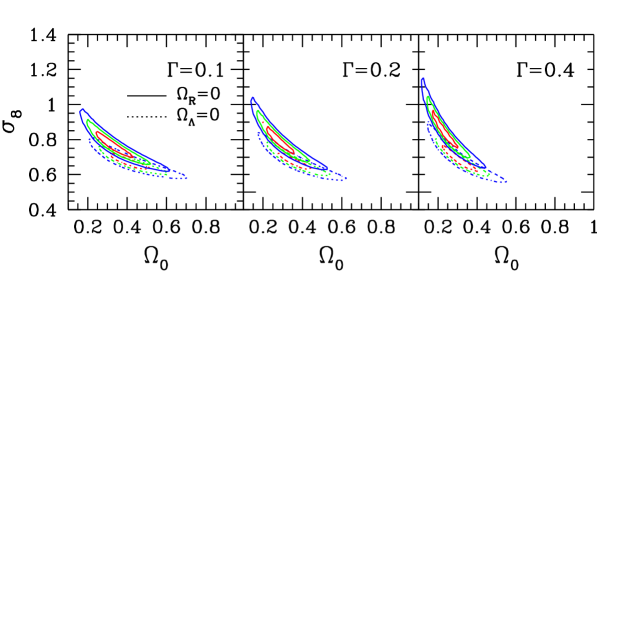
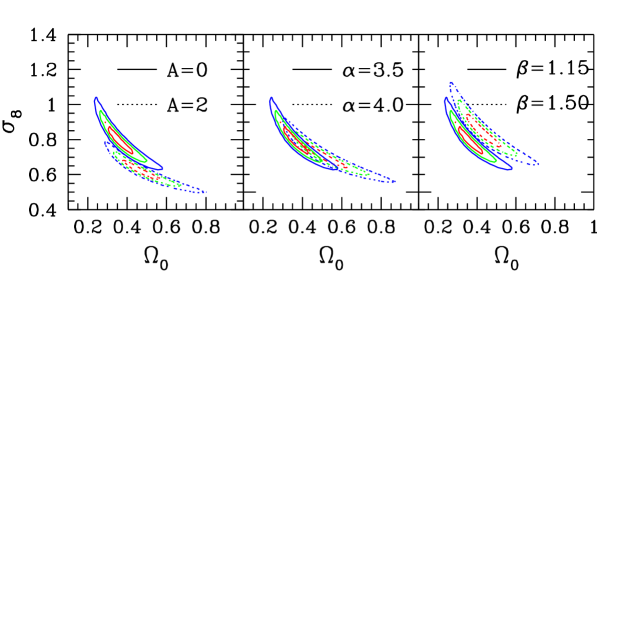
In Figure 1 we show the resulting constraints on the – plane for different values of the shape parameter , based on assuming and for the – relation. It is clear that low–density models are always preferred, quite independent of . We find and ( and ) for flat (open) models, where uncertainties correspond to confidence level for three significant fitting parameter. No significant constraints are instead found for . In order to verify under which circumstances a critical density model may still be viable, we show in Figure 2 the effect of changing the parameters of the – relation. Although best–fitting values of and move somewhat on the parameter space, neither a rather strong evolution nor a quite steep profile for the – relation can accommodate a critical density Universe: an Universe is always a event, even allowing for values of the and parameters which are strongly disfavored by present data.
Based on these results, we point out that deep flux–limited –ray cluster samples, like RDCS, which cover a large redshift baseline () and include a fairly large number of clusters () do indeed place significant constraints on cosmological models. To this aim, some knowledge of the – evolution is needed from a (not necessarily complete) sample of distant clusters out to .
References
- [1] Arnaud, K.A., & Evrard, A.E. 1999, MNRAS, 305, 631
- [2] Bahcall, N.A., & Fan, X. 1998, ApJ, 504, 1
- [3] Borgani, S., Rosati, P., Tozzi, P., & Norman, C. 1999, ApJ, 517, 40
- [4] Della Ceca, R., et al. 1999, A&A, in press, astro-ph/9910489
- [5] Donahue, M., & Voit, G.M. 1999, ApJ, 523, L127
- [6] Eke, V.R., Cole, S., Frenk, C.S., & Henry, J.P. 1998, MNRAS, 298, 114
- [7] Girardi, M., et al. 1998, ApJ, 506, 45
- [8] Mushotzky, R.F., & Scharf, C.A. 1997, ApJ, 482, L13
- [9] Ponman, T.J., et al. 1996, MNRAS, 283, 690
- [10] Reichart, D.E., et al. 1998, ApJ, 518, 521
- [11] Rosati, P. 1998, in Wide Field Surveys in Cosmology, 14th IAP Meeting (Paris, Publ.: Editions Frontieres) p.219
- [12] Rosati, P., et al. 1998, ApJ, 492, L21
- [13] Sadat, R., Blanchard, A., & Oukbir, J. 1998, A&A, 329, 21
- [14] Viana, P.T.P., & Liddle, A.R. 1999, MNRAS, 303, 535
- [15] White, D.A., Jones, C., & Forman, W. 1997, MNRAS, 292, 419