Infrared Spectroscopy of a Massive Obscured Star Cluster in the Antennae Galaxies (NGC 4038/4039) with NIRSPEC
Abstract
We present infrared spectroscopy of the Antennae Galaxies (NGC 4038/4039) with NIRSPEC at the W. M. Keck Observatory. We imaged the star clusters in the vicinity of the southern nucleus (NGC 4039) in seeing in K-band using NIRSPEC’s slit-viewing camera. The brightest star cluster revealed in the near-IR (M) is insignificant optically, but coincident with the highest surface brightness peak in the mid-IR (m) ISO image presented by [*]mirabel98. We obtained high signal-to-noise 2.032.45 m spectra of the nucleus and the obscured star cluster at R .
The cluster is very young (age Myr), massive (M M⊙), and compact (density M⊙ pc-3 within a 32 pc half-light radius), assuming a Salpeter IMF (0.1100 M⊙). Its hot stars have a radiation field characterized by T K, and they ionize a compact H ii region with n cm-3. The stars are deeply embedded in gas and dust (A mag), and their strong FUV field powers a clumpy photodissociation region with densities n cm-3 on scales of pc, radiating L L⊙.
keywords:
Galaxies: individual (NGC4038/39, Antennae Galaxies) – Galaxies: star clusters – Galaxies: H ii regions1 Introduction
The Antennae (NGC 4038/4039) are a pair of disk galaxies in an early stage of merging which contain numerous massive super star clusters (SSCs) along their spiral arms and around their interaction region ([\astronciteWhitmore & Schweizer1995, \astronciteWhitmore et al.1999]). The molecular gas distribution peaks at both nuclei and in the overlap region ([\astronciteStanford et al.1990]), but the gas is not yet undergoing a global starburst typical of more advanced mergers ([\astronciteNikola et al.1998]). Star formation in starbursts appears to occur preferentially in SSCs. We chose to observe the Antennae because their proximity permits an unusually detailed view of the first generation of merger-induced SSCs and their influence on the surrounding interstellar medium.
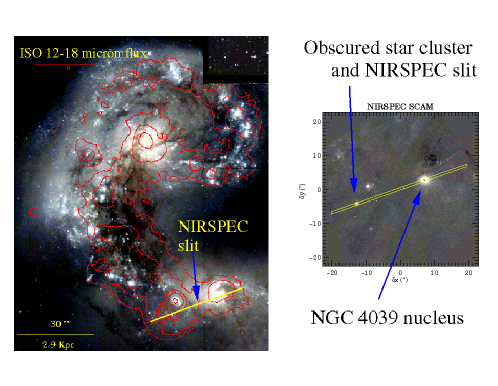
The Infrared Space Observatory (ISO) m image showed that the hot dust distribution is similar to that of the gas, but peaks at an otherwise inconspicuous point on the southern edge of the overlap region ([\astronciteMirabel et al.1998]; see [\astronciteWilson2000]). This powerful starburst knot is also a flat-spectrum radio continuum source ([\astronciteHummel & van der Hulst1986]) and may be associated with an X-ray source ([\astronciteFabbiano et al.1997]). We imaged the region around this knot, and discovered a bright compact star cluster coincident with the mid-IR peak. We obtained moderate-resolution (R ) K-band spectra of both the obscured cluster and the NGC 4039 nucleus.
2 Observations & Data Reduction
NIRSPEC is a new facility infrared (m) spectrometer for the Keck-II telescope, commissioned during April through July, 1999 ([\astronciteMcLean et al.1998]). It has a cross-dispersed cryogenic echelle with R , and a low resolution mode with R . The spectrometer detector is a 1024 1024 InSb ALADDIN focal plane array, and the IR slit-viewing camera detector is a 256 256 HgCdTe PICNIC array.
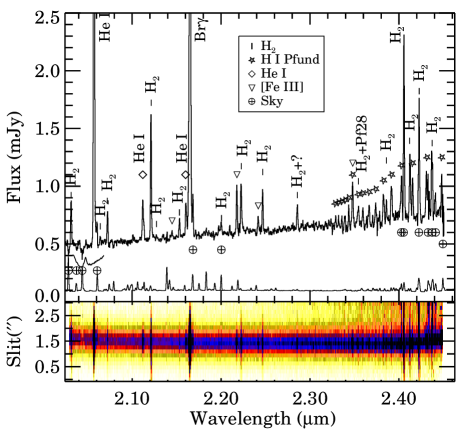
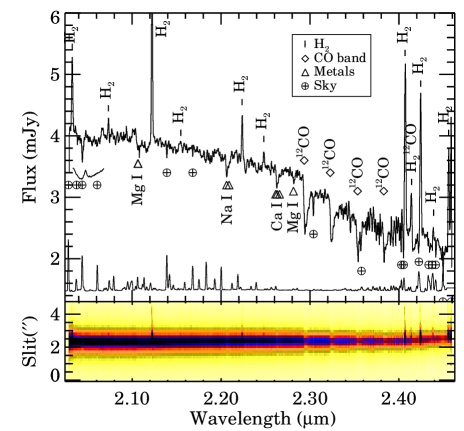
We observed the Antennae with NIRSPEC during the June 1999 commissioning run. Figure 1 shows the HST and ISO image of [*]mirabel98 together with NIRSPEC slit-viewing camera (SCAM) images at 2 m; the SCAM images reveal that the mid-IR ISO peak is a bright (K ) compact star cluster located 20′′.4 east and 4′′.7 north of the K-band nucleus. This cluster is associated with a faint (V ) red (VI ) source (# 80 in [\astronciteWhitmore & Schweizer1995]) visible with Space Telescope (Whitmore & Zhang, private communication). We obtained low resolution (R ) m spectra through a slit at PA=77o located on the obscured star cluster and the nucleus of NGC 4039, for a total integration time of 2100 s. We reduced the data following the standard procedure, described in more detail by [*]gilbert00. Reduced spectra are shown in Figures 2 and 3.
3 Massive Star Cluster
The cluster spectrum is characterized by strong emission lines111A table of measured line fluxes is available electronically from http://astro.berkeley.edu/agilbert/antennae. and a continuum (detected with SNR ) dominated by the light of hot, blue stars and dust. The nebular emission lines are slightly more extended than the continuum, and the H2 emission is even more extended. This suggests a picture in which hot stars and dust are embedded in a giant compact H ii region surrounded by clumpy (see §3.2) clouds of obscuring gas and dust whose surfaces are ionized and photodissociated by FUV photons escaping from the star cluster.
For a distance to the Antennae of 19 Mpc (H0=75 km s-1 Mpc-1, 1′′= 93 pc) ([\astronciteWhitmore et al.1999]), we find that the cluster has M. We estimate the screen extinction to the cluster by assuming a range of (VK) as expected from Starburst99 models ([\astronciteLeitherer et al.1999]), and that A AV ([\astronciteRieke & Lebofsky1985]). We find A mag, which implies M, adopting A (which is confirmed by our analysis of the H ii recombination lines in §3.1). We can use the intrinsic brightness along with the Lyman continuum flux inferred from the de-reddened Br flux ( erg s-1 cm-2), Q(H photons s-1, to constrain the cluster mass and age. Using instantaneous Starburst99 models we find a total mass of M⊙ (with O stars) for a Salpeter IMF extending from 1 to 100 M⊙, and an age of Myr. This age is consistent with the lack of photospheric CO and metal absorption lines from red supergiants and other cool giants, which would begin to contribute significantly to the 2 m light at an age of Myr ([\astronciteLeitherer et al.1999]). The cluster’s density is then about 115 M⊙ pc-3 for stars of 0.1100 M⊙ within a half-light radius of pc. This density is 30 times less than that of the LMC SSC, R136 (within a radius of 1.7 pc, assuming a Salpeter proportion of low-mass stars) ([\astronciteHunter et al.1995]). Thus the Antennae cluster may be a complex of clusters rather than one massive cluster.
3.1 Nebular Emission
The cluster spectrum features a variety of nebular lines that reveal information about the conditions in and around the gas ionized gas by the cluster, which in turn allows us to constrain the effective temperature of the ionizing stars.
We detected H i Pfund series lines from Pf 19 to Pf 38, which allow us to infer the extinction across the K window. We display the Pfund fluxes relative to that of Br in Figure 4, where filled symbols give fluxes for the blends Pf 28+H2 21 S(0) and Pf 29+[Fe iii]. They fall well above the other points, which follow closely the theoretical expectation for intensities relative to Br (solid curve) with no reddening applied, for a gas with n cm-3 and T K ([\astronciteHummer & Storey1987]). Excluding the two known blends, the best-fit foreground screen extinction is A mag (dashed curve), assuming the extinction law of [*]landini84 and evaluated at 2.2 m. We consider this an upper limit on AK because a close look at the spectrum shows that the points above the dashed line in Figure 4 for Pf 2224 at 2.404, 2.393, and 2.383 m may also be blended or contaminated by sky emission, implying a lower AK and a much better fit to the theory. Hence the majority of the extinction to the cluster is bypassed by observing it in K band.
The ratios of [Fe iii] 2.146 m and 2.243 m lines to [Fe iii] 2.218 m are nebular density diagnostics, consistent with a fairly high density, n cm-3. (See [*]gilbert00 for more detail.) The He i line ratios can be used to infer nebular temperature Te, and are fairly insensitive to ne. We find the ratio He i 2.1128+2.1137 m/He i 2.0589 m = 0.052 0.003, which for ne=104 cm-3 is consistent with T K ([\astronciteBenjamin et al.1999]). However this is much hotter than typical nebular temperatures, and may indicate some non-nebular contribution from hot stars to the line emission.

The He i 2.0589 m/Br ratio is an indicator of the Teff of hot stars in H ii regions ([\astronciteDoyon et al.1992]), although it is sensitive to nebular conditions such as the relative volumes and ionization fractions of He+ and H+, geometry, density, dustiness, etc. ([\astronciteShields1993]). [*]doherty95 studied H and He excitation in a sample of starburst galaxies and H ii regions. For starbursts they found evidence for high-Teff, low-ne ( cm-2) ionized gas from He i 2.0589 m/Br ratios of 0.22 to 0.64. The ultra-compact H ii regions were characterized by higher ratios (0.80.9) and higher densities, 104 cm-3. The cluster has a flux ratio of 0.70, a value between the two object classes of [*]doherty95. Assuming the line emission is purely nebular, this ratio is consistent with a high-density (104 cm-3) model of [*]shields93 (also indicated by the [Fe iii] emission), and implies T K for the assumed model parameters.
The cluster has properties more like those of a compact H ii region than a diffuse one. It appears to be a young, hot, high-density H ii region, one of the first to form in this part of the Antennae interaction region.
3.2 Molecular Emission
The spectrum shows evidence for almost pure UV fluorescence excited by FUV radiation from the O & B stars; the strong, vibrationally excited 10, 21 & 32 H2 emission has T K and T, 1600, and 1800 K, respectively, and weak higher-v (64, 86, 97) transitions are present as well. The H2 lines are extended over pc, about twice the extent of the continuum and nebular line emission, so a significant fraction of the FUV (9121108 Å) light escapes from the cluster to heat and photodissociate the local molecular ISM.
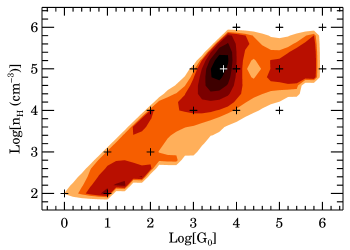
We compared the photodissociation region (PDR) models of [*]draine96 with our data by calculating reduced . Models with high densities (n cm-3), moderately warm temperatures (T to 1500 K at the cloud surface), and high FUV fields (G times the mean interstellar field) can reasonably fit the data. Figure 5 shows contours for all models projected onto the nG0 plane. The best-fit Draine & Bertoldi model is n2023b, which has nH = 105 cm-3, T = 900 K, and G. We fit 22 H2 lines, excluding 32 S(2) 2.287 m because it appears to be blended with a strong unidentified nebular line at 2.286 m found in higher-resolution spectra of planetary nebulae ([\astronciteSmith et al.1981]). The weak high-v transitions are all under-predicted by this model, and appear to come from lower-density gas (n cm-3) exposed to a weaker FUV field (G).
The ortho/para ratio of excited H2 determined from the relative column densities inferred from 10 S(1) and S(0) lines is 1.620.07. This is consistent with the ground state v=0 H2 being in LTE with ortho/para ratio of 3 if the FUV absorption lines populating the non-LTE excited states are optically thick ([\astronciteSternberg & Neufeld1999]). Indeed, the best-fit PDR models have temperatures that are comparable with Trot in the lowest excited states.
If the extent of the H2 emission indicates that the mean-free path of a FUV photon is pc, then n = 3 cm-3 for a Galactic gas-to-dust ratio, while in the PDR(s) nH = 10 cm-3. This implies that the molecular gas is extremely clumpy, which is consistent with the range of densities inferred from the detection of anomalously strong v = 86 H2 emission.
4 Conclusions
The highest surface brightness mid-IR peak in the ISO map of the Antennae Galaxies is a massive (106 M⊙), obscured (A), young (age Myr) star cluster with half-light radius 32 pc, whose strong FUV flux excites the surrounding molecular ISM on scales of up to 200 pc. The cluster spectrum is dominated by extended fluorescently excited H2 emission from clumpy PDRs and nebular emission from compact H ii regions. In contrast, the nearby nucleus of NGC 4039 has a strong stellar spectrum dominated by cool stars, where the only emission lines are due to shock-excited H2. These observations confirm the potential of near-infrared spectroscopy for exploration and discovery with the new generation of large ground-based telescopes. Our ongoing program of NIRSPEC observations promises to reveal a wealth of information on the nature of star formation in star clusters.
Acknowledgements.
We acknowledge the hard work of past and present members of the UCLA NIRSPEC team: M. Angliongto, O. Bendiksen, G. Brims, L. Buchholz, J. Canfield, K. Chin, J. Hare, F. Lacayanga, S. Larson, T. Liu, N. Magnone, G. Skulason, M. Spencer, J. Weiss and W. Wong. We thank Keck Director Chaffee and all the CARA staff involved in the commissioning and integration of NIRSPEC, particularly instrument specialist T. Bida. We especially thank Observing Assistants J. Aycock, G. Puniwai, C. Sorenson, R. Quick and W. Wack for their support. We also thank A. Sternberg for valuable discussions. We are grateful to R. Benjamin for providing us with He i emissivity data. AMG acknowledges support from a NASA GSRP grant.References
- [\astronciteBenjamin et al.1999] Benjamin, R.A., Skillman, E.D., Smits, D.P., 1999, ApJ, 514, 307
- [\astronciteDoherty et al.1995] Doherty, R.M., Puxley, P.J., Lumsden, S.L. et al. 1995, MNRAS, 277, 577
- [\astronciteDoyon et al.1992] Doyon, R., Puxley, P.J., Joseph, R.D., 1992, ApJ, 397, 117
- [\astronciteDraine & Bertoldi1996] Draine, B. T., Bertoldi, F., 1996, ApJ, 468, 269
- [\astronciteFabbiano et al.1997] Fabbiano, G., Schweizer, F., Mackie, G., 1997, ApJ, 478, 542
- [\astronciteGilbert et al.2000] Gilbert, A.M., Graham, J.R., McLean, I. S. et al. 2000, to appear in ApJL
- [\astronciteHummel & van der Hulst1986] Hummel, E., van der Hulst, J.M., 1986, A&A, 155, 151
- [\astronciteHummer & Storey1987] Hummer, D.G., Storey, P.J., 1987, MNRAS, 224, 801
- [\astronciteHunter et al.1995] Hunter, D.A., Shaya, E.J., Holtzman, J.A. et al. 1995, ApJ, 448, 179
- [\astronciteLandini et al.1984] Landini, M., Natta, A., Salinari, P. et al. 1984, A&A, 134, 284
- [\astronciteLeitherer et al.1999] Leitherer, C., Schaerer, D., Goldader, J.D. et al. 1999, ApJS, 123, 3
- [\astronciteMcLean et al.1998] McLean, I.S., Becklin, E.E., Bendiksen, O. et al. 1998, Proc. SPIE, 3354, 566
- [\astronciteMirabel et al.1998] Mirabel, I.F., Vigroux, L., Charmandaris, V. et al. 1998, A&A, 333, L1
- [\astronciteNikola et al.1998] Nikola, T., Genzel, R., Herrmann, F. et al. 1998, ApJ, 504, 749
- [\astronciteRieke & Lebofsky1985] Rieke, G.H., Lebofsky, M.J., 1985, ApJ, 288, 618
- [\astronciteShields1993] Shields, J.C., 1993, ApJ, 419, 181
- [\astronciteSmith et al.1981] Smith, H.A., Larson, H.P., Fink, U., 1981, ApJ, 244, 835
- [\astronciteStanford et al.1990] Stanford, S.A., Sargent, A.I., Sanders, D.B. et al. 1990, ApJ, 349, 492
- [\astronciteSternberg & Neufeld1999] Sternberg, A., Neufeld, D. A., 1999, ApJ, 516, 371
- [\astronciteWhitmore & Schweizer1995] Whitmore, B.C., Schweizer, F., 1995, AJ, 109, 960
- [\astronciteWhitmore et al.1999] Whitmore, B.C., Zhang, Q., Leitherer, C. et al. 1999, AJ
- [\astronciteWilson2000] Wilson, C., 2000, these proceedings