On the influence of resonant absorption on the iron emission line profiles from accreting black holes
Abstract
The fluorescent iron K emission line profile provides an excellent probe of the innermost regions of active galactic nuclei. Fe XXV and Fe XXVI in diffuse plasma above the accretion disc can affect the X-ray spectrum by iron K resonant absorption. This in turn can influence the interpretation of the data and the estimation of the accretion disc and black hole parameters. We embark on a fully relativistic computation of this effect and calculate the iron line profile in the framework of a specific model in which rotating, highly ionized and resonantly-absorbing plasma occurs close to the black hole. This can explain the features seen in the iron K line profile recently obtained by Nandra et al. (1999) for the Seyfert 1 galaxy NGC 3516. We show that the redshift of this feature can be mainly gravitational in origin and accounted for without the need to invoke fast accretion of matter onto the black hole. New X-ray satellites such as XMM, ASTRO-E and Chandra provide excellent opportunities to test the model against high quality observational data.
keywords:
accretion, accretion discs - black hole physics - galaxies: active - galaxies: Seyfert - X-rays: galaxies, line: formation - galaxies1 Introduction
The fluorescent K iron emission
line has been observed in many active galactic nuclei and shown to possess
a broad and redshifted profile (Fabian et. al 1994, Mushotzky et al. 1995,
Tanaka et al. 1995,
Reynolds 1997, Nandra et. al 1997). It has been demonstrated,
for example,
in the best studied case of the Seyfert 1 galaxy MCG-6-30-15, that the strong
continuum variability is accompanied by changes in
the iron line itself (Iwasawa et al. 1996, Lee et al. 1999).
These results show that the
fluorescent Fe K line originates from the very central parts of the
accretion disc close to the black hole, giving a
natural explanation for both the rapid variability and the
strong redshift detected in these objects. This opens a unique opportunity
constrain the spin of the black hole,
its mass and the structure of the accretion disc.
Recently Nandra et. al (1999)
reported on a long ASCA observation of the Seyfert 1 galaxy NGC 3516. Their
integrated iron line profile contains a factor of times more photons
than that of MCG-6-30-15 and therefore at the present time
provides an excellent
opportunity to study the central parts of an active nucleus.
Nandra et al. (1999) found tentative evidence for a redshifted
absorption feature superimposed on the emission line profile.
They interpret it as being consistent with
resonant scattering in infalling material.
Motivated by such an interesting possibility,
we embark on theoretical modelling of a similar effect.
The crucial ingredient of our model is a strong gravitational field and
therefore we fully account for all relevant general relativistic effects.
We assume that the black hole and the central parts of the accretion disc
are embedded in a cloud of hot, rapidly rotating and highly ionized
plasma in which iron is not totally stripped of all electrons.
Hydrogen and helium-like iron ions are then capable of
producing significant absorption and thus of changing the shape of the
disc emission line profile.
If confirmed by further observations, this effect would suggest that
future high quality data should be analyzed with
the possibility of resonant absorption in mind,
as the presence of
optically-thin material surrounding the central region of an AGN could
modify the emission line profile and therefore affect the interpretation
of such data.
The presence of the absorption features can also
shed new light on the properties of the accretion flow near black holes,
as the position of the gravitationally redshifted absorption line
will additionally depend on the velocity pattern close to the black hole.
The paper is organized as follows: the next section contains the
description of our approach to calculate the absorption features.
Section 3 is devoted to the general
presentation and discussion of our results and also contains
a discussion of the iron line shape
in the context of the recently obtained iron line profiles of NGC 3516
by Nandra et. al (1999).
2 Description of the method and basic assumptions
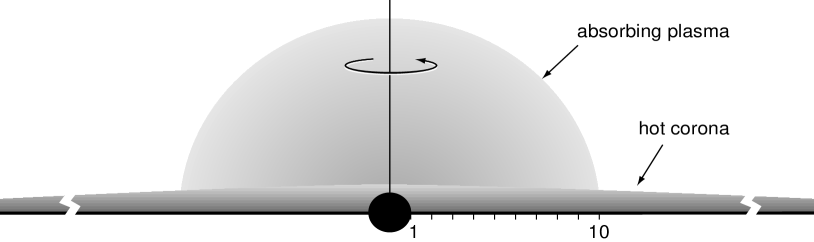
We assume that the accretion disc is optically thick and geometrically thin and that the primary source of X-ray radiation is a hot and optically thin corona located just above the accretion disc. The central black hole and the accretion disc with the corona are embedded in a cooler (K), extended cloud of plasma (see Fig. 1).
The primary power law flux is incident on the disc and produces fluorescent photons. The fluorescent line and continuum photons then pass through and may interact with such plasma. Under such conditions a significant fraction of iron ions are in the hydrogen (Fe XXVI) and helium-like (Fe XXV) states. These ions can resonantly absorb the fluorescent line and continuum photons emerging from the accretion disc and corona. The permitted transitions of interest are of H-like iron keV) and of He-like iron keV) with the large oscillator strengths equal 0.416 for H-like and 0.794 for He-like (Kato 1976). This means that absorption lines can potentially change the shape of the observed broad iron line profile which is generated in the accretion disc with the rest energy keV.
2.1 The optical depth
We now proceed to describe the calculation method for the optical depth of resonant absorption. We first estimate the characteristic distance over which the energy of a photon, as seen by an observer who is at rest with the hot plasma, changes by the Doppler thermal width , where is a mass of a proton, stands for the ion mass number and is the frequency of the absorption line. We use the equation (Novikov & Thorne, 1973):
| (1) |
where is the proper length as measured in the local rest frame of the plasma flow. This frame-independent equation is derived easily by geometrical arguments in the locally non-rotating frame. In the above equation is the 4-momentum of a photon, is the 4-velocity of the absorbing medium and is the rest frequency of the absorption line. We choose the velocity field to be of the form:
| (2) |
where
| (3) |
and is the angular velocity of the absorbing medium as seen at infinity. Note that the choice of cannot be arbitrary and certainly the angular velocity must be constrained by the causality condition: . For example, note that the assumption of constant specific angular momentum on spheres of fixed r in Boyer-Lindquist coordinates (Kurpiewski & Jaroszyński 1999) violates this condition. Therefore, in our simulations we adopt the following definition of :
| (4) |
where is the poloidal Boyer-Lindquist coordinate, is the Keplerian angular velocity and is the angular velocity of the gravitational drag, i.e. we assume that the hot plasma follows the velocity of the disc close to its surface and gradually changes its angular velocity to reach the value on the polar axis (note that at the black hole horizon radius for all ). From Eq. 1 we get:
| (5) |
It has been checked numerically that for the overwhelming majority of trajecories connecting the accretion disc and the observer (for different inclinations of the disc) , where is a characteristic length scale over which the density remains roughly constant. However in our calculations we assume that the cloud has a uniform density distribution in the local rest frame within a given radius (i.e. ). In the real situation, the absorption feature is likely to be variable (as indeed observed by Nandra et al. 1999) and the density distribution may correspond to an unstable configuration with a clumpy structure. Since we only intend to show what the temporal shape of the line might be, we argue that at the present stage it is not necessary to consider a more sophisticated density distribution corresponding to a stable configuration. The above constraints on ensure that we may use the Sobolev approximation to describe the resonant absorption in the plasma, i.e. we may assume that the absorption occurs locally and that the medium is transparent for most of the trajectory of a photon with a given emission energy. Thus in the further analysis we model the absorption line as a Dirac delta function. The optical depth per absorption event is then given by the formula (compare with Castor 1970, Shu 1991):
| (6) |
where is the rest energy of the absorption line, is the abundance of iron (the solar abundance of iron is , Morrison & McCammon 1983), is the fraction of ions in the H-like or He-like state, is the absorption oscillator strength and is the parameter related to the column density. We checked that although for some photon trajectories, energies and adopted values of , the optical depth for resonant absorption may exceed unity, the depth of the observed continuum absorption feature varies almost linearly with (for different inclinations of the disc) implying that we are effectively dealing with optically-thin resonant absorption.
2.2 The iron line profile
2.2.1 The absorption of the continuum and the emission line
The overall iron line profile was calculated in two steps. In the first step we calculated the shape of the partially absorbed fluorescent emission line generated in the disc and, superimposed on it, the resonant absorption feature due to the continuum absorbed by the the hot cloud surrounding the disc. We assumed that the continuum was generated in the corona located just above the accretion disc. We used the ray back-tracing method and searched for the absorption regions corresponding to all energies of the continuum photons and the fluorescent line photons and calculated the optical depth as a function of energy for each photon trajectory. We then accumulated the optical depths when multiple absorption points occurred for the same energy. The line energy flux relative to the continuum for a given pixel element on the observer’s image plane was calculated from the following formula:
| (7) |
where and otherwise, is the equivalent width of the disc emission line from the disc element as seen face on in the local rest frame, is the total redshift factor, is the angle between the direction perpendicular to the disc and the direction of emitted photons as measured by the comoving observer and the last factor represents the solid angle subtended by the pixel on the observer’s image plane. The continuum intensity in the above equation is given by , where is the total X-ray emissivity of the corona at the distance from the centre. The second component in the above equation describes absorption of the continuum photons, whereas the first corresponds to the absorption of the disc emission line measured relative to the continuum. The factor accounts for the isotropy of radiation from the corona which was assumed to be optically thin.
2.2.2 Correction for spontaneous emission following absorption
Resonant absorption is a scattering process and therefore in our case is followed by de-excitation of the iron ions rather than destruction of photons. This effect will of course partially cancel the absorption features. The importance of this effect may be estimated for the case of a point-like source in the geometrical centre of the disc. Such estimation may be reasonable if the emissivity index of the disc is steep. However at this stage we need this assumption only to estimate the order of magnitude of this effect. In such a situation the emission line flux is given by (see Matt 1994):
| (8) |
where is the absorbed flux and is the probability
that the absorption is followed by a
spontaneous emission rather than
autoionization (where appropriate) and thus destruction of the photon.
This probability can be approximated as the fluorescent
yield of the previous ion (Band et al. 1990) and equals 1 in the case
of H and He-like iron ions.
Taking into account the assumed geometry of the system,
(if the disc is cold), the reemitted flux may be as large as
. Therefore in the subsequent calculations we
took into account this effect and considered
a fully relativistic treatment of this contribution to the overall
line profile. Note that the magnitude of this correction
may be overestimated in the Newtonian approximation. This is because
in the real situation spontaneous emission from
ions is Doppler boosted in the
direction almost perpendicular to the line-of-sight (for low inclinations
of the accretion disc relative to the observer) and the photons
are preferentially radiated towards the accretion disc because
of the light bending. Note that the above estimate is
an upper limit also because the reabsorption of the line has been neglected.
We separately included the contribution to
the iron line from
spontaneous emission following absorption
by taking into account
the photons from the disc and the corona which were initially
radiated in some other direction than that to the observer
and later re-emitted into the line-of-sight. This was done by forward
integrating the isotropic distribution of a large number of
continuum and line photons from the whole corona located just
above the disc and the whole disc respectively.
For each trajectory and initial rest energy we localized the absorption
regions and accumulated the absorbed luminosity
in a large number of zones within the cloud. We assumed that either
photons left the cloud without scattering or were scattered
only once, i.e. we neglected the reabsorption of the line photons.
This is a good approximation if the plasma is optically
thin in the line.
Note also that spontaneous emission which follows absorption produces photons
at the energy of resonant transition and such photons are less likely to be
further resonantly absorbed because of large energy shifts as seen by the local
observers in the plasma. In other words, observers at some region in the
absorbing plasma may see the re-emitted photons from other parts of the cloud
at energies different from this of resonant transition and therefore such
photons will not be reabsorbed.
The total intercepted luminosity in any given zone within the cloud
was calculated
from (see also Ruszkowski 1999):
| (9) |
where the summation is over all photon trajectories and emission energies, is the total number of trajectories and is the surface area of an element of the corona as measured by the corotating observer:
| (10) |
where and are the Lorentz factor and the azimuthal component of the velocity of the relative motion of the corona and the locally non-rotating observer. The remaining symbols have their usual meaning in the Kerr metric. The factor in Eq. 9 is:
| (11) |
where m is the number of an absorption region for a given trajectory and emission energy and
| (12) |
The emission from the zones in the ionized cloud was then treated separately and each zone served as a source of line radiation. We calculated the observed flux by following a bundle of photons from a particular position within the cloud and computing the distortions of the solid angle subtended by the surface element on the observer’s image plane as measured in the frame of reference of the emitter moving with the plasma flow. We used a formula similar to (4), i.e. :
| (13) |
where the derivative was calculated at a fixed inclination of the disc relative to the observer.
In order to obtain the overall line profile we added the fluxes calculated from Eq. 7 and Eq. 13. We also computed the observed equivalent widths of the lines by integrating the obtained profiles divided by the observed continuum.
3 Results and Discussion
The examples of the computed iron line profiles for the parameters similar to that obtained by Nandra et al. (1999) for NGC 3516 are shown in Fig. 2 and Fig. 3.


(Note that the exact values of the observed
line equivalent widths are not known
because the iron line in NGC 3516 varies on short time scales and only
time averaged equivalent width is reported in Nandra et al. 1999.)
The thick red line denotes the total iron line
profile (photon flux vs. energy).
The shape of the line on Fig. 2 may provide an acceptable fit
to the temporal profile obtained by Nandra et al. (1999)
(compare with the inset in
their Fig. 1). It peaks around 6.2 keV, has a long redshifted tail
and possesses the redshifted absorption feature below 6.0 keV.
As can be seen on Fig. 2, the observed redshift of the absorption
feature can be mostly accounted for by the
the strong gravitational redshift alone.
This has to be contrasted with the main interpretation originally given by
Nandra et al. (1999), who suggest that the redshift of the resonant
absorption feature may be due to the scattering of radiation by matter
infalling onto the black hole.
Such matter would have to infall along the black hole rotation axis
in order to efficiently absorb radiation from the central parts of the disc.
Thus their interpretation implicitly implies accretion with low angular
momentum which is less likely. Therefore our results suggest that the
current observational data do not necessarily give the first
direct evidence for the accretion of matter in AGNs.
The other profiles seen on the Fig. 2 and Fig. 3 correspond to different
contributions to the total line profile, namely:
disc fluorescent emission (thin solid line), resonant absorption of the
continuum
(dashed line) and correction for spontaneous emission from ions which
follows absorption (dotted line).
The dash-dotted line shows the disc line absorbed by resonant
and photoelectric absorption (a small iron absorption edge created
in the cloud is visible around 8 keV).
Note that there is no intrinsic resonant absorption of the
fluorescent disc emission line and only the continuum radiation is resonantly
absorbed. This is the result of the low inclination of the disc. Emission line
photons with rest energies at 6.4 keV leave the disc and continually
move towards
increasing gravitational potential and therefore their locally observed
energies gradually decrease and can never exceed the rest energy of the
resonant absorption line at 6.7 keV. Note also that the observed equivalent
width of the emission line (for the unabsorbed
line) is smaller than the
equivalent width
measured face on in the local rest frame because
of the gravitational redshift and the light bending which leads to the
central parts of the disc being effectively
observed at large angle even though the disc is seen at low inclination.
The characteristic skewed shape of the profile of
resonant absorption of the continuum
is the result of the systematic effect of the gravitational redshift which
creates the long redshifted tail and also due to variations of the
Sobolev length across the disc as seen by the observer. The coherence length
is larger for the photons on the approaching side of the disc and smaller
on the opposite side because the cloud on the receding side
has a velocity component directed away from the observer
so the photons and plasma travel locally in opposite directions.
Fig. 2 and Fig. 3 also show the contribution to the
line from
spontaneous emission following absorption.
As expected, the profile of this line
has a shape similar to that of the fluorescent disc line.
The line photons emitted by the cloud
which impinge on the cold disc are thermalized and do not contribute to
the final iron line profile.
It has to be stressed that, in modelling NGC 3516, we assumed that the
accretion disc was cold. The large observed equivalent widths of the order of
500 eV may suggest an ionized disc,
however a cold disc with an overabundance of
iron and underabundance of other elements may still produce large equivalent
widths of iron line by fluorescence from the illuminated disc material
(Reynolds et al. 1995, Lee et al. 1999).
The enhanced abundance of iron in the central
regions of AGN is also plausible if one considers that in quasars
large
metallicities
of up to 9 times the solar value
have been inferred (Hamann & Ferland 1999).
If however the accretion disc is ionized,
two processes work in the opposite directions:
1) preferential illumination of the disc and efficient reflection
of the line photons from the cloud
and 2) Comptonization in the disc which smears this line.
These two processes cancel each other to some extent.
The continuum produced in the corona can also be reflected and later
absorbed in the cloud which will lead to increases in the strengths of the
continuum level, absorption feature and disc line
by the same factor (for fixed ).
Note that even when the disc is ionized,
the albedo may still be significantly far from unity. Thus,
for an ionized accretion disc,
resonant absorption is not completely cancelled
by the correction for spontaneous emission.
The depth of the absorption feature depends on our parameter
which
is related to the column density. The amount of ionized plasma which
reprocesses the continuum and the emission line from the disc is constrained
by the nondetection of the absorption edge of iron in the profiles obtained
by Nandra et al. (1999).
In order to estimate the importance of the absorption edge we calculate
the factor
where is the optical depth
at the photoionization threshold energy:
| (14) |
where is the cross section for photionization ( and are both close to , Yakovlev et al. 1992 and references therein). In consequence, the contrast of the absorption edge relative to the continuum can be small. The definition of does not include the fact that the column densities for geodesics intersecting the cloud further away from the centre are smaller, which will also reduce the iron edge. It also has to be stressed that the contrast of any absorption edge created close to the black hole would be further reduced by a factor of a few by the strong relativistic effects operating in this region. We therefore calculate the iron edge using a fully relativistic treatment to determine the allowed values of . The results are shown on Fig. 2 and Fig. 3 (dash-dotted lines around 8 keV). The strength of the calculated absorption edge is well within the acceptable range given the quality of the current data. In the considered range of temperatures the electrons in the plasma are nonrelativistic or mildly relativistic and the Thomson optical depth is where is the hydrogen column density. This means that the Compton parameter , where and thus, for the adopted values of , Comptonization by the Thomson thin plasma is unlikely to significantly alter the energies of the emission line photons radiated by the accretion disc and the continuum in the range keV (see also Fabian et al. 1995). As discussed above, the plasma may be photoionized by the continuum radiation, so in addition to the above processes, fluorescence following photoionization in the cloud should in principle be considered. Its influence will however be small. It can be roughly estimated by calculating the ratio of the equivalent width for the fluorescent photons to the equivalent width for the resonant absorption in the Newtonian limit. In our model the plasma is effectively optically thin and in this regime the ratio can be calculated by using the results from Matt (1994) and Krolik & Kallman (1987) and cast in the following form:
| (15) |
where is the fluorescent yield averaged over the fractional
abundance of the iron ions
(depending on temperature and some uncertain atomic physics (un the case of
He-like Fe), and lie in the range
, Krolik 1999).
is the spectral energy index,
is the energy of the absorption/fluorescent line, is the
threshold energy for photoionization
and is the solid angle subtended by the ionized plasma
as seen by the primary continuum source.
If the accretion disc is cold then the fluorescent photons
created in the hot cloud are thermalized when they
impinge upon the disc surface and are effectively destroyed
and therefore . Similarly in the case of the hot disc,
fluorescent photons directed towards the disc are strongly Comptonized
by multiple scatterings in the hot, optically thick medium and
the line spreads out to some extent and thus the effective value of
.
For example, the above ratio of the equivalent widths
for can be as small as
0.065 in the case of the cold accretion disc surrounded by a hot plasma
in which He-like ions are the primary source of opacity.
Moreover, this is an upper limit because the reabsorption of the fluorescent
photons has been neglected.
Fig. 4 shows the effect of the size of the cloud on the line profile.

Large cloud sizes lead to stronger absorption because the coherence length
over which resonant absorption can occur increases with distance from
the black hole. Of course the smaller the cloud the greater the
redshift of the absorption feature, but
the magnitude of absorption decreases as the size of the cloud
gets smaller. In principle, an ensemble of very small clouds or filaments
distributed at a range of distances from the central black hole could produce
a number of narrow absorption features
superimposed on the emission line, an effect
similar to the ’Ly forest’ observed in the spectra of distant quasars.
It is indeed plausible that the absorbing plasma may exist in the form of
small clumps. If the clumpy plasma of smoothed out mean density
is in photoionization equilibrium,
the ionization parameter necessary to produce a high ionization state
has to be ,
where is the filling factor.
Assuming the X-ray luminosity (in the energy range 2-50 keV),
the size of the absorbing region and the column density
to be erg s-1 (Stripe et al. 1998),
cm and cm-2 respectively,
one can obtain a rough estimate of the filling factor
, implying
that the plasma has a clumpy structure.
We note that the free-free emission from such clumps will
be erg s-1,
much less that the luminosity
in the X-ray band.
Magnetic fields are a plausible mechanism of confinement of the clouds
and we note that the existence of magnetically confined clumps
above the accretion disc was proposed and extensively discussed by
Kuncic, Celloti & Rees (1997).
The cloud densities envisaged in our work are however much less extreme.
Recently Iwasawa et al. (1999) reported on the observations of
the broad iron emission line
in MCG-6-15-30. They observed a bright flare in the light curve during which
the line peaked at 5 keV and most of the line emission was shifted below
6 keV with no component detected at 6.4 keV. They interpreted it as the
result of an extraordinarily large gravitational redshift owing to a dominant
flare occurring very close to the black hole at m. We speculate
that their profile may also be explained by resonant absorption by the
plasma expelled during the bright flare.
It is conceivable that such highly ionized material may be ejected to larger
heights above the accretion disc where the resonant absorption will be more
efficient due to the larger coherence length. The weaker gravitational field
at such distances will then lead to the absorption feature being
less redshifted which may in turn cancel
the main peak of the disc fluorescent emission line.
Therefore the maximum of the profile of the partially
absorbed iron line will be effectively seen at lower energies.
4 Conclusions
We have demonstrated that resonant absorption potentially plays an important role in the interpretation of the fluorescent iron emission line profiles from accreting black holes. Our model can explain the absorption features seen in the profiles recently obtained by Nandra et al. (1999) giving an alternative explanation of the data whereby the redshift of the absorption features is mainly gravitational in origin and fast accretion of the matter along the spin axis of the black hole is not required. We hope that forthcoming data from Chandra X-ray Observatory may help to break the degeneracy of the two proposed scenarios. Future high signal-to-noise observations may also provide us with information about the accretion flow near the black hole.
References
- [] Band D.L, Klein R.I., Castor J.I., Nash J.K.,1990, ApJ, 90
- [] Castor J.I., 1970, MNRAS, 149, 111
- [] Dabrowski Y., Fabian A.C., Iwasawa K., Lasenby A.N., Reynolds C.S., 1997, MNRAS, 288, L11
- [] Fabian A.C., Kunieda H., Inoue S., Matsuoka M., Mihara T., Miyamoto S., Otani C., Ricker G., Yamauchi M., Yaqoob T., 1994, PASJ, 46, L59
- [] Fabian A.C., Nandra K., Reynolds C.S., Brandt W.N., Otani C., Tanaka Y., Inoue H., Iwasawa K., 1995, MNRAS, 277, L11
- [] Hamann F., Ferland G.J., 1999, to appear in ARA&A and available at astro-ph/9904223
- [] Iwasawa K., Fabian A.C., Reynolds C.S., Nandra K, Otani C., Inoue H., Hayashida K., Brandt W.N., Dotani T., Kunieda H., Matsuoka M., Tanaka Y., 1996, MNRAS, 282, 1038
- [] Iwasawa K., Fabian A.C., Young A.J., Inoue H., Matsumoto C., 1999, MNRAS, 306, 19
- [] Kato T., 1976, ApJS, 30, 397
- [] Kuncic Z., Celotti A., Rees M.J., 1997, MNRAS, 717, 730
- [] Kurpiewski A., Jaroszyński M., 1999, A&A, 364, 713
- [] Krolik J.H., 1999, Active Galactic Nuclei: from the Central Black Hole to the Galactic Environment (Princeton: Princeton University Press)
- [] Krolik J.H., Kallman T.R., 1987, ApJL, 320, 5
- [] Lee J.C., Brandt W.N., Fabian A.C., Iwasawa K., Reynolds C.S, in preparation
- [] Lee J.C., Fabian A.C., Brandt W.N., Reynolds C.S., Iwasawa K, 1999, MNRAS, in press
- [] Matt G., 1994, MNRAS, 267, L17
- [] Morrison R., McCammon D., 1983, ApJ, 270, 119
- [] Mushotzky R.F., Fabian A.C., Iwasawa K., Kunieda H., Matsuoka M., Nandra K., Turner Y., 1995, MNRAS, 272, L9
- [] Nandra K., George I.M., Mushotzky R.F., Turner T.J., Yaqoob T., 1997, ApJ, 477, 602
- [] Nandra K., George I.M., Mushotzky R.F., Turner T.J., Yaqoob T., 1999, ApJL, in press, astro-ph/9907193
- [] Novikov I.D., Thorne K.S., 1993, in Black Holes [Les Houches Summer School 1972], DeWitt C. ed. (New York: Gordon and Breach Science Publishers)
- [] Reynolds C.S., 1997, MNRAS, 286, 513
- [] Reynolds C.S., Fabian A.C., Inoue H., 1995, MNRAS, 276, 1311
- [] Shu F.H., Physics of Astrophysics, Volume I: Radiation, 1991 (Mill Valley: University Science Books)
- [] Stripe G.M., Wilkes B.J., Comastri A., Mathur S., O’Brien P.T., 1998, in Scarsi H., Giommi P., Fiore F., ed., The Active X-Ray Sky: Results from BeppoSAX and RXTE, Nuclear Physics B Proceedings Supplements, 69, 505
- [] Tanaka Y. et al., 1995, Nature, 375, 659
- [] Yakovlev D.G., Band I.M., Trzhaskovskaya M.B., Verner D.A., ESO scientific preprint No. 835
5 acknowledgments
MR acknowledges support from an External Research Studentship of Trinity College, Cambridge; an ORS award; and the Stefan Batory Foundation. ACF thanks Royal Society for support. We thank Giorgio Matt, Roger Blandford and Martin Rees for useful discussions. We also thank the referee - H. Netzer for constructive comments.