Finding Clusters of Galaxies in the Sloan Digital Sky Survey using Voronoi Tessellation
Abstract
The Sloan Digital Sky Survey has obtained 450 square degrees of photometric scan data, in five bands (), which we use to identify clusters of galaxies. We illustrate how we do star-galaxy separation, and present a simple and elegant method of detecting overdensities in the galaxy distribution, using the Voronoi Tessellation.
Princeton University Observatory, Princeton NJ 08544
Since first light in May 1998, the Sloan Digital Sky Survey (SDSS; Gunn & Weinberg 1995) has obtained 450 of photometric scan data to in five bands . Here we present our first attempt to search for clusters of galaxies from these imaging data, with redshifts as high as .
The SDSS photometric pipeline (Lupton et al. 2000) evaluates various physical parameters from the photometry of each detected object, including Petrosian magnitudes, PSF magnitudes, model fits to exponential and de Vaucouleurs profiles, and aperture magnitudes in all five bands. Stars and galaxies lie in slightly different regions in this parameter space, and we can separate them with series of cuts in different projections. In particular, we did so using cuts in the difference between the PSF and model magnitudes versus model magnitude in ; the radius which encloses 90% of the Petrosian flux as a function of the color, and the difference between Petrosian and fiber magnitude versus color. Stars and galaxies are readily distinguished in these projections to . In the 150 region we’ve analyzed, this results in a total of galaxies. Although more rigorous star-galaxy separation based on a complete model of the PSF and its spatial variation is currently underway, we find that our technique is sufficient for this study.
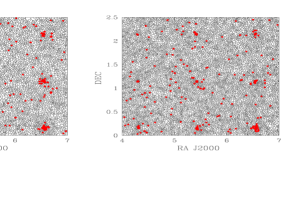
Clusters may be identified in a variety of ways: the Voronoi Tessellation technique (VT; Ramella et al. 1998 and references therein), the Matched Filter techinique (Postman et al. 1996), and a refinement of the latter, the Adaptive Matched Filter technique (Kepner et al. 1999). We have investigated all three of these approaches, and find good agreement between the rich clusters found by each. Full results will be presented in a separate paper (Kim et al. 1999). Here, we compute the Voronoi tessellation with each galaxy as a seed, defining the effective area (in the 2D case) that each galaxy occupies. Taking the inverse of this area gives us a density for each galaxy, which we use to identify the highest density regions. Figure 1 shows an example of Voronoi Tessellation over simulated clusters embedded in a uniform background. Clusters are identified by the dots, indicating galaxies with high density contrast ().
With the SDSS five-band photometric data, we are able to investigate the clustering properties of the galaxies with different colors. We find as expected, that in general redder galaxies are more clustered than the bluer population, especially in the very high density tail (). However, the simplest exercise of computing the Voronoi Tessellation on two subsets of blue () and red () galaxies that are brighter than show that most of the nearby Abell clusters are detected in the bluer half, but not in the redder half. On the other hand, higher redshift clusters () that are both known (mostly ROSAT clusters) and previously unidentified, show prominently in the redder sample and are invisible in the blue. This is an interesting result given the conventional wisdom that the fraction of blue galaxies in clusters is very low at low redshift, and increases at high redshift (e.g., Butcher & Oemler 1984).
Comparison with the Rosat All Sky Survey (cf., Voges et al. 1999) contour maps have also been done. A good fraction of cluster candidates are detected, with the x-ray center within 1 arcminute of the Brightest Cluster Galaxy, which is comparable to the error of the x-ray resolution.
References
Butcher, H., & Oemler, A. 1984, ApJ, 285, 426
Gunn, J.E. & Weinberg, D.H., 1995, in Wide Field Spectroscopy and the Distant Universe ed. Maddox & Aragòn-Salamanca (World Scientific, Singapore), 3
Kepner, J., Fan, X., Bahcall, N., Gunn, J., Lupton, R. & Xu, G., 1999, ApJ, 517, 78
Kim, R. S. J. et al. 1999, in preparation
Lupton et al. 2000, in preparation
Postman, M. et al., 1996, AJ, 111, 615
Ramella, M., Nonino, M., Boschin, W., & Fadda, D. 1999, in Observational Cosmology: The Development of Galaxy Systems, ed. G. Giuricin, M. Mezzetti, and P. Salucci, ASP, 176, 108
Voges, W. et al. 1999, A&A, 349, 389