The Cosmic Foam and the Self-Similar Cluster Distribution
1Kapteyn Institute, University of Groningen, Groningen, the Netherlands
1 Foamlike Patterns in Cosmic Structure
Probing cosmic large scale structure on the basis of X-ray observations puts particular emphasis on the densest regions within the global matter distribution, the rich clusters of galaxies. Understanding the relationship between the cluster distribution and the underlying matter distribution is therefore a key element in any assessment of cosmic structure on the basis of samples of X-ray selected clusters. By now, the foamlike arrangement of matter and galaxies on Megaparsec scales has become a well-established feature of the cosmic matter distribution, consisting of an assembly of anisotropic elements, filaments and walls of various sizes, surrounding large underdense void regions and sprinkled with wholly or partially virialized dense clumps of matter, varying in size from rich clusters of galaxies down to small groups of a few galaxies. It is one of successes of gravitational instability cosmic structure formation theories to find that this pattern of walls, filaments and voids appears to be the generic outcome of these scenarios.
A major obstacle in quantifying this quintessential aspect of cosmic structure is the lack of a systematic insight into the dynamical and statistical aspects of cellular geometries as well as the absence of a readily available and well-established mathematical machinery to evaluate and compare observations and simulations. Stochastic geometry – the branch of mathematics concerned with nontrivial geometrical concepts involving stochastic behaviour of one or more of their characteristics – may be expected to contribute significantly to further such understanding.
2 Voronoi Tessellations
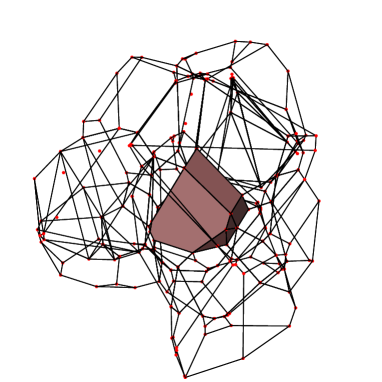
The canonical example of a stochastic geometrical model for a cellular division of space is that of Voronoi tessellations. This space filling network of convex polyhedra offers a surprisingly realistic and versatile representation of the characteristics and features of the foamlike or cellular spatial arrangement of matter in the Universe. In short, it is defined through a spatial distribution of nuclei[9]. Each nucleus corresponds to one Voronoi cell, which comprises that part of space closer to this nucleus than to any of the other. The walls and edges forming the polyhedrons’ surfaces are identified with the wall-like and filamentary superclusters in the galaxy distribution, the vertices with and massive clusters of galaxies, while the interior of the Voronoi cells corresponds to the large void regions barren of galaxies. The morphology of artificial galaxy distributions set up within this network bears a striking resemblance to that observed in the more complicated circumstances of the real Cosmos or that of the artificial reality of computer simulations of structure formation. Figure 1 shows a conglomerate of several neighbouring Voronoi cells, with one of the cells by shaded surface and a wire-framed representation in the case of its neighbouring cells. The solid lines are the edges (filaments) in the network, the dots (coloured red) are the vertices of the Voronoi tessellation. In principle a Voronoi tessellation could be regarded as a mere geometric toy model, a heuristic geometrical description of a substantially more complicated reality. However, a detailed assessment of the role of voids in structure formation provides a physical ground for them representing reality, whether the observed or simulated one, in a more subtle way[5][4]. This is certainly reinforced by their striking resemblance to the observed or simulated foamlike appearance of the galaxy and matter distribution.
3 Voronoi Vertex Clustering
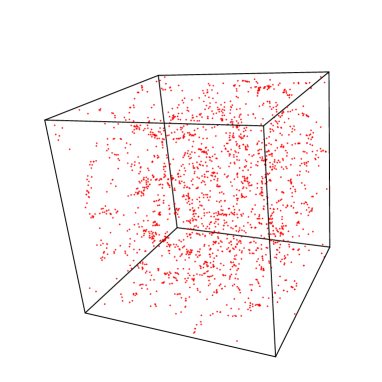
Even in the limited setting of Figure 1 it is evident that the vertex distribution is not a random Poisson distribution. The full spatial distribution of Voronoi vertices in the full cubic volume (righthans frame fig. 1) clearly involves a substantial degree of clustering. This impression of strong clustering, on scales smaller than or of the order of the cellsize , is most evidently confirmed by their two-point correlation function . Not only can we discern a clear positive signal but – surprising at the time of its finding on the basis of similar computer experiments[8] – out to a distance of at least the correlation function appears to be an almost perfect power-law,
| (1) |
with a slope . Its amplitude, traditionally expressed in terms of the “clustering length” , at which , has a value . Beyond this range, the power-law behaviour breaks down and following a gradual decline the correlation function rapidly falls of to a zero value once distances are of the order of the cellsize. However, rather than a characteristic geometric scale, is more a measure for the “compactness” of the spatial clustering, set mainly by the small-scale clustering. A more significant scale within the context of the geometry of the spatial patterns in the density distribution is the “correlation length” , the scale at which . As a genuine scale of coherence, it is more relevant to the morphology of the nontrivial spatial structures we seek to study. Beyond the distribution of Voronoi vertices is practically uniform.
If we interpret the clustering length , usually found for samples of rich clusters of galaxies[2], within the context of a Voronoi tessellation it would imply a cellsize of . Although the two-point cluster-cluster correlation function reproduced by the Voronoi vertices fits very well to the function yielded from the observations, the large cell size may be a complication. It is surely well in excess of the size of the voids in the galaxy distribution. Moreover, also within the Voronoi concept itself it would conflict with the clustering of objects dwelling in the walls and filaments of the same tessellation framework. Clustering analysis of such configurations[9] reveals that the two-point correlation function of galaxies confined to the walls – as well as for those confined to the edges – also displays distinct power-law behaviour at sub-cellular scales. The involved clustering length, however, is different from that of the vertices in the same framework. For the wall galaxies it is but half the value of that of the vertices, [9],[10]. If is identified with the galaxy-galaxy clustering length of , this would yield a cellsize of . The latter is suggestively similar to the size of the actually observed voids, which may be a tantalizing hint for a profound relationship between the clustering length and the typical cellular scale of the cosmic foam network.
Adressing this apparent inconsistency between vertex and wall clustering we first observe that the vertex correlation function of eqn. (1) concerns the whole sample of vertices, irrespective of any possible selection effects based on one or more relevant physical aspects. In reality, it will be almost inevitable to invoke some sort of biasing through the defining criteria of the catalogue of clusters. Interpreting the Voronoi model in its quality of asymptotic approximation to the galaxy distribution, its vertices will automatically comprise a range of “masses”. Neglecting the details of the temporal evolution, we may assign each Voronoi vertex a “mass” equal to the total amount of matter that ultimately will flow towards that vertex. Applying the “Voronoi streaming model”[9] as a reasonable description of the clustering process, it is reasonably straightforward if cumbersome to calculate the “mass” or “richness” of each Voronoi vertex by pure geometric means[10]. It concerns the volume of a non-convex polyhedron centered on the Voronoi vertex, with related Voronoi nuclei as one of the polyhedral vertices. These nuclei are the ones that supply the Voronoi vertex with inflowing matter. Evidently, the “mass” is larger for vertices on the surface of large Voronoi cells.


The vertex samples in our study consist of all Voronoi vertices with a richness equal to higher than a limiting value, the “sample richness” [10]. Subsequently, we determined the correlation function characteristics for each of the vertex samples. Assessing their behaviour as a function of the average distance between the sample vertices, for samples encompassing from up to of the total number of Voronoi vertices and thus for , revealed a remarkable and tantalizing scaling of the clustering phenomenon[10].
All subsamples of Voronoi vertices have a two-point correlation function that out to a certain range retains a power-law behaviour almost exactly similar the one of the full sample of vertcies. No significant difference in power law slope between the various subsamples can be discerned, all have . On the other hand, both clustering length and correlation length do display a systematic dependence on sample richness. Both and increase proportionally to the sample richness, and hence the average vertex distance in the samples ! The more massive the vertices are, the more strongly they cluster. In other words, in the line of the random field “peak biasing” scheme[6], we here find a purely geometrically based biasing scheme. Interesting in this respect is to observe that the increase of is perfectly linearly proportional to the mutual vertex distance in the sample (Fig. 2, left frame). This suggests that Voronoi vertex clustering is a perfect realization of the clustering scaling description proposed by Szalay & Schramm[7]. It also adheres to the increasing level of clustering that selections of more massive clusters appear to display in large-scope N-body simulations[3] although there are telling differences in detailed behaviour.
For our purpose, even more significant is the uncovered scaling of the correlation length , similar in character to that of . The increase of also turns out to be almost exactly linearly proportional to the average vertex distance. The repercussions are manyfold. It means that the selected vertices still have a strong positive correlation at scales where the poorer samples do not possess any clustering. Moreover, samples with more massive clusters are expected to have a clustering that extends out further than that of their poorer brethren. This may be a significant observation in the light of the finding that samples of rich galaxy clusters seem to have a positive correlation at scales of tens of Megaparsec, quite in excess of scales with appreciable galaxy clustering. Finally, the implied constant ratio between clustering and correlation length, (Fig. 2, right frame), implies a perfect self-similar scaling of the Voronoi vertex distribution. The complete correlation function of each selected subsample , and not just the part in the power-law range, is a self-similar mapping of an elementary function scaled by means of a characteristic lengthscale parameter .
4 Bias and Cosmic Geometry: Conclusions
The above results form a tantalizing indication for the existence of self-similar clustering behaviour in spatial patterns with a cellular or foamlike morphology. It might hint at an intriguing and intimate relationship between the cosmic foamlike geometry and a variety of aspects of the spatial distribution of galaxies and clusters. One important implication is that with clusters residing at a subset of nodes in the cosmic cellular framework, a configuration certainly reminiscent of the observed reality, it would explain why the level of clustering of clusters of galaxies becomes stronger as it concerns samples of more massive clusters. In addition, it would succesfully reproduce positive clustering of clusters over scales substantially exceeding the characteristic scale of voids and other elements of the cosmic foam. At these Megaparsec scales there is a close kinship between the measured galaxy-galaxy two-point correlation function and the foamlike morphology of the galaxy distribution. In other words, the cosmic geometry apparently implies a ‘geometrical biasing” effect, qualitatively different from the more conventional “peak biasing” picture[6].
References
- [1] Bardeen, J.M., Bond, J.R., Kaiser, N., Szalay, A.S., 1986, ApJ 304, 15
- [2] Bahcall, N.A., Soneira, R., 1983, ApJ 270, 20
- [3] Colberg, J., 1998, Ph.D. thesis, Ludwig-Maximilian Univ. München
- [4] Dubinski, J., et al., 1993, ApJ 410, 458
- [5] Icke, V. 1984, MNRAS 206, 1P
- [6] Kaiser, N., 1984, ApJ , 284, L9
- [7] Szalay, A., Schramm, D.N., 1985, Nature , 314, 718
- [8] van de Weygaert, R., Icke, V., 1989, A&A 213, 1
- [9] van de Weygaert, R., 1991, Ph.D. thesis, Leiden Univ.
- [10] van de Weygaert, R., 1999, in preparation