A mystery solved: the mass ratio of the dwarf nova EM Cygni
Abstract
We have discovered that the spectrum of the well-known dwarf nova EM Cyg is contaminated by light from a K2–5V star (in addition to the K-type mass donor star). The K2–5V star contributes approximately 16 per cent of the light from the system and if not taken into account has a considerable effect upon radial velocity measurements of the mass donor star. We obtain a new radial velocity amplitude for the mass donor star of , which compares with the value of obtained in Stover, Robinson & Nather’s classic 1981 study of EM Cyg. The revised value of the amplitude combined with a measurement of rotational broadening of the mass donor , leads to a new mass ratio of . This solves a long standing problem with EM Cyg because Stover et al.’s measurements indicated a mass ratio , a value which should have led to dynamically unstable mass transfer for the secondary mass deduced by Stover et al. The revised value of the mass ratio combined with the orbital inclination leads to masses of 0.990.12M⊙ and 1.12M⊙ for the mass donor and white dwarf respectively. The mass donor is evolved, since it has a later spectral type (K3) than its mass would imply.
We discuss whether the K star could be physically associated with EM Cyg or not, and present the results of the spectroscopic study.
keywords:
binaries: spectroscopic – novae, cataclysmic variables – accretion, accretion discs – techniques: radial velocities1 Introduction
EM Cygni is one of the most familiar examples of the sub-group of cataclysmic binary stars called dwarf novae (DN). They consist of a white dwarf star accreting material through the inner Lagrangian point from a late spectral-type mass donor. The material spirals down towards the white dwarf and forms an accretion disc around it. EM Cyg belongs to the sub-class of dwarf novae named after the prototype Z Cam, in which the peculiar characteristics of the light curve were first observed. They experience - in addition to the normal outburst/quiescent states of DN - periods of time when they appear to be ‘stuck’ in a semi-high state, making them appear visually approximately brighter than at minimum.
Additionally, EM Cyg is one of only a handful of cataclysmic variable (CV) stars which show an eclipse of the disc every orbit and spectral lines from both stellar components of the binary. This makes EM Cyg special amongst CVs, as it means that accurate binary parameters can be deduced from spectroscopic and photometric observations. In a classic study Stover et al. (1981) measured its absorption line radial velocity amplitude together with that from the emission lines and obtained a mass ratio ; this value confirmed an earlier study of Robinson (1974), who calculated that . A mass ratio greater than one is remarkable because if mass transfer is from the more massive star to its companion, the orbital separation must shrink in order to conserve angular momentum. Unless the donor star shrinks faster than the Roche lobe, mass transfer is unstable. The instability occurs on a dynamical time scale if the adiabatic response of the star fails to keep it within its Roche lobe. At higher donor masses (M) however, the star shrinks drastically when it loses material at a high rate and so the mass transfer becomes stable on a dynamical time scale but it is still unstable thermally (e.g. de Kool, 1992, Politano, 1996). The mass ratio (q=1.26) and the donor mass (M2 = 0.76M⊙) of Stover et al. (1981) lead to dynamical instability according to the criteria given by Politano, 1996: EM Cyg should not exist.
Despite this unique status, there have been no more recent studies of EM Cyg. In part, this is probably because measurements of the radial velocities of the white dwarfs in cataclysmic variables are normally based upon the emission lines which usually come from the accretion disc which surrounds the white dwarf, and these are well known to be unreliable (Stover et al., 1981). It would perhaps not be surprising if this problem affected Stover et al.’s (1981) study of EM Cyg. However, EM Cyg is one of the longer period dwarf novae (), for which the distortions of the emission lines are less significant because of the relatively high amplitude of the white dwarf, and in Stover et al.’s study, the emission and absorption line amplitudes are only from being in anti-phase, by no means a large distortion for these stars.
In this paper we present new spectra of EM Cyg which show clear evidence for contamination from a third star, which happens to have a very similar spectral type to the mass donor star. Accounting for the presence of this star increases the radial velocity semi-amplitude of the mass-donor star considerably, and causes the mass ratio () to become less than one, at the same time leading to a larger donor mass. Thus the mass transfer in EM Cyg is therefore stable as expected from theory.
2 Observations
On 22 June 1997 we took 102 spectra with the Intermediate Dispersion Spectrograph (IDS) on the Isaac Newton Telescope (INT) on the island of La Palma in the Canary Islands. Our dispersion was 0.4 Å per pixel and the spectra covered 6230 to 6650 Å. The resulting spectra have a resolution of 0.8 Å (FWHM). Conditions were clear throughout the night and the seeing was approximately 1 arcsec.
Each target exposure was of duration. The 0.8 arc sec wide spectrograph slit was oriented at a position angle of to capture the spectrum of a star 22 arcsec from EM Cyg in order to calibrate slit losses. Arc calibration spectra were taken every 35 minutes or so. The arc spectra were fitted with fourth-order polynomials. The rms scatter of these fits was of the order 0.003Å. Arc spectra were linearly interpolated in time to provide the wavelength calibration for EM Cyg. The CV appeared to be approaching its low state after a standstill when the spectra were taken (Mattei, 1999). Fig. 1 shows the light curve behaviour of EM Cyg during the period April 1997 to February 1998.

The CCD frames were bias-subtracted and then corrected for any pixel-to-pixel sensitivity variations using exposures of a tungsten lamp. Variations in the illumination of the slit were corrected using observations of the twilight sky. We extracted the spectra with optimised weights (Horne 1986). Spectra of radial-velocity standard K and M dwarf stars were also obtained. In all, 25 standard stars were observed, selected from the lists of Marcy et al. (1987), Beavers and Eitter (1986) and Duquennoy, Mayor and Halbwachs (1991).
3 Results

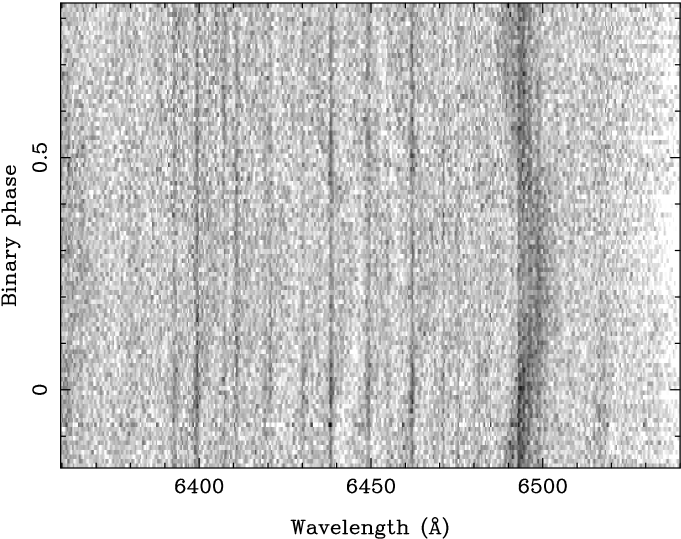
The mean spectrum of EM Cyg is presented in Fig. 2 (lower spectrum). The upper spectrum in Fig. 2 shows the average of the 102 spectra after subtraction of the contribution to the absorption lines from the contaminating K-type star (hereafter ‘third star’), see section 3.1, and after each spectrum has been shifted into the rest frame of the mass donor in EM Cyg in order to remove the effect of orbital smearing. Absorption features characteristic of a K-type star are visible in the lower spectrum. They are sharp, which is unexpected because the lines from the mass donor should be broadened by rotation, and by orbital motion. These lines are from the third star. It can be seen from this plot that the absorption lines in the upper spectrum (which represent those from the mass donor of EM Cyg) are indeed much wider than those in the lower spectrum, which is as expected due to the broadening effects previously noted.
This is confirmed from the trailed spectrum presented in Fig. 3.
The procedure followed to get from the lower spectrum to the upper spectrum in Fig. 2 was fairly complex, and so we start with a summary of the main points.
-
1.
The continua of the individual EM Cyg spectra were fitted and then subtracted. The resulting spectra were then re-binned onto a uniform velocity scale. The radial-velocity standard stars also had their continua subtracted, and were then binned onto the same velocity scale.
-
2.
The average EM Cyg spectrum was cross-correlated (using the method of Tonry & Davis, 1979) with each different radial-velocity standard star. This was done in order to obtain a list of the relative shifts between the two sets of absorption lines. These shifts were then applied to the standards, so that the absorption lines were congruous with those of the EM Cyg spectrum.
-
3.
The standard star spectra were then scaled and subtracted from the EM Cyg spectra in order to remove the absorption lines of the third star. We refer to this process as “optimal subtraction”.
-
4.
The spectral type of the standard star which gave the lowest on subtraction was adopted as the spectral type of the third star (e.g. see Fig. 5).
-
5.
The individual, contaminant-free EM Cyg spectra were then cross-correlated again with the radial-velocity standards. This time the standards were artificially broadened to match the rapid rotation of the mass donor (see section 3.2). The resulting radial velocities were then fitted with circular orbits in order to determine the radial velocity semi-amplitude of the mass donor, and the systemic velocity of the EM Cyg.
-
6.
The fit which minimised was then shifted out of the individual EM Cyg spectra in order to correct for the orbital motion of the mass donor. The resulting spectra were averaged to obtain a spectrum of EM Cyg in the rest frame of the mass donor (Fig. 2, upper spectrum).
-
7.
In order to derive the best-fit spectral type, and match the of the mass donor steps (i) to (iv) were repeated including the step of artificially broadening the radial-velocity standards (as in step (v)). See section 3.3 for details.
3.1 Analysis
The presence of the donor star is hard to see in the raw data (Fig. 3), but becomes clear after cross-correlation with a K-star radial-velocity standard (Fig. 4). The cross-correlation technique used is similar to that used for SS Cygni (Stover et al., 1980). The spectra had their continua fitted and then subtracted and were then transformed onto a logarithmic scale so that the cross-correlation technique could be used to measure the velocity shifts due to Doppler effects. In order to effectively remove the contribution to the absorption lines from the third star, the relative shifts between the velocity-standard stars and the average EM Cyg spectrum were determined, and then applied to the velocity standards. Then the standards were subtracted from the EM Cyg spectra to find the optimum fraction at which the standard should be scaled; see section 3.3 for a more detailed description of the procedures followed. This routine also provides a formal error on the fractional contribution from the third star, and the standard star which gives the minimum indicates its optimum spectral type. The standards were then multiplied by this constant, and subtracted from the EM Cyg spectra. The optimum fraction obtained is 0.1600.002, with a K3V standard star.
The spectral type of the third star could be initially deduced from the appearance of the absorption line spectrum between 6350Å and 6540Å (see Fig. 5). The criteria developed by Casares & Charles (1993) to determine the spectral type of the mass donor in V404 Cyg at wavelengths around H were also used to classify the contaminant. In particular, the lines at Ca I , and Fe I , and the blends at Ca I and Ca I Fe I , whose relative depths are useful indicators of spectral type (Casares & Charles, 1993) were used. However, as can be seen from Fig. 5 the relative depth of the blends at wavelengths 6400 Å and 6440 Å are also sensitive to variations in Teff. The blend at 6400 Å dominates at spectral types around G8V but then diminishes relative to the blend at 6440 Å becoming equal at around K3, until it is hardly apparent at spectral types around M4V. In EM Cygni these blends appear to have equal strengths relative to each other, indicating a spectral type around K3V. The optimal subtraction process described earlier in this section was carried out for each individual EM Cyg spectrum, and a different constant computed for each. Then the standards were scaled using these constants, and subtracted from the EM Cyg spectra. The spectral type of the third star was best fitted by standards between types K2V and K5V. The standard which minimised the value of had a spectral type of K3V.
The third star subtraction process was then carried out ‘in reverse’ to check for possible systematic errors caused by this spectral typing procedure. This means that the absorption lines from the mass donor in EM Cyg (which are broadened by rotational and orbital effects) were optimally subtracted first (using the same general method as in section 3.2), and then the optimum spectral type of the third star was determined. In this case the optimum spectral type for the third star came out slightly earlier at K2V, indicating that we cannot constrain the spectral type any more precisely than between K2V and K5V with this method.
Finally the sequence of cross-correlation, shifting, and optimal subtraction was repeated using the best-fit spectral-type standard to the contaminating absorption lines (K3V). The resulting spectra were then used (see section 3.2) to find out the spectral type of the mass donor in EM Cyg. The relative shift between the standard star absorption lines and those of EM Cyg’s average spectrum gave a measure of the systemic velocity of the third star. This turned out to be . This is similar to the systemic velocity derived for the mass donor in EM Cyg by Stover et al. (1981) from the absorption lines of the spectrum in the H region (), and is also similar to the value determined in section 3.2 (). The agreement in systemic velocities of the mass donor and the third star is a hint that they are physically associated (see section 4.2).
The next section details the method used to obtain the radial velocity semi-amplitude of the mass donor (which incorporates the cross-correlation technique followed by Stover et al. (1980)).

3.2 Radial velocity of the Donor star
Once the individual spectra of EM Cyg had been corrected for the presence of the third star, the radial velocity semi-amplitude of the actual mass donor was calculated. The corrected EM Cyg spectra were cross-correlated (using the method of Tonry & Davis, 1979) with the radial-velocity standards each of which had been artificially broadened. The resulting radial velocity curves were then fitted with circular orbit fits of the form
Then each EM Cyg spectrum was shifted to correct for the orbital motion of the donor star, and the results averaged. This gave the average spectrum of EM Cyg in the rest frame of the mass donor (Fig. 2), which clearly shows the rotationally broadened absorption lines from the donor, especially in the wavelength region 6350Å – 6540Å. Next, this spectrum was cross-correlated once again with the velocity standards and the relative shifts computed and applied. Then a constant times each rotationally broadened standard was subtracted from the average EM Cyg spectrum. The fraction chosen was that such that the of the residual spectrum was minimized. Plotting the values of against the spectral type of the standard star revealed a minimum at spectral types around K3. The circular orbit fit for the K3 standard was then shifted out of the contaminant-free EM Cyg spectra, and the optimal subtraction procedure then repeated to check for systematic errors which could appear due to spectral type mismatch. Initially, the spectral type of the mass-donor was estimated by inspection, in the same manner as for the third star (see section 3.1). The absorption line relative strengths were noted between wavelengths 6350Å and 6540Å as compared to rotationally broadened versions of the standard stars. Fig. 6 shows the apparent best position to place EM Cyg on the plot, in amongst the standard stars whose spectral types range from G8V to M1.5V. Most of the M dwarfs for which spectra were obtained have been omitted from this diagram simply because it became obvious, both by inspection and from the results of the initial optimal subtraction, that they weren’t a suitable spectral-type match to the mass donor in EM Cyg. The spectral features around 6400Å and 6440Å in particular, were noticeably different, as was the general shape of the spectrum blueward of 6400Å.

After this iterative process had been carried out using the standard with the best fit spectral type (broadened according to the measurement of the rotational velocity, which is detailed in section 3.3), a revised value for the radial velocity semi-amplitude of the mass donor star was obtained. Fig. 7 shows the circular orbit fit to all the data points. The parameters of this fit are given in Table 1. The rms error of the fit is 13 .
Fig. 8 shows the fractional contribution from the mass donor to the total light as a function of orbital phase. There is no obvious variation in the fraction contributed by the mass donor over the orbital period. Also, there appears to be no visible decrease around phase 0.5, which indicates that irradiation of the donor star by the white dwarf is not important. This is confirmed by the lack of any obvious distortion of the radial velocity curve (see Fig. 7), especially around phases 0.25 – 0.75, compared with, for example, the distortion seen in the radial velocity curve of HS1804+6753 (Billington, Marsh & Dhillon, 1996). A weighted least-squares fit to the data points in Fig. 8 gives the mean fraction contributed by the mass donor over the orbital period to be 0.2310.005.


| Element | Mass Donor111Reference: this paper | White Dwarf222Reference: Stover et al. (1981) |
|---|---|---|
| K ( ) | 2023 | 17010 |
| -252 | -577 | |
| 2450621.4820.001 | 2443697.1280.003 | |
| 0.770.08 | 0.480.06 |
3.3 Rotational Velocity of the Donor Star
The rotational broadening of the donor star was estimated by shifting the radial velocity fit determined in the previous section out of each EM Cyg spectrum, and then co-adding the results to produce a spectrum of the star in the rest frame of the mass donor (see Fig. 2). Then this average spectrum was cross-correlated with the standard stars, whose spectra had been artificially broadened by a range of velocities (10 – 200 in steps of 10 ). Both the object and standard star spectra were normalised in the continuum. The radial-velocity standard spectra were then shifted by an amount determined from the correlation. A constant times each broadened standard spectrum was then subtracted from the object spectrum, to produce a residual spectrum. Then a smoothing coefficient was applied to the difference spectrum in order to remove any large scale features. The of the result was computed in the region containing the absorption line features (6390 – 6510Å ). The resulting curves of versus the value of the rotational broadening used are shown in Fig. 9, for the spectral types from K1 to K7.
From Fig. 9 it is possible to deduce a value for the rotational broadening and an estimate of the spectral type of the mass donor. Fig. 9 also shows that the systematic error due to using different spectral types to obtain values for is less than 10 . The minimum is obtained for and spectral type K3V.
Another systematic effect to be taken account when calculating the rotational broadening of the mass donor is its non-spherical shape. The size of this effect was estimated by computing model absorption profiles including the effects of Roche geometry and system parameters appropriate for EM Cyg. These profiles were then used to broaden a K3 standard star. The ’s of the resulting simulated spectra were then estimated using the same procedure applied previously to the data. The parameters of Table 3 were used to define the Roche lobe (i.e. , ), and the method outlined by Marsh, Robinson & Wood (1994) was used. Table 2 shows the results of this process and demonstrates that the distortion of Roche lobe geometry has a negligible effect since we recover for our assumed limb darkening of 0.5. However, one can see that increasing the value of the limb darkening parameter used to calculate the rotational broadening of the lines from the mass donor makes the star appear smaller, and introduces a systematic error of the order 10 . In all subsequent analysis the value used for the linear limb-darkening parameter was 0.5.
| Inclination | Limb Darkening333Gravity darkening taken to be 0.08 Mass ratio 0.88 assumed | |
| ( ) | ||
| 69∘ | 0 | 1474 |
| 69∘ | 0.5 | 1403 |
| 69∘ | 1 | 1303 |
In addition, the systematic error introduced by altering the linear limb-darkening parameter whilst artificially broadening the standard stars was also accounted for. Using a value of 0 for the linear limb-darkening parameter with the best fit standard discovered from Fig. 9, the measured dropped to . With the limb darkening set to 0.5, the value increased to , an error of magnitude 5 .
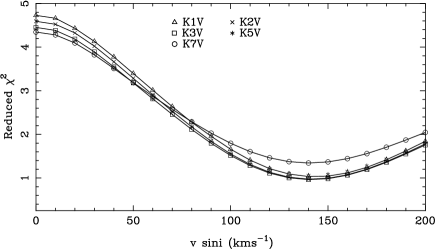
Accounting for these possible sources of error, we adopt a value for the rotational broadening of the mass donor star, , of . From the curves of Fig. 9, and the relative depths of the absorption lines, the spectral type of this star is found to be K3V, and it contributes 23 per cent of the total light in the H wavelength region.
3.4 Doppler Tomography
Doppler tomography is an imaging technique which allows the distribution of line emission to be mapped in velocity space (Marsh & Horne, 1988). A thorough analysis of several applications of this method to real CV data are given in Marsh & Horne (1990) and Marsh et al. (1990).
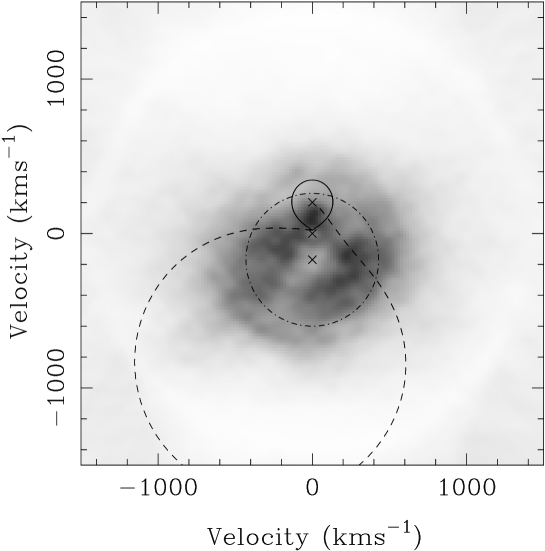
Fig. 10 shows the reconstructed Doppler tomogram of the H emission line in EM Cyg. Any spectra affected by eclipse were not included in the fit. The Doppler image shows a diffuse ring-like emission structure, representing the accretion disc, which if tracking the motion of the white dwarf should be centred at position (0, -K1) in velocity space. The inner edge of this ring represents the velocity at the outer edge of the disc, which appears to be at a velocity of 200 , which is low compared with values of the outer disc velocities of other dwarf novae (e.g. Marsh & Horne, 1990); the dashed circle drawn at 430 , is the Keplerian velocity at the outer edge of a disc of radius 0.8R (see section 4.2). The apparent ‘hole’ near the centre-of-mass velocity of the system is due to the third star. This was not removed from the original spectra in order to show its relative magnitude and to demonstrate that we can pick up its H flux.
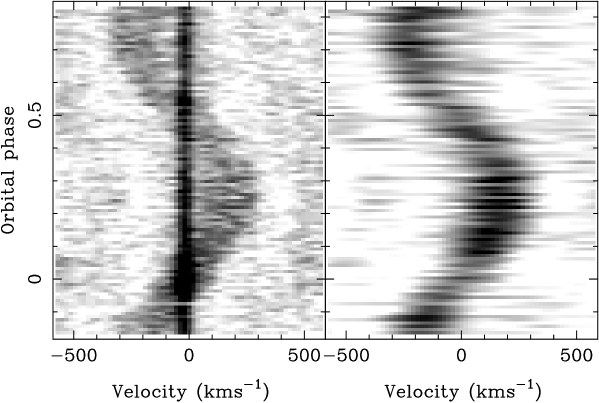
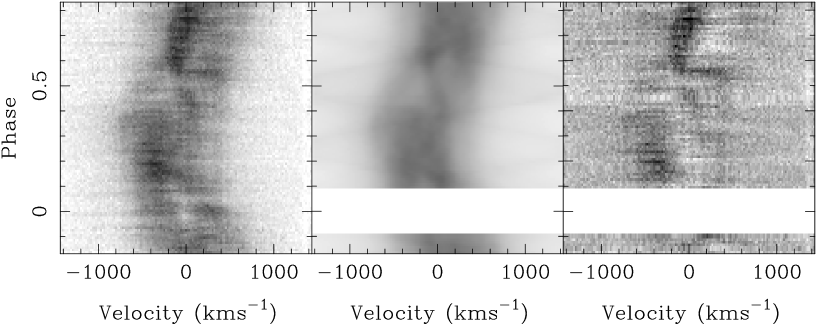
The trailed spectra in the left-hand panel of Fig. 11 shows the set of spectra used to compute the Doppler image. Visible in Fig. 11 at phase 0 (with the fiducial phase being defined as the inferior spectroscopic conjunction of the mass donor) is the phenomenon of blue-shifted emission being eclipsed before the red-shifted emission (Fig. 12), known to be caused by a rotating disc; we use this in the next section to constrain the orbital inclination. Although there is no obvious S-wave from the mass donor visible in the trail, there is emission on the irradiated face of the donor visible on the Doppler map (Fig. 10) . The central panel of Fig. 11 shows the data computed from the H Doppler map. The large region of emission around phase 0.7 apparent in the actual data, is not completely reconstructed in the computed data. Finally, the right-hand panel shows the residual formed when the computed data is subtracted from the observed data.

4 Discussion
4.1 New System Parameters
The main result of this study has been to discover that the spectrum of EM Cyg is contaminated by light from a star with a very similar spectral type to its own mass donor. Removal of the contamination by this star from the spectral lines in the region blueward of H increases the measured semi-amplitude of the radial velocity curve of the mass-losing star by over 50 , effectively removing the problem previously associated with EM Cyg: that the system should be in a state of dynamically unstable mass transfer. Table 3 shows the re-measured orbital elements, and those parameters which can be derived from them.
| Orbital Elements444e = 0 (assumed) | ||
|---|---|---|
| Name | Value | Reference |
| Period (days) | 0.2909090.0000042 | Robinson (1974) |
| K2 | 202 | this paper |
| K1 | 170 | Stover et al. (1981) |
| T0 (JD⊙)(2450621+) | 0.4830.001 | this paper |
| ( ) | -252 | this paper |
| sin (cm) | this paper | |
| Derived System Parameters | ||
| ( ) | 1406 | this paper |
| q (=M2/M1) | 0.880.05 | this paper |
| M (M⊙) | 0.770.08 | this paper |
| M (M⊙) | 0.880.05 | this paper |
| inclination, (degrees) | 61 | this paper |
| M2 (M⊙) | 0.990.12 | this paper |
| M1 (M⊙) | 1.130.08 | this paper |
| R2 (R⊙) | 0.870.07 | this paper |
The range for the inclination , shown in Table 3 was deduced as follows. A simulated H trailed spectrum was created using the system parameters determined previously (namely q and as 0.88 and 372 respectively) over the phase range covered by the actual data, i.e. phases . The power law used for the intensity over the disc as a function of radius was -1.5, and the velocity limits of the plots were . The outer disc radius used was 0.8R. The eclipse of the disc in the simulated H trail becomes visible at inclination angle, . The inclination angle at which the eclipse matches that seen in the actual data is . At , the white dwarf is eclipsed, but it is apparent from our data that we are not observing an eclipse of the white dwarf (Robinson, 1974). This places an upper limit to the inclination of 70°. No part of the primary Roche lobe is occulted for inclinations less than 61°, thus placing a firm lower limit on , higher than that reached by Robinson (1974). Henceforth, we adopt a value of to cover the range where the uncertainty should be interpreted as a 1 estimate.
The radial velocity semi-amplitude of the white dwarf star was checked using the double Gaussian technique developed by Schneider & Young (1980). The line wings are used to determine the radial velocities because they form in an area which is close to the white dwarf and so disruption of symmetry by the gas stream and mass donor star are minimised. Twin Gaussians (200 FWHM) with separations varying from 1200 – 1800 were used. This procedure gave consistent values of the white dwarf radial velocity semi-amplitude , in agreement with that obtained by Stover et al. (1981). The systemic velocity measured from the radial velocity curve fits was , consistent with that obtained from the mass donor analysis. The emission line radial-velocity curves were measured to be delayed by from being exactly in anti-phase with with the donor star.
4.2 Masses
The measurements of and K2 can be used to deduce the mass ratio . Assuming that the donor star rotates synchronously then
| (1) |
The relative size of the donor star is constrained by Roche geometry to be
| (2) |
Eggleton (1983). Applying these equations we find . This is consistent with that found from K1: , but we prefer the value determined from as K1 measurements often suffer distortions (Stover, 1981).
The values obtained here for K2, q (derived from the rotational broadening measurement) and can be combined with the orbital period obtained by Robinson (1974) to calculate the masses of each component using:
| (3) |
| (4) |
The values obtained are shown in Table 3. Assuming the inclination value concluded in the previous section, , we calculate component masses of and . The value for the white dwarf mass is consistent with those given for other Z Cam systems (Ritter & Kolb, 1998). However, the mass for the donor star is close to that of the Sun, which is a G2V star, compared with our observed K3 (Allen 1973). Beuermann et al. (1998) discuss whether the mass donor stars in CVs are main-sequence stars, using relationships between spectral type and orbital period in a sample of CVs. They show that the donor stars in CVs with shorter orbital periods fit the ‘unevolved’ evolutionary tracks well, whilst those at longer periods tend to fit ‘evolved’ models better. EM Cyg with its orbital period of 6.98 hours, and mass donor spectral type of K3, fits on the plot nearer to the ‘moderately evolved main-sequence’ track, indicating that EM Cyg may have an evolved mass donor, because it appears to be oversized and over-massive for its spectral type. The radius of the mass donor is which compares with 0.74R⊙ for a K5V star, and 0.85R⊙ for a K0V star (Allen, 1973), indicating that it is oversized compared to a main-sequence star of the same spectral type. However, the mass deduced for the donor star () is not consistent with its spectral type according to the current theoretical models of Kolb & Baraffe (1999). Their stellar models only become as cool as K3 for a donor star mass of , and this is only if the mass loss rate has been rather high (and the mass donor is unevolved). In addition, they show that if the mass donor is ‘evolved’ it would have a slightly earlier spectral type than a ZAMS star with a mass of 1 M⊙. In summary, the new system parameters appear to be inconsistent with the current CV mass-donor models.
We have identified a third star contaminating the spectral region around H wavelengths in EM Cyg, causing the absorption lines in this area to appear narrow, with none of the broadening present which is associated with the actual mass donor. The spectral type of this third star has been identified as K2V – K5V, which is similar to that of the mass donor. It also contributes a similar percentage of light to the spectrum of EM Cyg as the actual mass donor. The third star contributes a fraction 0.1600.002 to the light of EM Cyg at H wavelengths, whilst that contributed by the mass donor is 0.2310.005. Once this third star has been accounted for, the measurements for the radial velocity semi-amplitude increase (from to ) and the mass ratio of EM Cyg falls below one, removing the conflict with the theory. The semi-amplitude of the radial velocity curve for the white dwarf is , which agrees with the value given by Stover et al. (1981), and which gives a mass ratio of q=0.880.05 . The radial velocity of the centre-of-mass of the binary from the absorption line measurement is . The radial velocity of the contaminating spectrum is also consistent with this value () which implies that the third star and EM Cyg may be physically associated. In addition, the similarity of spectral type and fractional contribution to the spectrum of EM Cyg indicates that the third star and the CV may be at similar distances. However, the field of EM Cyg is quite a crowded one, and so a chance superposition is also plausible. To address this we acquired some direct images on the William Herschel Telescope which have a FWHM of 0.7 arcsec, but we still could not resolve the third star. The value of obtained with the new semi-amplitude and mass-ratio values is cm. Assuming Keplerian motion in the disc, then
| (5) |
where R is the distance from the centre of mass of the white dwarf to the inner Lagrangian point and is equal to for . Using the determined values of M=0.880.05M⊙, = cm, and the outer disc velocity, as 305 we calculate a value of r. This is physically impossible as it implies that the disc must occupy space outside the Roche lobe of the white dwarf. For a more believable disc radius of 0.8R, the predicted outer disc velocity, using equation 5 is 430 . Stover et al. (1981) measured the half-separation of the peaks of the H line to be , giving an outer disc radius of 0.98R, still too large, but not as discrepant as H, for which we have no explanation.
5 Conclusions
We have found a significant contribution to the spectrum of EM Cyg in the H wavelength region from a K-type star other than the mass donor. When removed from the spectrum, the absorption line radial velocity amplitude increases by over 60 to bringing the mass ratio calculated from the radial velocity semi-amplitudes down to 0.88 from the value of 1.26 calculated by Stover et al. (1981). This solves the ‘mystery’ surrounding the supposed dynamical instability EM Cyg would suffer if the mass of the donor star was less than 0.8M⊙ and more massive than the white dwarf (as deduced by Stover et al., 1981). The radial velocity of this ‘contaminating’ third star () is similar to the measured radial velocity of the centre-of-gravity of EM Cyg (), which is consistent with the stars being physically associated. In addition, the spectral types of the two red stars are similar (K2-K5V). The third star contributes 16.00.2 per cent of the light in this wavelength region, 7 per cent less than that contributed by the donor star (23.10.5 per cent). The rotational broadening of the mass donor in EM Cyg is measured to be , and its mass calculated as . Smith & Dhillon (1998) plot the mass (in solar mass units) versus the spectral type of the mass donor in a sample of CVs. EM Cyg is on this plot with a spectral type of K5V, and a mass of . The new value of M2 puts the system above where it should be were it a main-sequence star, confirming that the mass donor in EM Cyg must be evolved. If the third star is actually physically associated with EM Cyg, then this would make it only the second CV known to be in a triple system (Reimers, Griffin & Brown 1988).
Acknowledgments
TRM was supported by a PPARC Advanced Fellowship during the course of this work. The data reduction and analysis were carried out on the Southampton node of the UK STARLINK computer network. The INT and WHT are operated on the island of La Palma by the Isaac Newton Group in the Spanish Observatorio del Roque de los Muchachos of the Instituto de Astrofisica de Canarias. In this research, we have used, and acknowledge with thanks, data from the AAVSO International Database, based on observations submitted to the AAVSO by variable star observers worldwide.
References
- [1] Allen, C. W., 1973, Astrophysical Quantities, 3rd Edn, Athlone Press, London.
- [2] Beavers, W. I., Eitter, J. J.1986, ApJS, 62, 147.
- [3] Beuermann, K., Baraffe, I., Kolb, U., Weichold, M., 1998, A&A, 339, 518.
- [4] Billington, I., Marsh, T. R., Dhillon, V. A., 1996, MNRAS, 278, 673.
- [5] Casares, J., Charles, P. A., 1993, MNRAS, 265, 834.
- [6] de Kool, M., 1992, A&A, 261, 188.
- [7] Duquennoy, A., Mayor, M., Halbwachs, J. L., 1991 A&AS, 88, 281.
- [8] Eggleton, P., 1983, ApJ, 268, 368.
- [9] Horne K., 1986, PASP, 98, 609.
- [10] Kolb, U., Baraffe, I., 1999, Proceedings of the Warner Symposium on Cataclysmic Variables, eds. P.A. Charles, A.R. King, D.R. O’Donoghue, New Astronomy Reviews, in print.
- [11] Marcy, G. et al., 1987, PASP, 99, 490.
- [12] Marsh, T. R., Horne, K., 1988, MNRAS, 235, 269.
- [13] Marsh, T. R., Horne, K., 1990, ApJ, 349, 593.
- [14] Marsh, T. R., Robinson, E.L., Wood, J.H., 1994, MNRAS, 266, 137.
- [15] Marsh, T. R., Horne, K., Schlegel, E.M., Kaitchuck, R.H., 1990, ApJ, 364, 637.
- [16] Mattei, J. A., 1999, Observations from the AAVSO International Database, private communication.
- [17] Politano, M., 1996, ApJ, 465, 338.
- [18] Reimers, D., Griffin, R. F., Brown, A., 1988, A&A, 193, 180.
- [19] Ritter, H., Kolb, U., 1998, A&AS, 129, 83.
- [20] Robinson E. L., 1974, ApJ, 193, 191.
- [21] Schneider, D. P., Young, P., 1980, ApJ, 238, 955.
- [22] Smith, D.A., Dhillon, V. S., 1998, MNRAS, 301, 767.
- [23] Stover R. J., 1981, ApJ, 249, 673.
- [24] Stover R. J., Robinson E. L., Nather R. E., 1981, ApJ, 248, 696.
- [25] Stover R. J., Robinson E. L., Nather R. E., Montemayor T. J., 1980, Ap.J., 240, 597.
- [26] Tonry, J., Davis, M., 1979, AJ, 84, 1511.