Uniformity of V minus Near Infrared Color Evolution of Type Ia Supernovae, and Implications for Host Galaxy Extinction Determination
Abstract
From an analysis of SNe 1972E, 1980N, 1981B, 1981D, 1983R, 1998bu, 1999cl, and 1999cp we find that the intrinsic VK colors of Type Ia SNe of typical luminosity (i.e. with multi-color light curve shape (MLCS) parameter mag) suggest a uniform color curve. VK colors become bluer linearly with time from roughly one week before B-band maximum until one week after maximum, after which they redden linearly until four weeks after maximum. VH colors exhibit very similar color evolution. VJ colors exhibit slightly more complex evolution, with greater scatter. The existence of V minus near infrared color relations allows the construction of near infrared light curve templates that are an improvement on those of Elias et al. (1985).
We provide optical BVRI and infrared JHK photometry of the Type Ia supernovae 1999aa, 1999cl, and 1999cp. SN 1999aa is an overluminous “slow decliner” (with = 0.47 mag). SN 1999cp is a moderately bright SN unreddened in its host. SN 1999cl is extremely reddened in its host. The V minus near infrared colors of SN 1999cl yield AV = 2.01 0.11 mag. This leads to a distance for its host galaxy (M 88) in agreement with other distance measurements for members of the Virgo cluster.
Electronic mail: kevin, hastings, rest, stubbs@astro.washington.edu
karen, rmcmillan@apo.nmsu.edu
ariess@stsci.edu
1 Introduction
Type Ia supernovae (SNe, singular SN) have become recognized as one of the most significant standardizable candles for the determination of extragalactic distances (Suntzeff 2000, Leibundgut 2000, Burrows 2000). As was the case with Cepheids and RR Lyrae stars, much effort must be expended to calibrate any new standard candle. Even while we debate an absolute calibration, standardizable candles can be used as excellent relative distance indicators; this has been done for some time with Type Ia supernovae, and since Phillips (1993) identified the absolute magnitude-decline rate relation, observations of Type Ia SNe have progressed with a greater sense of direction.
Since absolute distance determinations are a primary goal, let us begin with the basics. In order to obtain the luminosity distance (in pc) to a celestial object from its brightness we must know three things: (1) an accurate apparent magnitude m of the object; (2) an estimate of the object’s absolute magnitude M; and (3) an estimate of any extinction along the line of sight. These four parameters are related by the standard equation:
| (1) |
where Aλ is the extinction in magnitudes. Each 0.1 mag error due to extinction, absolute magnitude, or apparent magnitude corresponds to a 5 percent error in the distance to the object. Thus, extinction is potentially a serious source of systematic errors in determining distances. The primary focus of this paper is to outline a method of determining the V-band extinction, AV, towards Type Ia supernovae. For a discussion of the absolute magnitudes see Meikle (2000).
As is well known, the extinction due to dust is an order of magnitude less in the infrared compared to optical wavelengths. While it is not new that a combination of optical and infrared data can be used to investigate extinction (Sneden et al. 1978), this is not yet routine for supernovae.
1.1 Apparent magnitudes
At present more than 100 supernovae are discovered each year.444See http://cfa-www.harvard.edu/iau/lists/RecentSupernovae.html . In 1998 the number of supernovae discovered was 160, given the naming scheme of the IAU Circulars. In 1999 there were 203 SNe announced, but three have been shown to be other than supernovae. In many cases a low redshift SN appears at a substantial angular distance from the galaxy or appears on a rather uniform swath of galaxy light. In these cases aperture photometry will give an accurate apparent magnitude for the supernova without contamination by other sources of photons. One can further justify the use of aperture photometry of a visible SN by obtaining an image of its host galaxy, for example, from the STSci Digital Sky Survey (http://archive.stsci.edu/dss/dss_form.html) to gauge how problematic the location of the SN is.
In many other cases, however, the supernova is superimposed on an arm or the core of a galaxy, or it could be a small angular distance from a bright foreground star in our Galaxy, so the best way to obtain the apparent magnitude of the SN by itself is to subtract a template image of the sky-without-supernova from the images of the sky-with-supernova. However, one usually does not have appropriately exposed images in all relevant filters of such a field before the SN has appeared. Thus, one must wait a year or longer to obtain the galaxy template images.
Other factors contribute to the random and systematic errors of the apparent magnitudes: the use of different filters; systematic differences in the standard stars observed; whether the data were obtained photographically, photoelectrically, or with CCD cameras; and whether one reduces CCD data with aperture photometry or point spread function (PSF) fitting. As Suntzeff (2000) points out, even data obtained at the same site with two instruments on two different telescopes, reduced by the same observer using the same local standards, can give significantly different results, owing to the non-stellar nature of SN spectra. All of these factors contribute to the error budget of our apparent magnitudes and our absolute magnitudes. Consequently, we include information in an Appendix relating to filters and transformation equations.
1.2 Absolute magnitudes
In order to know the absolute magnitudes of Type Ia SNe we need to observe a number of extinction-corrected Type Ia SNe in galaxies with known distances. Observations of Type Ia supernovae over the past decade have shown that while Type Ia SNe are not standard candles per se, they are standardizable candles, forming a single-parameter family.
Phillips (1993) and Hamuy et al. (1996) noted a relationship between the rate of decline of Type Ia SNe and their intrinsic luminosities, characterized by the number of magnitudes these objects decline in the first 15 days after B-band maximum (m15(B)). The Phillips relation shows that Type Ia SNe with smaller values of m15(B) are intrinsically more luminous. A typical value of m15(B) is 1.1 mag.
Riess, Press & Kirshner (1996a, hereafter RPK) and Riess et al. (1998) outlined the multi-color light curve shape (MLCS) method of fitting Type Ia SN photometry. The key parameter, which they call , is basically the number of magnitudes that a Type Ia SN is brighter than or fainter than some fiducial object. In other words, M MV(fiducial). Objects with mag are more luminous, rise and decline more slowly after maximum light; objects with mag are less luminous, rise and decline more rapidly.555We make reference in this paper to “slow decliners” and “fast decliners” and hope that no confusion arises as a result; in fact, there is a continuum of decline rates. Using Cepheid calibrations of a set of nearby SNe, Jha et al. (1999b) find MV = 19.34 0.17 for the fiducial Type Ia SN with mag. The MLCS method uses the data for up to four photometric bands (BVRI) and simultaneously gives the light curve solutions, the reddening along the line of sight to the SN (i.e. the sum of the reddening in our Galaxy and the reddening within the host galaxy), the time of maximum light,666Throughout this paper we shall define the time of maximum to be the B-band maximum; V-band maximum occurs about 2 days after B-band maximum. Time will be the number of days since B-band maximum. and the distance modulus of the SN.
A third method for characterizing the light curves of Type Ia SNe is the “stretch factor” method of Perlmutter et al. (1997). The stretch factor is used to broaden or narrow the rest-frame timescale of a template light curve. The Phillips parameter (m15(B)) and the stretch factor () are related (Perlmutter et al.) as follows:
| (2) |
Assumed in the stretch factor, which is used for B-band and V-band data (but not for R and I), is the notion that slow decliners are slow risers and vice versa.
All three empirical fitting methods are attempts to model the differences in light curve shape, attributable to a range of absolute magnitudes, which in turn are attributable to the details of the explosions giving rise to the various Type Ia SNe (Höflich & Khokhlov 1996; Nomoto, Iwamoto & Kishimoto 1997).
1.3 Interstellar reddening and absorption
If we have a sample of nearby Type Ia SNe which occurred at a significant angular distance from any spiral arms or the central bulges of the host galaxies, we might safely assume they were unreddened in their hosts, and that their BV colors are intrinsic to these objects. Schaefer (1995) noted that Type Ia SNe with “normal” spectra and/or decline rates have an intrinsic BV = 0.00 0.04 at maximum light. This would imply that if a Type Ia SN has an observed BV color at maximum light of, say, 0.20, then its color excess E(BV) A A 0.20 mag. Using the standard value of R AV / E(BV) = 3.1 (Sneden et al. 1978, Rieke & Lebofksy 1985), and assuming that dust in the host galaxy of a SN is the same as dust in our Galaxy (Riess, Press, & Kirshner 1996b), we can determine the V-band extinction to the object. With an estimate of the SN’s absolute magnitude from any of the three light curve fitting methods described above we can then determine the distance to the SN and its host galaxy.
RPK had as one of their motivations for MLCS that there was nearly a one magnitude range of apparent intrinsic color at maximum light for Type Ia SNe. Assuming that all Type Ia SNe have the same intrinsic color at maximum actually increases the scatter of the Hubble diagram. For example, observations of SN 1991bg (Leibundgut et al. 1993) and our own observations of SN 1999da (Krisciunas et al. 1999) show that these two “fast decliners” had BV 0.6 at the time of maximum light. “Slow decliners” such as SN 1991T (Lira et al. 1998) can have excess short wavelength (U-band and B-band) light. The MLCS method takes into account these differences in color to a large extent, and its prime advantage, as already stated, is that it uses the full BVRI data set to derive simultaneously AV, the intrinsic brightness/decline rate parameter , the distance, and the time of B-band maximum.
Lira (1995) and Phillips et al. (1999, in particular, their Fig. 1) have shown that all unreddened Type Ia SNe, no matter what their decline rates, have essentially the same BV color evolution from 30 to 90 days after V-band maximum. (This is also shown graphically by RPK.) Phillips et al. (1999) find
| (3) |
If Eq. 3 holds for all Type Ia SNe, then we may use it and accurate measurements of the observed BV color between 30 and 90 days after V-band maximum to determine E(BV). The primary drawback of Eq. 3 is that by the time a typical SN is one to three months past maximum its V-band light has dimmed by 1.5 to 3 mag and its B-band light has diminished 2.5 to 4 mag.
If we attempt to determine AV solely from B-band and V-band photometry, any errors in the adopted color excess E(BV) are scaled by R 3.1. More specifically, since AV = R E(BV), the uncertainty in AV will be given by:
| (4) |
Given the infrared selective extinction coefficients determined by Rieke & Lebofsky (1985) we use the following relationships between color excess and AV:
| (5) |
| (6) |
| (7) |
Fig. 1 shows graphically the advantage of determining AV from a combination of optical and infrared data. Consider the worst case scenario, that the coefficient on the left hand part of Eq. 7 is only known to 50 percent. Then AV = 1.126 0.072 E(VK). For the case of AV = 1.00 mag, E(VK) = 0.888 (solid line in Fig. 1). The dashed line in Fig. 1 is the best case scenario for optical data; it assumes RV = 3.1 0.1 and E(BV) = 0.323 to give AV = 1.00 mag. We know that RV is not a universal constant (Cardelli, Clayton, & Mathis 1989). Riess, Press, & Kirshner (1996b) find that the most appropriate value for a set of Type Ia SNe is RV = 2.55 0.3. In Fig. 1 the dotted line uses RV = 2.55 0.3 and E(BV) = 0.392 to give AV = 1.00 mag. We show below that the color excess E(VK) for “normal” Type Ia SNe can be determined to 0.1 mag or better.777Phillips et al. (1999) show in their Fig. 5 that except for the subluminous fast decliners, Type Ia SNe have very similar intrinsic colors B Vmax for a wide range of decline rates. It may not be long before Type Ia SNe are officially divided into three sub-classes, SN 1991T-like ones, “normal” ones, and SN 1991bg-like ones. See also Branch, Fisher, & Nugent (1993). While one can determine the BV color of a supernova to 0.02 mag, determining the color excess is another matter.
In this paper we shall show that V-band and infrared photometry (at J (1.2 m), H (1.65 m), and K (2.2 m)) can give us a good handle on AV without scaling up any errors by a factor as large as RV.
1.4 What data are available?
Very little infrared photometry has been published on Type Ia SNe. The canonical papers are by Elias et al. (1981, 1985). In their second paper (see their Fig. 7) these authors even note the small scatter ( 0.1 mag) in VK for four Type Ia SNe (1972E, 1980N, 1981B, and 1981D). Frogel et al. (1987) present much infrared data for SN 1986G, which was a highly reddened (E(B 0.6 mag) “atypical subluminous event” (Phillips et al. 1987, Meikle 2000).
Suntzeff et al. (1999) and Jha et al. (1999b) give optical data for SN 1998bu. Mayya, Puerari, & Kuhn (1998) and Jha et al. (1998b) give infrared data. Meikle & Hernandez (1999) show other infrared data in graphical form, while their data values are found in Meikle (2000) and will be discussed in full by Hernandez et al. (2000). The photometry of SN 1998bu comprises the first large infrared data set for a “normal” Type Ia SN which contains data before maximum. We note that the infrared data of Jha et al. (1999b) prior to B-band maximum are systematically fainter than the infrared data of Mayya et al. (1998) and Meikle (2000), by 0.1 mag or more. We do not address the issue of whose data might be systematically “in error” prior to maximum light. Perhaps the true uncertainties of their data are larger than the errors quoted.
Here we present optical BVRI and infrared JHK data on SNe 1999aa, 1999cl, 1999cp, including infrared data on two of the three before maximum.
We shall show that the VK color evolution of an ensemble of objects (SNe 1972E, 1980N, 1981B, 1981D, 1983R, 1998bu, 1999cl and 1999cp) suggests that there is a uniform color relationship for Type Ia SNe with a range of values. Since SNe 1972E, 1980N, 1983R, and 1999cp have suffered minimal reddening due to our Galaxy and in their host galaxies, we can use data for these objects and the data of supernovae that are reddened in their hosts to produce multi-dimensional global solutions for each color (VJ, VH, VK). We obtain, as a desired result of the analysis, the color excessses of each reddened object, which, with Eqs. 5 through 7, easily yield estimates of AV necessary for an accurate determination of the object’s distance.
2 Observations
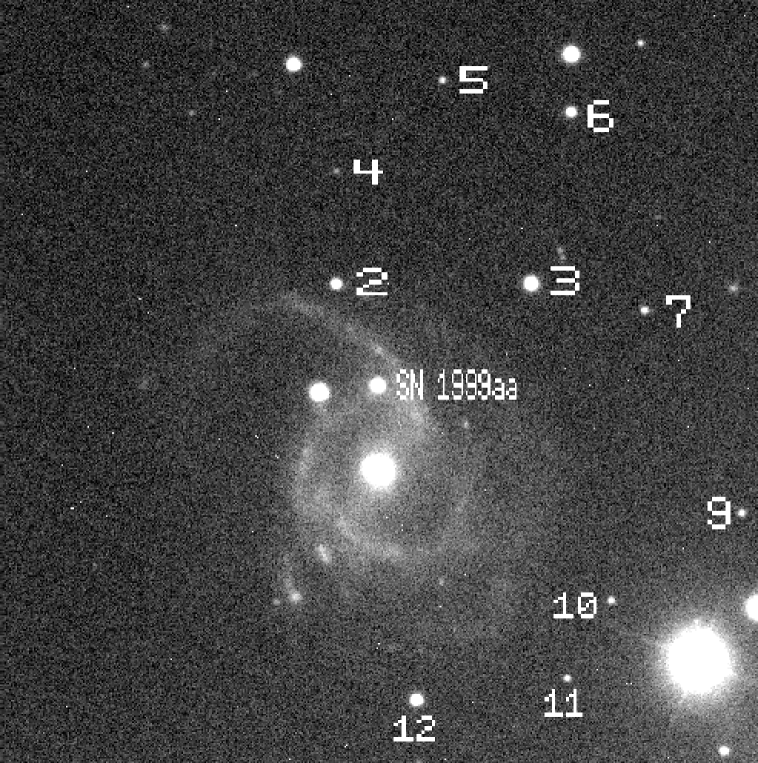
Supernova 1999aa in NGC 2595 was independently discovered with three different telescopes from 11 to 13 February 1999 UT (Arbour 1999; Qiao et al. 1999; Nakano & Kushida 1999). Filippenko, Li, & Leonard (1999) obtained a spectrum on 12 February UT and noted that it was a peculiar Type Ia supernova very similar to SN 1991T.
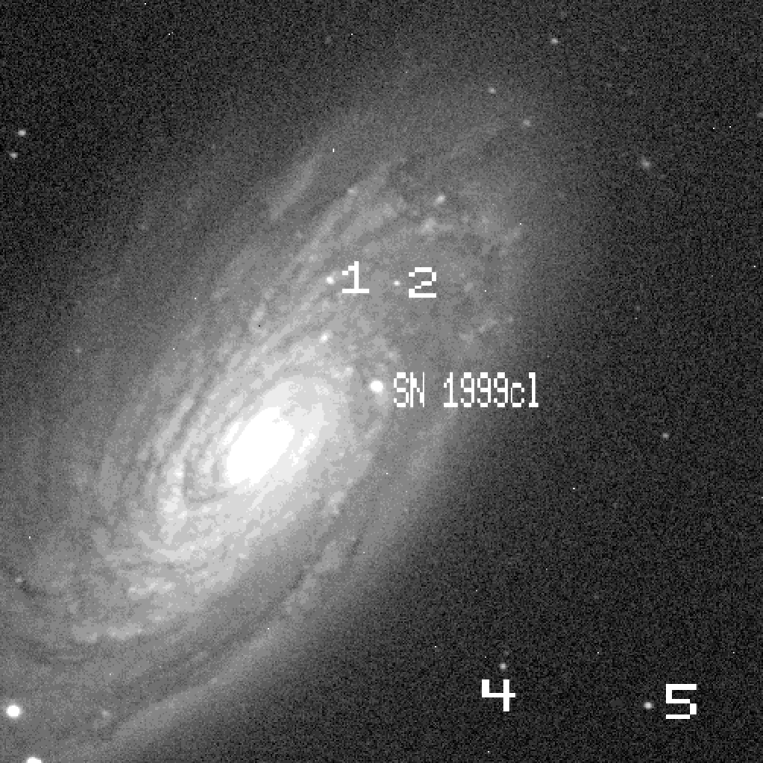
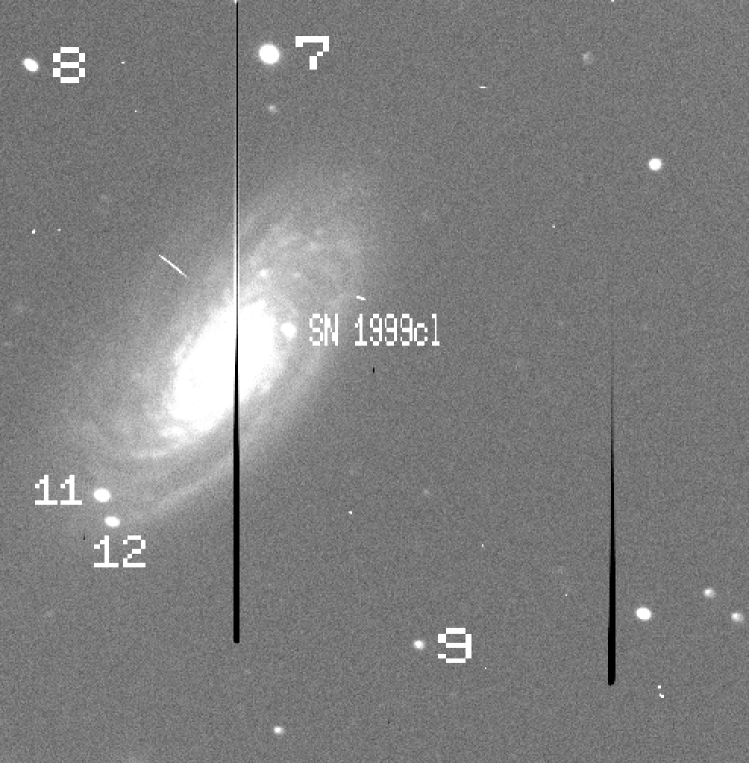
SN 1999cl was discovered by Papenkova et al. (1999) on 29 May 1999 UT, roughly 17 days (according to our subsequent analysis) before maximum. Spectra obtained on June 4.2 UT indicated that this SN was highly reddened by dust, with an approximate color excess of E(BV) = 1.0 mag (Garnavich et al. 1999). This SN occurred in NGC 4501 (= M 88), an SBb/Sc galaxy in the Virgo cluster (Tully 1988).
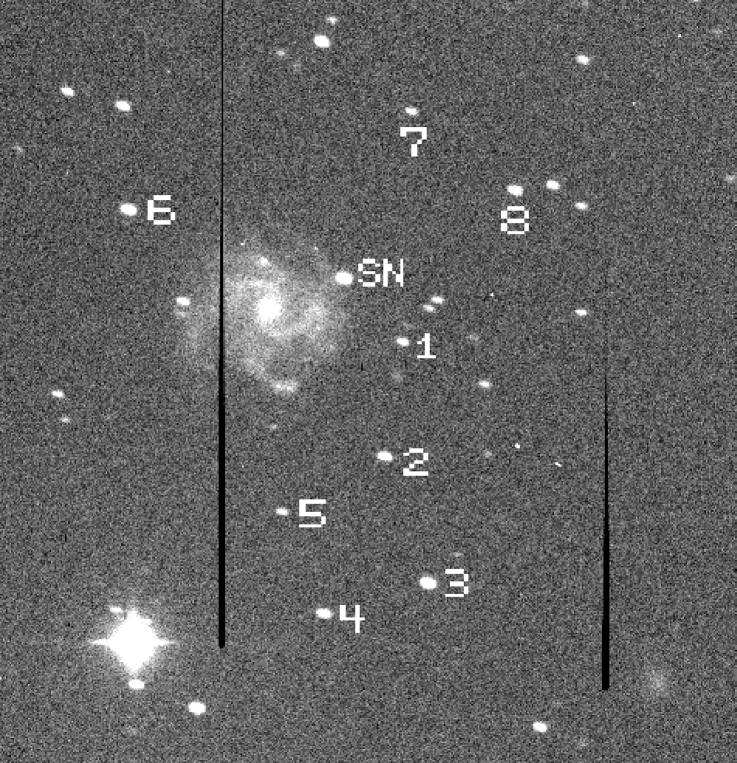
SN 1999cp in NGC 5468 was discovered by King & Li (1999) on 18 June UT. A spectrum by Jha et al. (1999a) indicated that it was a Type Ia SN well before maximum light.
We have obtained infrared photometry of these three SNe with the Apache Point Observatory (APO) 3.5-m telescope using GRIM II, which has a 256 256 pixel HgCdTe NICMOS-3 detector. We have obtained optical BVRI photometry with the APO 3.5-m using the CCD camera SPIcam, which contains a backside illuminated SITe 2048 2048 array. Additionally, we have obtained CCD photometry with the University of Washington’s Manastash Ridge Observatory (MRO) 0.76-m telescope using a 1024 1024 Ford Aerospace array. Further information on the filters and transformation coefficients is given in the Appendix.
We reduced all our CCD data with the iraf data reduction package. This first involved subtracting the bias frames, constructing sky flats with the median of three or more sky frames per filter per night, then flattening and trimming the frames. We determined the instrumental magnitudes as aperture magnitudes, using phot within the apphot package. Calibration of the data was done within the photcal package, in particular with mknobsfile, fitparams, and evalfit. The resulting aperture magnitudes were used to calculate differential magnitudes for each supernova in each filter, with respect to local secondary standards. These differential magnitudes were then converted to standardized V-band magnitudes and colors using appropriate values of the adopted magnitudes and colors of the secondary standards and the transformation coefficients.
As mentioned in §1.1, unless one has images in all relevant filters of the galaxy in question, one cannot carry out image subtraction photometry until template images are obtained a year or more after the explosion of a SN. From an inspection of STSci Digital Sky Survey images of the host galaxies of SNe 1999aa, 1999cl, and 1999cp we see no serious problems in carrying out aperture photometry of these objects. We agree, however, that images of the host galaxy of SN 1999cl in particular should be obtained in the future to determine if image subtraction significantly changes the data.
Our infrared data were reduced with a package of scripts written by Alan Diercks which runs in the iraf environment. This involved the application of a bad pixel mask, the subtraction of median dark frames, dividing by an appropriate sky flat for each filter, along with linearity corrections, bias corrections, and fitting a plane to the images to correct for any stray light. Since the raw images were dithered short exposures, the resulting frames had to be coadded to give adequate signal-to-noise. This was accomplished with Eugene Magnier’s program mana using appropriate scripts. Then aperture photometry was carried out with iraf.
The optical photometry is tied to standard stars of Landolt (1992). From data taken on multiple photometric nights we have derived photometric sequences in the field of each supernova (Figs. 2 through 5; Tables 1, 3 and 5). Using differential magnitudes of the field stars with respect to each other, we found no evidence for variability of the field stars to a level of constancy of 0.03 mag or better per night. Observations of the brighter field stars on the photometric nights can then give mean values which have very small internal errors.
Typically, we reduced the optical photometry of a SN with the magnitudes and colors of four demonstrably constant field stars near the SN; this usually included the brightest field stars as long as they were not extremely red, located near the edge of the array, or near cosmetic defects. Using secondary “standards” within the frame of a SN allows frames taken under non-photometric conditions to be used. Since the in-frame differential photometry was weighted by the reciprocals of the squares of the errors, the calibration of the SN photometry is primarily dependent on the brightest field stars used as local standards. Including several (or many) more faint field stars for the calibration does not significantly improve the results for the SN.
Our optical photometry of SNe 1999aa, 1999cl, and 1999cp are given in Tables 2, 4, and 6 (as nightly means). The uncertainties, given in parentheses, take into account the photon statistics of the raw data, the uncertainties of the V magnitudes and colors of the photometric sequences, and the uncertainties in the transformation coefficients to the BVRI system.
The infrared photometry of SNe 1999aa, 1999cl, and 1999cp given in Table 7 (as nightly means) are tied to standards of Hunt et al. (1998). Our K-band photometry was actually taken in a K′ filter, which has a shorter effective wavelength than the regular 2.2 m filter. Wainscoat & Cowie (1992), who designed this filter to give greater signal-to-noise ratios for infrared imaging, give the transformation: K K = (0.22 0.03) (HK). To reduce our data we first transformed the K-band values of the Hunt et al. standards used to K′. We then derived K′ values for our SNe. Finally, we transform those data using: K = 1.282 K 0.282 H. In the case of SN 1999aa we did not take H-band data, but used instead the mean HK vs. age relation given by Elias et al. (1985). At the time this object was observed, the implied differences of K and K′ were less than 0.02 mag.
One question naturally arises. How can we be sure that a photometric transformation applicable to regular stars is valid for SNe? We cannot be absolutely sure. The uncertainty applies to the BVRI data as well as the near infrared photometry. The spectra are not like a black body and evolve rapidly, and the SN 1991T-like slow decliners have spectra which are different than the more rapid decliners. But Type Ia SNe are considered to be in a photospheric phase until 25 days after B-band maximum, after which the optical light curves experience a bend. From +25 to +35 days the rapid decline of the light curve slows down into an exponential decline as the object enters the nebular phase (Jeffery et al. 1992; Bowers et al. 1997).
As in the case of the optical photometry, the infrared data were not always taken under photometric conditions. Sometimes it was necessary to use observations of field stars within the SN frames or the core of the host galaxy as secondary standards, whose magnitudes were fixed with observations of infrared standards on photometric nights. In the case of SN 1999aa, we used stars 2 and 3 of the NGC 2595 photometric sequence (Table 1). For star 2 we find J = 15.30 0.03, K′ = 14.94 0.04, and for star 3 we find J = 13.81 0.02, K′ = 13.43 0.03. For SN 1999cl we used the core of M 88 as a local standard. For a 5.7 arcsec diameter software aperture with the sky annulus of radius 4.7 to 6.6 arcsec we find J = 11.33 0.02, H = 10.52 0.02, K′ = 10.21 0.05. For SN 1999cp we find that star 1 of the NGC 5468 photometric sequence (Table 5) has J = 15.18 0.02, H = 14.85 0.03, K′ = 14.83 0.08. A second star 43 arcsec east and 18 arcsec north of star 1 has J = 15.65 0.02, H = 15.14 0.02, K′ = 14.83 0.07.
In addition to our own data for SN 1999aa, 1999cl, and 1999cp, we used optical photometry of SN 1972E (Ardeberg & de Groot 1983), 1980N and 1981D (Hamuy et al. 1991), 1981B (Buta & Turner 1983), 1983R (Tsvetkov 1988), and 1998bu (Jha et al. 1999b). Infrared photometry of these SNe is given by Elias et al. (1981, 1985), Mayya et al. (1998), Jha et al. (1999b), and Meikle (2000). We only use two nights’ infrared data for SN 1972E, nights on which the data were obtained with the Palomar 200-inch telescope; infrared data taken on other nights with a 0.6-m telescope are much less accurate. Optical photometry for these other objects can be fit with light curve templates derived with values ranging from 0.38 mag (for SN 1972E; Jha et al. 1999b) to +0.23 mag (for SN 1981D; MLCS fit to B-band and V-band data given by Hamuy et al. 1991).
One can construct V-band templates using the MLCS V-band vectors to determine what the likely V magnitude of a SN was at the times that any infrared data were taken. This is how we determined the VJ, VH, and VK colors of SNe 1999aa, 1999cl, 1999cp and the just-mentioned other SNe. Because of the smoothness of V-band light curves near the time of maximum light (see e.g. Riess et al. 1999), in many cases this V-band interpolation involves uncertainties conservatively estimated to be 0.03 to 0.05 mag.
3 Discussion
In Table 8 we give the MLCS fits to the optical photometry of SNe 1999aa, 1999cl, and 1999cp, along with values for other objects discussed in this paper. Since the range of for the updated MLCS method (Riess et al. 1998) is 0.5 to +0.5 mag, there is no extrapolation in -space involved in applying MLCS to these three objects.
SN 1999aa was an overluminous, slow decliner, with = 0.47 0.08 mag. This is in accord with the pre-maximum spectrum, which was similar to the canonical slow decliner SN 1991T (Lira et al. 1998; Filippenko et al. 1999). From a fourth order polynomial fit to the B-band data we find m15(B) = 0.746 0.024 mag. In a recent study of 22 Type Ia SNe Riess et al. (1999) found m15(B) values ranging from 0.86 to 1.93 mag. Thus SN 1999aa is one of the most slowly declining Type Ia SNe known, implying that it is one of most intrinsically bright. Peculiarities in its light curve at optical or infrared wavelengths might not necessarily affect our conclusions based on an ensemble of other objects. MLCS fitting indicates that SN 1999aa is unreddened in its host. The Schlegel et al. (1998) reddening model of our Galaxy indicates that SN 1999aa has been reddened by E(BV) = 0.04 mag by dust in our Galaxy.
MLCS fitting of the BVRI data of SN 1999cl indicates highly non-standard reddening for this object. Also, the late B-band and I-band data were roughly 0.3 mag brighter than the MLCS templates. One implication would be that the late-time infrared data may be “too bright” as well. Our photometry indicates that at the time of B-band maximum, the color of the SN was BV = 1.23 0.05. Given = +0.20 mag for this object, the implied intrinsic color at maximum light was BV = +0.09. Thus, the color excess is E(BV) 1.14 mag.
SN 1999cp is found to be a moderately overluminous object. We find 0.31 0.10 mag. It is unreddened in its host. The Galactic reddening at the coordinates of this object is E(B) = 0.025 mag (Schlegel et al. 1998).
In Figs. 6 through 8 we show the light curves for SNe 1999aa, 1999cl, and 1999cp. It can readily be seen that the V-band templates allow us to interpolate the V-band data such that we can obtain V some-infrared-magnitude at the time that infrared data were taken.
In Fig. 9 we show the V minus infrared colors for SNe 1972E, 1980N, 1981B, 1981D, 1983R, 1998bu, 1999cl, and 1999cp. The reader will note that the data for each color index arrange themselves in three bands. SNe 1972E, 1980N, 1981B, 1981D, 1983R, and 1999cp constitute, at first glance, one set of relatively unreddened objects, while SN 1998bu is one magnitude redder, and SN 1999cl is still redder.
SN 1972E has a host reddening of E(BV) = 0.01 0.03 mag according to Phillips et al. (1999) in effect, zero. SN 1983R is not well contrained at maximum light, but at times for which Eq. 3 holds, its BV color (after correcting for Galactic reddening) indicates that it is unreddened in its host. MLCS indicates that SN 1999cp is unreddened in its host. For SN 1980N Phillips et al. (1999) give a total color excess of E(BV) = 0.07 0.02 mag, of which 0.021 is due to our Galaxy. MLCS fits indicate that SN 1981B and 1981D have AV = 0.35 0.15 and AV = 0.44 0.22 mag, respectively. Phillips et al. (1999) give a total color excess for SN 1981B of E(BV) = 0.13 0.03 mag, while Phillips (private communication) indicates that E(BV) = 0.18 0.06 mag for SN 1981D.
Considering only the VK and VH data for the moment, the data are most easily fit by two line segments.888There is no a priori reason to assume that the color curve could be fit by two linear segments, but that is certainly the simplest approach to adopt. There exists some cross-over time when the slope of the color fit switches from negative to positive. Let us call this Tc. Then for Tc, VK = a0 + ai + b1 (Tc), and for Tc, VK = a0 + ai + b2 (Tc). Fits of the same form were made to the VH data. For VJ a non-linear fit (at least a second order polynomial) is warranted for Tc, so we have added a term c( Tc)2.
In order to treat the data as objectively as possible, we did not assign a priori special status to any object(s). We used pascal routines given by Bevington & Robinson (1992) and Marquardt’s method of carrying out a least-squares fit to an arbitrary function to minimize the values of the fits, assuming initial values of a0 for each color and solving simultaneously for the best common values of Tc, b1, b2, c and offsets (ai) from the fiducial loci one offset for each supernova. Note that the same reduced values are obtained for any other a0. Any shift in the value of a0 for the multi-dimensional fit for a given color shifts the resulting offsets ai by the same amount.
In Table 9 we give our fiducial loci and have scaled the uncertainties of the fit parameters by the square root of the reduced values of the global fits. We assert that by giving no special treatment to any individual object(s) and by scaling the uncertainties of the resultant fit parameters we make the most objective use of the whole data set.
The reduced values of the multi-dimensional fits are 18.2, 6.23, and 3.63, respectively, for VJ, VH, and VK. Thus, the data and our chosen fit functions indicate a sequence of “goodness of fit” as we proceed to subsequent V minus near infrared colors. That these reduced values are greater than unity indicates either that: (1) the photometric errors have been underestimated; (2) there is intrinsic scatter between objects; or (3) the fit functions were not appropriate.
In Fig. 10 we have compacted the data shown in Fig. 9, adjusting the data of all eight SNe by the derived offsets ai. This shows the scatter of data if all eight SNe had the mean colors of our fiducial loci. Another way to consider the goodness of fit of the data is to determine the root-mean-square residual of the data in Fig. 10 with respect to the fiducial loci. For VJ, VH, and VK, respectively, those rms uncertainties are 0.193, 0.105, and 0.090 mag. Since MLCS applied to optical data typically gives an uncertainty of 0.15 mag or more for AV, VH and VK photometry obtained at several epochs on the same object have the strong potential of giving more accurate AV values. As we have already shown in Fig. 1, for moderately to highly reddened SNe VK data will almost always give more accurate AV values than BV data.
In Table 10, column 2, we give the derived offsets ai for each of the eight “normal” Type Ia SNe. We did not scale the uncertainties of the ai values for a given color by the square root of the reduced value of the global fit. Rather, since different objects made different contributions per data point to the total sum, we scaled the uncertainties of the ai’s by the square root of for that object, but only if was greater than unity.
In column 3 of Table 10 we give the estimated Galactic reddening E(BV) from Schlegel et al. (1998). Using the scaling factors from Eqs. 5 through 7 and a value of RV = 3.1 we give in column 4 the expected color excesses E(VJ), E(VH), and E(VK) due to dust in our Galaxy. Finally, in column 5 we give the implied host reddening values (with respect to the fiducial loci), equal to the total reddening (in column 2) minus the Galactic reddening (in column 4).
Though any adopted values of a0 would give the same reduced values for the global fits, we have adopted particular values which establish not just fiducial loci, but unreddened loci. If we correct the a values for SN 1980N for the small amount of host reddening (E(BV) = 0.05 0.02 mag) given by Phillips et al. (1999), yielding a for this object, and if we let a = a for SNe 1972E, 1983R, and 1999cp, then the weighted means of the a values are all 0.00 0.03 based on these four objects, color by color.
Concerning SNe 1981B and 1981D, there is no evidence from VJHK analysis that these objects are reddened. This contradicts the implications of fits to BV(R) data mentioned above which indicate that they have non-zero reddening.
SNe 1980N and 1981D occurred in the same galaxy, thus they must have the same distance modulus. SN 1980N had an observed peak magnitude of Vmax = 12.43 0.03, while SN 1981D had Vmax = 12.41 0.03. Their values (see Table 8) were almost identically the same, implying that they had the same absolute magnitudes. Yet SN 1981D has been reddened in BV by 0.11 0.06 mag more than SN 1980N according to the analysis of Phillips et al. (1999) and Phillips (private communication). We must conclude either that there is some hidden systematic error in the B-band photometry of SN 1981D or that something other than reddening by dust can affect the color of a Type Ia SN (Tripp & Branch 1999).
Had we established the unreddened loci with the values of a for SNe 1972E, 1983R, 1999cp, 1981B, and 1981D, the zero points a0 would have to be changed less than 0.03 mag in order for the weighted means of a to be zero for VH and VK. The VJ colors are more problematic, and we believe the data may be showing evidence of scatter between different objects. Given the unresolved mystery of the implied host galaxy extinctions of SNe 1981B and 1981D, we feel it is better for now to fix the zero points of the unreddened loci via SNe 1972E, 1980N, 1983R, and 1999cp and to take new data on new objects.
In the case of SN 1998bu our derived color excesses and Eqs. 5 through 7 give AV = 1.038 0.166, 1.165 0.084, and 1.137 0.055 mag from the VJ, VH, and VK data, respectively.999Here, and in the discussion that follows, we assume a 20 percent uncertainty in the ratio of Aλ/AV for the infrared bands. These are estimates of the total V-band extinction, of which roughly 0.074 mag is due to dust in our Galaxy. The weighted mean of our three estimates is AV = 1.138 mag, with an uncertainty conservatively estimated to be equal to the smallest of the errors of the three estimates, or 0.055 mag. Jha et al. (1999b) obtain AV = 0.94 0.15 from MLCS fits of BVRI data; these authors also compared optical and infrared data of SN 1998bu to SNe 1980N, 1981D, and 1989B, much as we have done here, obtaining AV = 0.9 0.2. Suntzeff et al. (1999) adopt a Galactic reddening of E(BV) = 0.025 0.003 mag and obtain a host galaxy reddening of E(BV) = 0.34 0.03 mag. Assuming R 3.1 implies AV = 1.132 0.093 mag. Meikle (2000) adopts E(BV) = 0.35 0.03 mag for the total color excess, implying AV = 1.085 0.093 mag. Our value of AV for this supernova and an adopted color excess E(BV) = 0.358 0.030 mag gives RV = 3.18 0.31. Our VJHK analysis is in good agreement with the results based on BV photometry and a Galactic value of RV.
For SN 1999cl our derived color excesses give estimates of the total extinction AV = 2.003 0.407, 1.955 0.164, and 2.036 0.108 mag from the VJ, VH, and VK data, respectively. The weighted mean is AV = 2.011 0.108 mag (taking the most conservative estimate of the uncertainty). Since roughly 0.118 mag is due to our Galaxy, the implication is that the V-band extinction due to dust in the host galaxy is 1.89 mag.
As mentioned above, for SN 1999cl BV = 1.23 0.05 at = 0, and E(BV) 1.14 mag. If RV = 3.1 applies to this object, then AV = 3.53 mag, significantly different than our result of AV = 2.01 0.11. AV = 3.53 leads to a distance estimate for M 88 of 7.2 Mpc, clearly incorrect if it is in the Virgo cluster (see below). AV = 2.01 mag and RV = 3.1 would imply that E(BV) = 0.65 mag and that the intrinsic color of this SN at maximum light was BV = 0.58. However, that contradicts the implied intrinsic color at maximum light of BV = +0.09 for a SN with = +0.20 mag. Another alternative would be that RV = 2.01 / 1.14 1.8, which strikes us as unrealistic if the composition of the dust in M 88 is anything like that of dust in our Galaxy. Cardelli et al. (1989) indicate that RV can be as low as 2.60 in our Galaxy, while Riess et al. (1996b) give RV = 2.55 0.3 as the best reddening ratio applicable to a set of Type Ia SNe. RV 1.8 would mean very small dust grains that would highly redden the light. We conclude that M 88 either has very unusual dust, or that there is a second contributor to the observed color of SN 1999cl in addition to reddening by dust (Tripp & Branch 1999).
From the MLCS V-band fit for SN 1999cl we adopt Vmax = 13.68 0.08. = +0.20 mag implies that M19.14, for which we adopt an uncertainty of 0.3 mag. With AV = 2.01 0.11 mag, the implied distance modulus is mM = 30.81 0.33 mag. The distance to SN 1999cl and its host, M 88, is 14.5 Mpc.
For comparison let us derive a distance based on the infrared data and the calibration of absolute infrared magnitudes of SNe given by Meikle (2000), At = 13.75 days he gives MJ = 16.86 0.06, MH = 18.22 0.05, and MK = 18.23 0.05 for six “normal” Type Ia SNe (i.e. he has excluded the fast decliner SN 1986G and the slow decliner SN 1991T). We shall assume that SN 1999cl has infrared absolute magnitudes equal to the just-mentioned mean values, but with uncertainties of 0.15 mag. From an interpolation of our near-infrared photometry we estimate that SN 1999cl had J = 14.07 0.05, H = 12.93 0.05, K = 12.79 0.05 at = 13.75 days. Assuming AV = 2.01 0.11 and the coefficients in Eqs. 5 through 7, the corresponding extinctions would be AJ = 0.57, AH = 0.35, and AK = 0.23 mag, with uncertainties of 0.02 or more. The resulting estimates of the distance modulus are mM = 30.36, 30.80, and 30.79 mag (from J, H, and K), with uncertainties of 0.16 mag. Thus, the H and K data give a distance modulus of 30.8 mag, which can be compared to the value from MLCS (30.83 0.6:) and the value from VJHK analysis (30.81 0.33). The most likely values of the distance modulus, determined by means of different methods, agree very well. The prime uncertainty in the distance comes from the uncertainty in the absolute magnitude of SN 1999cl (be it MV or in the infrared).
Our estimate of the distance to M 88 agrees within the errors with modern estimates of the distance to the Virgo cluster (Pierce, McClure, & Racine 1992; Ferrarese et al. 1996; Gibson et al. 2000). Given that M 88 is 2.0 degrees from M 87 (which can be considered the core of the Virgo cluster), the projected distance of M 88 from M 87 is 0.5 Mpc. Thus, the derived distance and the angular proximity of M 88 to M 87 is consistent with M 88 being in the Virgo cluster.
What of overluminous, slowly declining SNe and underluminous, rapidly declining ones? In Fig. 11 we show the VJ and VK colors of SNe 1999aa, and also the VK colors of SN 1986G. Clearly, the data do not follow the photometry of “normal” Type Ia SNe in the mid-range of decline rates. Thus, we predict there will be different V minus near infrared color loci for Type Ia SNe of different intrinsic luminosities.
We note again the work of Tripp & Branch (1999, and references therein) on the question of a “second parameter” (i.e. a descriptor for Type Ia SNe in addition to the decline rate). SN models (Höflich & Khokhlov 1996; Nomoto et al. 1997) suggest that the luminous slow decliners may be double degenerate explosions; putting two logs in the fireplace can give a brighter fire that lasts longer. The second parameter may be related to the contribution of a particular species (such as cobalt, iron, or sulfur) to the opacity of the explosion (see Bowers et al. 1997). A second parameter might explain the very low values of RV obtained for SNe like 1999cl. It might also explain deviations from our color curves such as the late-type behavior of SN 1999cl and the early time behavior of SN 1991T, which exhibited a K-band “excess” of 1.5 mag at = 11.3 days (see Meikle 2000).
The existence of well behaved V-band light curves (e.g. from MLCS) and V minus infrared color relations implies the existence of infrared light curve templates. In Fig. 12 we show the predicted K-band light curve templates (good to 0.2 mag) for the range of implied by the unreddened locus in Fig. 10. In Fig. 13 we show the J-, H-, and K-band light curve templates for the fiducial Type Ia SN with = 0 mag. These infrared light curve templates are also listed in Table 11 and may be considered an improvement on those based solely on the data given by Elias et al. (1981, 1985). Figs. 12 and 13 also confirm what Meikle (2000) showed convincingly for the first time, that the near infrared flux peaks several days before B-band maximum.
4 Conclusions
Using new data and data from the literature, we have outlined a method for determining the V-band extinction towards Type Ia SNe. For SNe with mag there appears to be uniform evolution of V minus infrared colors from (at least) one week before B-band maximum until four weeks after B-band maximum. The slow decliner SN 1999aa (with = 0.47 mag) did not exhibit the same color evolution as eight other Type Ia SNe with faster decline rates.
If the V minus infrared color relations discussed here are “universal”, the implication is that one can determine AV for a normal Type Ia SN using an interpolated V-band light curve and a small amount of infrared photometry (H or K, but maybe not J) obtained between days. Analogous statements cannot be made for the very slow decliners like SN 1991T and the very fast decliners like SN 1991bg.
Our VJHK analysis of the moderately reddened SN 1998bu gives a value of AV = 1.14 0.06 mag, in excellent agreement with (and a possible improvement upon) the results from optical photometry alone.
We were led to consider this method for determining AV owing to the challenging case of SN 1999cl. The VJHK data available lead to a value of AV = 2.01 0.11 mag. Along with the V-band maximum and the implied absolute magnitude from the MLCS fits, we obtain a distance to this object of 14.5 Mpc, in reasonable agreement with modern estimates of the distance to the Virgo cluster.
We have several recommendations for future work: (1) We should obtain images of M 88 after SN 1999cl has sufficiently faded away so that image subtraction techniques can be used for this object. (2) Fast decliners (such as SN 1991bg and 1999da, which occurred in elliptical galaxies) should be observed in the infrared as well as the optical. (3) More unreddened slow decliners should be observed from one week (or more) before until four weeks after maximum light to see how their behavior differs from the more normal Type Ia SNe. Given that there are families of BVRI light curves, it would not be surprising if there are families of V minus infrared color curves. (4) The next generation of MLCS and other light curve fitting algorithms should use optical and infrared data.
References
- (1) Arbour, R. 1999, IAUC No. 7108
- (2) Ardeberg, A., & de Groot, M. 1983, A&A, 28, 295
- (3) Bevington, Phillip R., & Robinson, D. Keith 1992, Data Reduction and Error Analysis for the Physical Sciences, 2nd ed., New York: McGraw-Hill, p. 141 ff.
- (4) Bowers, E. J. C., Meikle, W. P. S., Geballe, T. R., et al. 1997, MNRAS, 290, 663
- (5) Branch, D., Fisher, A., & Nugent, P. 1993, AJ, 106, 2383
- (6) Burrows, A. 2000, Nature, 403, 727
- (7) Buta, R. J., & Turner, A. 1983, PASP, 95, 72
- (8) Cardelli, J. H., Clayton, G. C., & Mathis, J. S. 1989, ApJ, 345, 245
- (9) Elias, J. H., Frogel, J. A., Hackwell, J. A., & Persson, S. E. 1981, ApJ, 251, L13
- (10) Elias, J. H., Matthews, K., Neugebauer, G., & Persson, S. E. 1985, ApJ, 296, 379
- (11) Ferrarese, L., Freedman, W., Hill, R. J., et al. 1996, ApJ, 464, 568
- (12) Filippenko, A. V., Li, W. D., & Leonard, D. C. 1999, IAUC No. 7108
- (13) Frogel, J. A., Gregory, B., Kawara, K., Laney, D., Phillips, M. M., Terndrup, D., Vrba, F., and Whitford, A. E. 1987, ApJ, 315, L129
- (14) Garnavich, P., Jha, S., Kirshner, R., & Challis, P. 1999, IAUC No. 7190
- (15) Gibson, B. K., et al. 2000, ApJ, 529, 723
- (16) Hamuy, M., Phillips, M. M., Maza, J., Wischnjewsky, M., Uomoto, A., Landolt, A., & Khatwani, R. 1991, AJ, 102, 208
- (17) Hamuy, M., Phillips, M. M., Schommer, R. A., Suntzeff, N. B., Maza, J., & Avils, R. 1996, AJ, 112, 2391
- (18) Hernandez, M., et al. 2000, in preparation
- (19) Höflich, P., & Khokhlov, A. 1996, ApJ, 457, 500
- (20) Hunt, L. K., Mannucci, F., Testi, L., Migliorini, S., Stanga, R. M., Baffa, C., Lisi, F., & Vanzi, L. 1998, AJ, 115, 2594
- (21) Jeffery, D. J., Leibundgut, B., Kirshner, R. P., Benetti, S., Branch, D., & Sonneborn, G. 1992, ApJ, 397, 304
- (22) Jha, S., et al. 1999a, IAUC No. 7206
- (23) Jha, S., et al. 1999b, ApJS, 125, 73
- (24) King, J. Y., & Li, W. D. 1999, IAUC No. 7205
- (25) Krisciunas, K., et al. 1999, BAAS, 31, 1424
- (26) Landolt, A. U. 1992, AJ, 104, 340
- (27) Leibundgut, B., Kirshner, R. P., Phillips, M. M., et al. 1993, AJ, 105, 301
- (28) Leibundgut, B. 2000, Astron. Astrophys. Rev., in press (astro-ph/0003326)
- (29) Lira, P. 1995, Master’s thesis, Univ. of Chile
- (30) Lira, P., Suntzeff, N. B., Phillips, M. M., et al. 1998, AJ, 115, 234
- (31) Mayya, Y. D., Puerari, I., & Kuhn, O. 1998, IAUC No. 6907
- (32) Meikle, P. & Hernandez, M. 1999, J. Ital. Astron. Soc., in press (astro-ph/9902056)
- (33) Meikle, W. P. S. 2000, MNRAS, 314, 782
- (34) Nakano, S., & Kushida, R. 1999, IAUC No. 7109
- (35) Nomoto, K., Iwamoto, K., & Kishimoto, N. 1997, Science, 276, 1378
- (36) Papenkova, M., Filippenko, A. V., & Treffers, R. R. 1999, IAUC No. 7185
- (37) Perlmutter, S., Gabi, S., Goldhaber, G., et al. 1997, ApJ, 483, 565
- (38) Phillips, M. M., Phillips, A. C., Heathcote, S. R., et al. 1987, PASP, 99, 592
- (39) Phillips, M. M. 1993, ApJ, 413, L105
- (40) Phillips, M. M., Lira, P., Suntzeff, N. B., Schommer, R. A., Hamuy, M., & Maza, J. 1999, AJ, 118, 1766
- (41) Pierce, M. J., McClure, R. D., & Racine, R. 1992, ApJ, 393, 523
- (42) Qiao, Q. Y., Wei, J. Y., Qiu, Y. L., & Hu, J. Y. 1999, IAUC No. 7109
- (43) Rieke, G. H., & Lebofsky, M. J. 1985, ApJ, 288, 618
- (44) Riess, A. G., Press, W. H., & Kirshner, R. P. 1996a, ApJ, 473, 88 (RPK)
- (45) Riess, A. G., Press, W. H., & Kirshner, R. P. 1996b, ApJ, 473, 588
- (46) Riess, A. G., Filippenko, A. V., Challis, P., et al. 1998, AJ, 116, 1009
- (47) Riess, A. G., Kirshner, R. P., Schmidt, B. P., et al. 1999, AJ, 117, 707
- (48) Schaefer, B. E. 1995, ApJ, 450, L5
- (49) Schlegel, D. J., Finkbeiner, D. P., & Davis, M. 1998, ApJ, 500, 525
- (50) Sneden, C., Gehrz, R. D., Hackwell, J. A., York, D. G., & Snow, T. P. 1978, ApJ, 223, 168
- (51) Suntzeff, N. B., Phillips, M. M., Covarrubias, R., et al. 1999, AJ, 117, 1175
- (52) Suntzeff, N. B. 2000, astro-ph/0001248
- (53) Tripp, R., & Branch, D. 1999, ApJ, 525, 209
- (54) Tsvetkov, D. Yu. 1988, Sov. Astron., 32, 72
- (55) Tully, R. B. 1988, Nearby Galaxies Catalog, Cambridge Univ. Press
- (56) Wainscoat, R. J., & Cowie, L. L. 1992, AJ, 103, 332
- (57) Watson, A., Hereld, M., & Rauscher, B. 1997, GRIM II User’s Manual (see Appendix for web address)
| Star | (2000) | (2000) | V | BV | VR | VI |
|---|---|---|---|---|---|---|
| SN | 8:27:42.0 | +21:29:15 | ||||
| 2 | 8:27:43.3 | +21:29:52 | 16.762 (0.010) | 0.849 (0.015) | 0.434 (0.011) | 0.847 (0.012) |
| 3 | 8:27:38.2 | +21:29:55 | 15.079 (0.009) | 0.683 (0.010) | 0.373 (0.008) | 0.752 (0.008) |
| 4 | 8:27:43.4 | +21:30:34 | 20.039 (0.026) | 1.620 (0.108) | 1.170 (0.038) | 2.626 (0.023) |
| 5 | 8:27:40.7 | +21:31:08 | 18.979 (0.010) | 0.753 (0.018) | 0.423 (0.010) | 0.833 (0.014) |
| 6 | 8:27:37.3 | +21:30:58 | 16.624 (0.011) | 1.070 (0.012) | 0.592 (0.012) | 1.130 (0.011) |
| 7 | 8:27:35.2 | +21:29:47 | 18.484 (0.014) | 1.403 (0.021) | 0.809 (0.015) | 1.594 (0.014) |
| 9 | 8:27:32.5 | +21:28:34 | 18.425 (0.014) | 0.529 (0.019) | 0.298 (0.010) | 0.676 (0.016) |
| 10 | 8:27:35.7 | +21:28:00 | 18.516 (0.013) | 1.533 (0.022) | 0.984 (0.010) | 2.141 (0.013) |
| 11 | 8:27:36.9 | +21:27:31 | 18.737 (0.018) | 0.937 (0.019) | 0.493 (0.021) | 1.003 (0.015) |
| 12 | 8:27:40.8 | +21:27:22 | 15.792 (0.009) | 0.844 (0.011) | 0.453 (0.008) | 0.904 (0.009) |
| JD 2,451,000 | V | BV | VR | VI |
|---|---|---|---|---|
| 228.5901 | 14.980 (0.004) | 0.014 (0.005) | 0.057 (0.004) | 0.261 (0.004) |
| 234.6081 | 14.857 (0.004) | 0.077 (0.006) | 0.042 (0.006) | 0.442 (0.005) |
| 238.5953 | 14.925 (0.005) | 0.119 (0.007) | 0.062 (0.005) | 0.545 (0.006) |
| 240.6058 | 14.978 (0.004) | 0.149 (0.006) | 0.072 (0.007) | 0.542 (0.006) |
| 244.6252 | 15.189 (0.004) | 0.211 (0.004) | 0.133 (0.004) | 0.574 (0.004) |
| 249.5977 | 15.502 (0.004) | 0.420 (0.004) | 0.115 (0.004) | 0.383 (0.004) |
| 252.6033 | 15.650 (0.004) | 0.620 (0.004) | 0.020 (0.005) | 0.180 (0.004) |
| 257.6257 | 15.878 (0.003) | 0.912 (0.004) | 0.156 (0.004) | |
| 263.6145 | 16.151 (0.006) | 1.184 (0.014) | 0.312 (0.008) | 0.472 (0.013) |
| 265.6119 | 16.269 (0.005) | 1.150 (0.010) | 0.343 (0.005) | 0.571 (0.006) |
| 274.7846 | 16.767 (0.011) | 1.044 (0.086) | 0.533 (0.013) | |
| 275.6135 | 16.796 (0.004) | 1.057 (0.006) | 0.288 (0.006) | 0.525 (0.004) |
| 279.6524 | 16.934 (0.004) | 0.997 (0.005) | 0.265 (0.004) | 0.463 (0.005) |
| 318.6274 | 17.900 (0.014) | 0.530 (0.020) | 0.004 (0.021) | 0.187 (0.037) |
| 322.6412 | 18.050 (0.044) | 0.640 (0.053) | 0.052 (0.067) | 0.264 (0.060) |
| Star | (2000) | (2000) | V | BV | VR | VI |
|---|---|---|---|---|---|---|
| SN | 12:31:56.0 | +14:25:35 | ||||
| 1 | 12:31:57.2 | +14:26:15 | 17.372 (0.005) | 0.096 (0.003) | 0.107 (0.019) | 0.163 (0.015) |
| 2 | 12:31:55.5 | +14:26:13 | 18.450 (0.006) | 0.456 (0.007) | 0.302 (0.012) | 0.616 (0.021) |
| 4 | 12:31:52.8 | +14:23:52 | 19.234 (0.006) | 0.491 (0.012) | 0.323 (0.052) | 0.710 (0.011) |
| 5 | 12:31:49.1 | +14:23:38 | 18.584 (0.005) | 1.460 (0.021) | 0.929 (0.004) | 1.838 (0.009) |
| 7 | 12:31:57.1 | +14:28:52 | 11.879 (0.004) | 0.783 (0.020) | 0.448 (0.028) | 0.817 (0.050) |
| 8 | 12:32:08.8 | +14:28:44 | 14.687 (0.020) | 0.581 (0.030) | 0.405 (0.009) | 0.729 (0.011) |
| 9 | 12:31:49.4 | +14:21:48 | 16.293 (0.017) | 0.900 (0.078) | 0.547 (0.030) | 0.986 (0.032) |
| 11 | 12:32:05.2 | +14:23:34 | 13.628 (0.004) | 0.841 (0.008) | 0.538 (0.005) | 0.988 (0.005) |
| 12a | 12:32:04.7 | +14:23:16 | 14.970 (0.008) | 0.716 (0.022) | 0.467 (0.015) | 0.864 (0.017) |
| JD 2,451,000 | Observatory | V | BV | VR | VI |
|---|---|---|---|---|---|
| 336.6966 | APO | 14.215 (0.007) | 1.069 (0.011) | 0.630 (0.012) | 0.996 (0.014) |
| 337.7858 | APO | 14.138 (0.014) | 1.072 (0.020) | 0.560 (0.023) | 0.873 (0.025) |
| 339.7589 | MRO | 13.932 (0.008) | 1.157 (0.023) | 0.600 (0.016) | 0.919 (0.019) |
| 340.6926 | APO | 13.902 (0.006) | 1.127 (0.009) | 0.511 (0.009) | 0.772 (0.010) |
| 363.7404 | MRO | 14.604 (0.010) | 2.184 (0.071) | 0.780 (0.015) | 1.455 (0.016) |
| 365.7448 | MRO | 14.727 (0.008) | 2.027 (0.037) | 0.828 (0.015) | 1.566 (0.017) |
| 367.7305 | MRO | 14.768 (0.018) | 2.033 (0.177) | 0.784 (0.025) | 1.647 (0.024) |
| 368.7221 | MRO | 14.936 (0.023) | 2.029 (0.105) | 0.934 (0.033) | 1.717 (0.032) |
| Star | (2000) | (2000) | V | BV | VR | VI |
|---|---|---|---|---|---|---|
| SN | 14:06:31.3 | 5:26:49 | ||||
| 1 | 14:06:28.6 | 5:27:33 | 16.356 (0.005) | 0.525 (0.016) | 0.356 (0.004) | 0.670 (0.005) |
| 2 | 14:06:29.4 | 5:28:54 | 15.124 (0.018) | 0.133 (0.006) | 0.132 (0.004) | 0.271 (0.004) |
| 3 | 14:06:27.3 | 5:30:23 | 14.474 (0.010) | 0.534 (0.010) | 0.355 (0.007) | 0.720 (0.008) |
| 4 | 14:06:32.3 | 5:30:45 | 15.255 (0.010) | 0.626 (0.010) | 0.399 (0.012) | |
| 5 | 14:06:34.3 | 5:29:33 | 16.715 (0.020) | 0.610 (0.020) | 0.421 (0.047) | 0.856 (0.055) |
| 6 | 14:06:41.6 | 5:26:00 | 14.617 (0.010) | 0.961 (0.010) | 0.577 (0.007) | 1.075 (0.008) |
| 7 | 14:06:28.2 | 5:24:51 | 16.739 (0.043) | 1.044 (0.044) | 0.606 (0.006) | 1.136 (0.006) |
| 8 | 14:06:23.4 | 5:25:46 | 15.340 (0.004) | 0.706 (0.008) | 0.432 (0.004) | 0.792 (0.004) |
| JD 2,451,000 | Observatory | V | BV | VR | VI |
|---|---|---|---|---|---|
| 355.7334 | MRO | 14.671 (0.016) | 0.116 (0.044) | 0.127 (0.020) | 0.088 (0.023) |
| 365.7721 | MRO | 14.045 (0.005) | 0.006 (0.008) | 0.023 (0.007) | 0.401 (0.013) |
| 367.7459 | MRO | 14.099 (0.011) | 0.100 (0.024) | 0.034 (0.014) | 0.412 (0.018) |
| 368.7429 | MRO | 14.125 (0.008) | 0.078 (0.015) | 0.024 (0.009) | 0.494 (0.015) |
| 383.6373 | APO | 14.939 (0.004) | 0.621 (0.006) | 0.003 (0.003) | 0.136 (0.004) |
| Object | JD 2,451,000 | J | H | K |
|---|---|---|---|---|
| SN 1999aa | 239.82 | 16.28 (0.04) | 15.78 (0.07) | |
| 244.82a | 17.10 (0.08) | |||
| 252.72a | 17.00 (0.06) | 15.90 (0.05) | ||
| 259.59a | 16.87 (0.04) | 15.96 (0.05) | ||
| SN 1999cl | 337.67 | 12.96 (0.02) | 12.74 (0.02) | |
| 340.65 | 12.80 (0.02) | 12.98 (0.02) | 12.58 (0.02) | |
| 341.68 | 12.89 (0.02) | 13.02 (0.02) | 12.59 (0.02) | |
| 351.78b | 14.27 (0.04) | 13.29 (0.04) | 13.11 (0.06) | |
| 360.63 | 14.01 (0.02) | 12.84 (0.02) | 12.70 (0.03) | |
| 367.62b | 13.49 (0.04) | 12.77 (0.04) | 12.77 (0.05) | |
| SN 1999cp | 354.81 | 14.88 (0.03) | 15.04 (0.07) | 14.94 (0.15) |
| 360.67c | 14.50 (0.02) | 14.77 (0.02) | 14.57 (0.06) |
| Object | T(Bmax)a | MV | AV | mM | Refsb | |
|---|---|---|---|---|---|---|
| SN 1972E | 41447.5(1.0) | 0.38(0.13) | 19.80(0.29) | 0.15(0.15) | 28.08(0.26) | 1 |
| SN 1980N | 44586.5(0.5) | +0.20(0.20) | 19.14(0.20) | 0.22(0.06) | 31.44(0.32) | 2,3,4 |
| SN 1981B | 44672.0(0.2) | 0.34(0.18) | 19.46(0.23) | 0.35(0.15) | 31.10(0.13) | 1 |
| SN 1981D | 44680.5(0.5) | +0.23(0.20) | 19.11(0.20) | 0.44(0.22) | 31.03(0.30) | 4 |
| SN 1983Rc | 45607.0(3.0) | 0.20 | 0.23 | 4 | ||
| SN 1998bu | 50952.8(0.8) | +0.02(0.18) | 19.42(0.22) | 0.94(0.15) | 30.37(0.12) | 1 |
| SN 1999aa | 51232.37(0.23) | 0.47(0.08) | 19.80(0.15) | 0.00(0.15) | 34.53(0.16) | 4 |
| SN 1999cld | 51345.02(0.20) | +0.20(0.3:) | 19.14(0.3:) | 2.00(0.5:) | 30.83(0.6:) | 4 |
| SN 1999cp | 51363.62(0.28) | 0.31(0.10) | 19.65(0.10) | 0.00(0.12) | 33.56(0.13) | 4 |
| Color | Tc | |||||
|---|---|---|---|---|---|---|
| VJ | 1.879 | 9.52(72) | 0.1733(0328) | 0.00420(00179) | 0.0851(0123) | 18.2 |
| VH | 1.189 | 5.19(46) | 0.0613(0083) | 0.0 | 0.0840(0042) | 6.23 |
| VK | 0.986 | 6.44(50) | 0.0465(0056) | 0.0 | 0.0683(0036) | 3.63 |
| Object | ai | E(BV)b | E(V[J, H, or K]) | a |
|---|---|---|---|---|
| VJ: | ||||
| SN 1972E | 0.186(0.118) | 0.056(0.006) | 0.125(0.012) | 0.311(0.118) |
| SN 1980N | 0.208(0.032) | 0.021(0.002) | 0.047(0.005) | 0.161(0.032) |
| SN 1983R | 0.065(0.125) | 0.074(0.007) | 0.165(0.016) | 0.230(0.126) |
| SN 1999cp | 0.091(0.043) | 0.025(0.003) | 0.056(0.006) | 0.035(0.043) |
| SN 1981B | 0.235(0.113) | 0.018(0.002) | 0.040(0.004) | 0.275(0.113) |
| SN 1981D | 0.155(0.053) | 0.021(0.002) | 0.047(0.005) | 0.202(0.053) |
| SN 1998bu | 0.745(0.103) | 0.024(0.002) | 0.053(0.005) | 0.692(0.103) |
| SN 1999cl | 1.438(0.269) | 0.038(0.004) | 0.085(0.008) | 1.353(0.269) |
| VH: | ||||
| SN 1972E | 0.040(0.065) | 0.056(0.006) | 0.143(0.014) | 0.103(0.066) |
| SN 1980N | 0.182(0.054) | 0.021(0.002) | 0.054(0.005) | 0.128(0.054) |
| SN 1983R | 0.070(0.089) | 0.074(0.007) | 0.189(0.019) | 0.119(0.091) |
| SN 1999cp | 0.129(0.042) | 0.025(0.003) | 0.064(0.006) | 0.065(0.042) |
| SN 1981B | 0.034(0.039) | 0.018(0.002) | 0.046(0.005) | 0.080(0.039) |
| SN 1981D | 0.086(0.037) | 0.021(0.002) | 0.054(0.005) | 0.033(0.038) |
| SN 1998bu | 0.961(0.056) | 0.024(0.002) | 0.061(0.006) | 0.899(0.057) |
| SN 1999cl | 1.613(0.116) | 0.038(0.004) | 0.097(0.010) | 1.516(0.116) |
| VK: | ||||
| SN 1972E | 0.094(0.065) | 0.056(0.006) | 0.154(0.015) | 0.061(0.067) |
| SN 1980N | 0.120(0.033) | 0.021(0.002) | 0.058(0.006) | 0.062(0.033) |
| SN 1983R | 0.255(0.099) | 0.074(0.007) | 0.204(0.020) | 0.051(0.101) |
| SN 1999cp | 0.185(0.067) | 0.025(0.003) | 0.069(0.007) | 0.116(0.067) |
| SN 1981B | 0.066(0.044) | 0.018(0.002) | 0.050(0.005) | 0.016(0.044) |
| SN 1981D | 0.052(0.038) | 0.021(0.002) | 0.058(0.006) | 0.109(0.039) |
| SN 1998bu | 1.010(0.041) | 0.024(0.002) | 0.066(0.007) | 0.944(0.042) |
| SN 1999cl | 1.808(0.084) | 0.038(0.004) | 0.105(0.010) | 1.703(0.084) |
| MJ | MH | MK | MK | MK | |
|---|---|---|---|---|---|
| : | 0.0 | 0.0 | 0.38 | 0.0 | +0.23 |
| 9.0 | 18.403 | 18.195 | 18.655 | 18.246 | 18.033 |
| 8.0 | 18.540 | 18.293 | 18.768 | 18.359 | 18.146 |
| 7.0 | 18.641 | 18.363 | 18.852 | 18.443 | 18.230 |
| 6.0 | 18.733 | 18.432 | 18.937 | 18.528 | 18.315 |
| 5.0 | 18.836 | 18.521 | 19.040 | 18.631 | 18.419 |
| 4.0 | 18.859 | 18.538 | 19.072 | 18.663 | 18.450 |
| 3.0 | 18.858 | 18.539 | 19.088 | 18.679 | 18.466 |
| 2.0 | 18.835 | 18.528 | 19.092 | 18.683 | 18.465 |
| 1.0 | 18.793 | 18.505 | 19.078 | 18.674 | 18.448 |
| 0.0 | 18.730 | 18.469 | 19.050 | 18.654 | 18.420 |
| 1.0 | 18.647 | 18.423 | 19.010 | 18.622 | 18.385 |
| 2.0 | 18.546 | 18.367 | 18.966 | 18.581 | 18.343 |
| 3.0 | 18.427 | 18.300 | 18.918 | 18.529 | 18.290 |
| 4.0 | 18.291 | 18.226 | 18.867 | 18.470 | 18.224 |
| 5.0 | 18.138 | 18.143 | 18.806 | 18.401 | 18.145 |
| 6.0 | 17.969 | 18.170 | 18.738 | 18.326 | 18.059 |
| 7.0 | 17.785 | 18.218 | 18.723 | 18.307 | 18.032 |
| 8.0 | 17.587 | 18.260 | 18.756 | 18.334 | 18.053 |
| 9.0 | 17.376 | 18.298 | 18.784 | 18.356 | 18.067 |
| 10.0 | 17.278 | 18.331 | 18.811 | 18.373 | 18.075 |
| 11.0 | 17.309 | 18.361 | 18.835 | 18.388 | 18.080 |
| 12.0 | 17.337 | 18.388 | 18.854 | 18.399 | 18.080 |
| 13.0 | 17.363 | 18.413 | 18.870 | 18.408 | 18.081 |
| 14.0 | 17.389 | 18.437 | 18.886 | 18.417 | 18.080 |
| 15.0 | 17.413 | 18.460 | 18.901 | 18.424 | 18.078 |
| 16.0 | 17.436 | 18.482 | 18.915 | 18.430 | 18.074 |
| 17.0 | 17.459 | 18.504 | 18.926 | 18.437 | 18.068 |
| 18.0 | 17.482 | 18.526 | 18.933 | 18.443 | 18.064 |
| 19.0 | 17.506 | 18.549 | 18.945 | 18.450 | 18.059 |
| 20.0 | 17.530 | 18.572 | 18.961 | 18.458 | 18.057 |
| 21.0 | 17.553 | 18.594 | 18.977 | 18.464 | 18.056 |
| 22.0 | 17.578 | 18.618 | 18.995 | 18.472 | 18.057 |
| 23.0 | 17.603 | 18.642 | 19.014 | 18.481 | 18.059 |
| 24.0 | 17.628 | 18.666 | 19.031 | 18.489 | 18.060 |
| 25.0 | 17.653 | 18.690 | 19.048 | 18.497 | 18.059 |
| 26.0 | 17.679 | 18.715 | 19.065 | 18.507 | 18.058 |
| 27.0 | 17.706 | 18.740 | 19.080 | 18.516 | 18.060 |
| Telescope | Applied to | ||||
|---|---|---|---|---|---|
| APO | 99aa | +0.035(2) | 0.968(5) | 1.044(6) | 1.023(3) |
| APO | 99cl, 99cp | +0.038(2) | 0.967(3) | 1.057(6) | 1.020(2) |
| MRO | 99cl, 99cp | +0.036(4) | 1.068(9) | 1.030(9) | 1.024(14) |