Extragalactic Spectroscopy with SIRTF/IRS \toctitleExtragalactic Spectroscopy with SIRTF/IRS 11institutetext: Cornell University, Ithaca NY 14853, USA
*
Abstract
The Infrared Spectrograph (IRS) is one of the three instruments on board the Space Infrared Telescope Facility (SIRTF) to be launched in December 2001. The IRS will provide high resolution spectra (R600) from 10–37 m and low resolution spectra (R60) from 5–40 m. Its high sensitivity and “spectral mapping”-mode make it a powerful instrument for observing both faint point-like and extended sources. We discuss the performance of the IRS on faint extragalactic targets and present simulated spectra of starbursts and AGNs at high redshift. In addition, we discuss the determination of redshifts from the low resolution spectra.
1 The Infrared Spectrograph
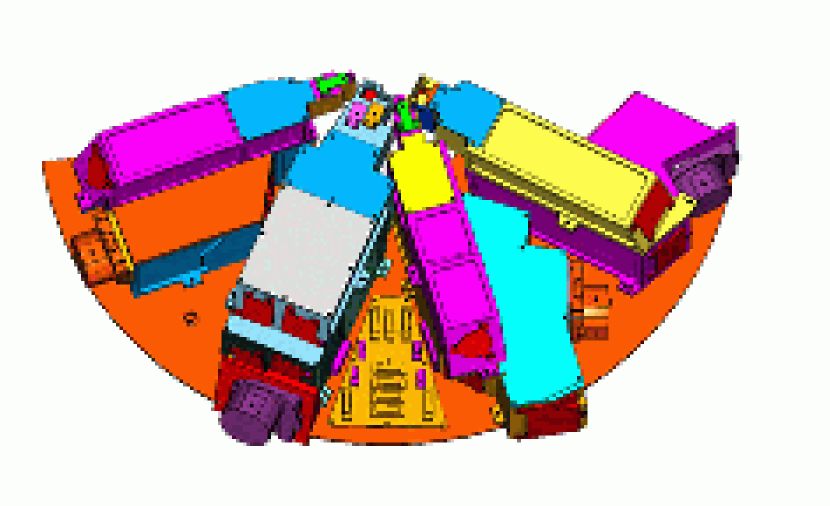
The Infrared Spectrograph (IRS) (Houck & van Cleve, 1995) will provide the Space Infrared Telescope Facility (SIRTF) (Fanson et al. 1998) with low and moderate-spectral resolution spectroscopic capabilities from 4 to 40 microns. The IRS (see Fig. 1) is composed of four separate modules, with two of the modules providing R50 spectral resolution over 4 to 40 microns and two modules providing R600 spectral resolution over 10 to 37 microns.
| Module | Detector | Pixel Size | Slit Size | Resolving | |
|---|---|---|---|---|---|
| (128128) | (arcsec) | (arcsec) | (m) | Power (R) | |
| Short Low | Si:As | 1.8 | 3.654.5 | 5.3 – 7.5 | 62-124 |
| ” | ” | ” | ” | 7.5 – 14 | ” |
| Long Low | Si:Sb | 4.8 | 9.7145.4 | 14 – 21 | 62-124 |
| ” | ” | ” | ” | 21 – 40 | ” |
| Short High | Si:As | 2.4 | 4.812.1 | 10 – 19.5 | 600 |
| Long High | Si:Sb | 4.8 | 9.724.2 | 19 – 37 | 600 |
The IRS instrument has no moving parts (“bolt-and-go” philosophy). Each module has its own entrance slit in the focal plane. The low-resolution modules employ long slit designs that allow both spectral and one-dimensional spatial information to be acquired simultaneously on the same detector array. Two small imaging sub-arrays (“peak-up cameras”) in the so-called short-low module (SL) will also allow infrared objects with poorly known positions to be accurately placed into any of the IRS modules’ entrance slits. The high-resolution modules use a cross-dispersed echelle design that gives both spectral and spatial measurements on the same detector array.
2 The IRS Sensitivity
The expected sensitivity of IRS is nearly 10 to 100 times better than that of the Infrared Space Observatory. The theoretical sensitivity plots for the four modules are presented in figures 2 and 3.
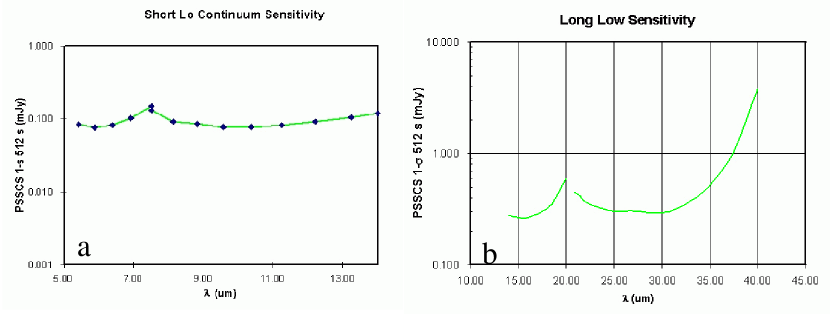
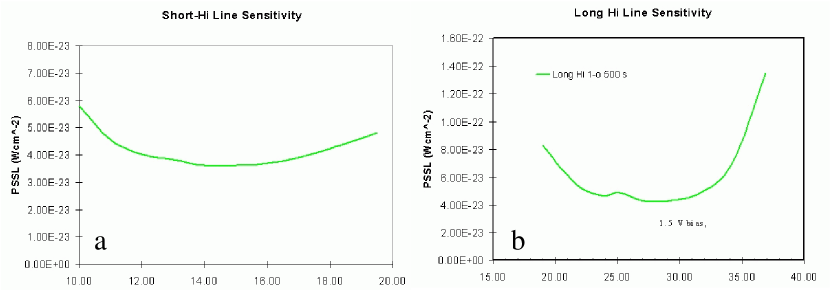
The continuum point source (5, 500 seconds) sensitivity of the low resolution module is 1 mJy at 10 m. The line sensitivity of the high resolution module is 310-18 Wm-2 at 15 m. The two peak-up cameras have a sensitivity of about 0.5 mJy.
The saturation limits in 8 seconds for point (extended) sources are 5 Jy (0.4 Jy arcsec-2) at 10 m for the low resolution module and 50 Jy (2.1 Jy arcsec-2) at 15 m for the high resolution module. The 4 s saturation limits for the peak-up cameras are 0.5 Jy for point sources and 40 mJy arcsec-2 for extended sources.
3 Extragalactic Science
Two of the main areas of extragalactic research where the IRS will be able to make substantial contributions will be the mid-IR deep surveys as well as the study of the properties of Luminous Infrared Galaxies (LIRGs). LIRGs have been studied since the early 70s, but their importance became evident in 1983 when IRAS revealed tens of thousands of such infrared galaxies galaxies (i.e., Sanders & Mirabel 1996). More recently ISO mid-IR deep surveys (i.e., Elbaz et al. 1999) have shown that the number of galaxies in the distant Universe exceeds model estimates which were derived from optical observations. These mid-IR surveys suggest a strong evolution in galaxy formation, such that more - and perhaps more luminous - galaxies were formed at earlier epochs.
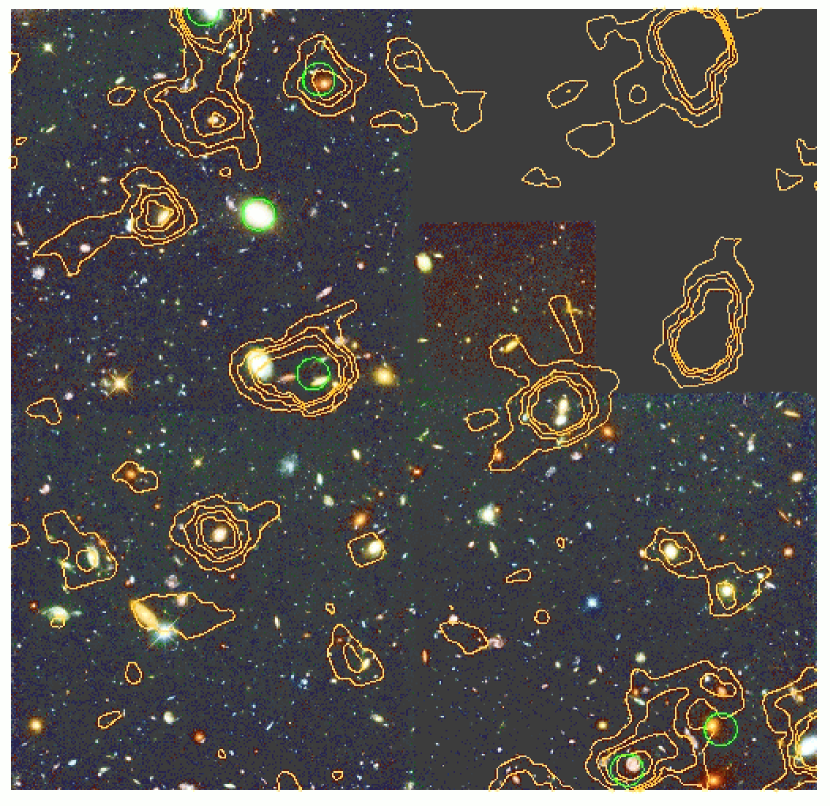
As one can clearly see in Fig. 4 the optical identification of the galaxies with detected mid-IR emission is ambiguous since the spatial resolution in the mid-IR is about an order of magnitude inferior to what can be achieved in the optical.
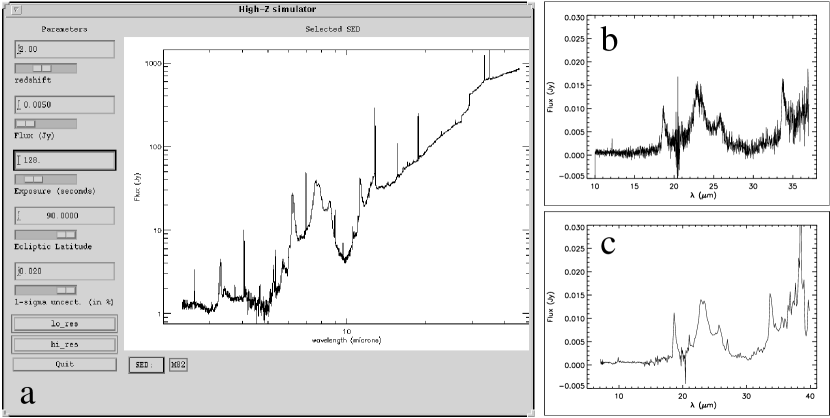
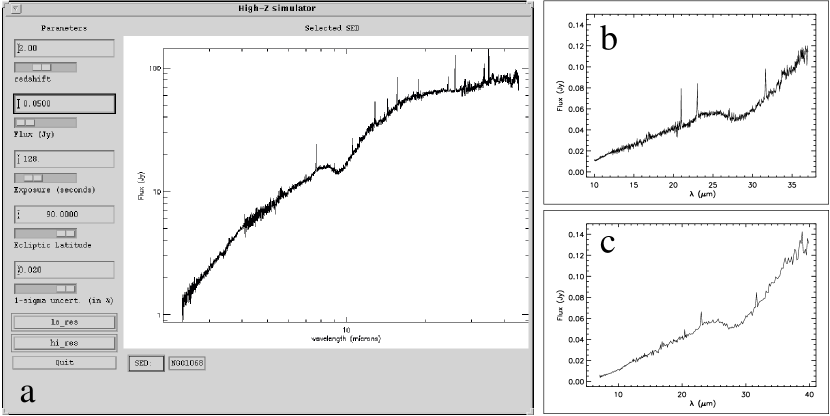
The combination of superior sensitivity and good spatial resolution of the IRS will make it possible to obtain m low-resolution mid-IR spectra of faint sources in relatively short integration times. The distinct spectrum of the mid-IR emission features at 6.2, 7.7 8.6 and 11.3 m, as well as the presence of the silicate absorption band at 9.7m (restframe wavelengths), can be used to directly derive redshifts of individual sources as faint as 0.5 mJy. For illustration we show the simulated IRS spectra of a prototypical starburst (M 82) and active galactic nucleus (NGC 1068) at a redshift of 2 in Fig. 5 and Fig. 6. Please note that the fluxes of the template spectra have been normalized to user-specified values which may differ from the fluxes of M 82 and NGC 1068 if they were at a redshift of . Also note that the specified time is the integration time per module while the full m is covered by two modules with two settings each.
4 Conclusions
The approach presented here provides an unbiased method of deriving directly the number counts of obscured star forming galaxies as a function of redshift to a few tenths of a mJy. Moreover, deep imaging surveys with SIRTF or even beyond will reveal the mid/far-IR colors that can be used for photometric redshift determinations of the faintest IR galaxies. The IRS observations will provide an important calibration sample for these surveys.
More information on the IRS can be found at the following Web-sites:
http://astrosun.tn.cornell.edu/SIRTF/irshome.htm
http://sirtf.caltech.edu/Observing/obs_frame.html.
Acknowledgements
We’d like to thank Dan Weedman and Jeffrey Wolovitz for providing the basis
of the IRS simulator program, Jeffrey van Cleve for the sensitivity plots
and Eckhard Sturm for providing the ISO-SWS data on M 82 and NGC 1068
prior to publication.
References
- [1] Aussel, H., Cesarsky, C. J., Elbaz, D., Starck, J. L. (1999) ISOCAM observations of the Hubble Deep Field reduced with the PRETI method. A&A, 342, 313–336.
- [2] Elbaz, D. et al. (1999) Source Counts from the 15 microns ISOCAM Deep Surveys. A&A, (in press) (astro-ph/9910406).
- [3] Fanson, J.L., G. Fazio, J.R. Houck, T. Kelly, G.H. Rieke, D.J. Tenerelli, M. Whitten (1998) Space Infrared Telescope Facility (SIRTF). Proc. SPIE Vol. 3356, 478–491.
- [4] Houck, J.R. & J.E. van Cleve (1995) IRS: An infrared spectrograph for SIRTF. Proc. SPIE Vol. 2475, 456–463.
- [5] Sanders, D.B., Mirabel, I.F. (1996) Luminous Infrared galaxies. ARA&A, 34 749–792.