The COINS Sample – VLBA Identifications of Compact Symmetric Objects
Abstract
We present results of multifrequency polarimetric VLBA observations of 34 compact radio sources. The observations are part of a large survey undertaken to identify CSOs Observed in the Northern Sky (COINS). Compact Symmetric Objects (CSOs) are of particular interest in the study of the physics and evolution of active galaxies. Based on VLBI continuum surveys of 2000 compact radio sources, we have defined a sample of 52 CSOs and CSO candidates. In this paper, we identify 18 previously known CSOs, and introduce 33 new CSO candidates. We present continuum images at several frequencies and, where possible, images of the polarized flux density and spectral index distributions for the 33 new candidates and one previously known but unconfirmed source. We find evidence to support the inclusion of 10 of these condidates into the class of CSOs. Thirteen candidates, including the previously unconfirmed source, have been ruled out. Eleven sources require further investigation. The addition of the 10 new confirmed CSOs increases the size of this class of objects by 50%.
1 Introduction
Compact Symmetric Objects (CSOs) are compact (1 kpc) sources with lobe emission on both sides of an active core (Wilkinson et al. 1994). The study of these objects is of particular interest because the small size of the CSOs is thought to be attributable to the youth of the source itself (ages 103 – 104 yr), rather than its confinement by a dense medium (Readhead et al. 1996a). Unifying evolutionary models have been proposed (Readhead et al. 1996b, Fanti et al. 1995) whereby these CSOs evolve into Compact Steep Spectrum (CSS) sources, and then into Fanaroff-Riley (1974) Type II objects.
Recent studies have shown that the majority of detections of Hi absorption in galaxies has been in CSOs and Steep Spectrum Core (SSC) objects (Conway 1996; Peck et al. 1999), rather than core-dominated radio sources. Of the theories proposed to explain this difference, the existence of a circumnuclear disk or torus structure seems the most likely. In this scenario, it is the orientation and geometry of the sources which is the cause of the discrepancy. The core-dominated sources are oriented close to the line of sight and the jets are comprised of extremely high velocity outflow. This causes the approaching jet to be strongly Doppler boosted, while the counterjet is Doppler dimmed. In CSOs, on the other hand, most of the continuum emission is not beamed, and thus the counterjet can contain up to half of the flux density of the radio source. Obscuration by a circumnuclear torus can then be seen against this counterjet, and if the structure has a significant fraction of atomic gas, Hi absorption can be expected (Conway & Blanco 1995). In some cases (e.g. 1946+708 – Peck, Taylor & Conway 1999) free-free absorption provides further evidence of a dense circumnuclear torus.
Another benefit of studying sources oriented at small angles to the plane of the sky is that in some cases jet velocities can be measured for both the jet and counterjet. Under the assumption that components are ejected simultaneously from the central engine, observations of proper motions can provide a direct measure of the distance to a source, and constraints can be placed on the value of H0 (Taylor & Vermeulen 1997).
Unfortunately, only a few CSOs have been studied to date. In these few CSOs, the kinematics of the atomic hydrogen seen in absorption on parsec scales is intriguing, but complicated. It is clear that a more comprehensive sample is required to fully understand the nature of the circumnuclear gas in these objects. The CSOs Observed in the Northern Sky (COINS) sample, defined in §2, is an attempt to identify a larger sample of CSOs which can be comprehensively studied using VLBI techniques. Here we identify 18 previously know CSOs, listed in Table 1. Hi absorption studies toward several of these are currently underway, with 4 yielding published detections. Table 1 also lists 33 new and one previously known but unconfirmed, CSO candidates. In §3 we describe multi-frequency VLBI polarimetric follow-up observations of sources in the COINS sample. Results are presented in §4 and discussed in §5. Future papers will address bidirectional jet motions and free-free absorption in the COINS sample. Before Hi absorption studies can be undertaken, optical spectroscopy is required to determine the redshifts of the sources. The current status of the source redshifts, and Hi absorption studies, is given in Peck et al. (1999).
2 Sample Selection Criteria
The class of Compact Symmetric Objects are distinguished from other compact radio sources by their high degree of symmetry. An explanation for this symmetry is that CSOs tend to lie close to the plane of the sky. For this reason, relativistic beaming plays a minor role in their observed properties, resulting in little continuum variability (Wilkinson et al. 1994). They usually have well-defined lobes and edge-brightened hotspots on either side of an active core, often exhibiting a striking ”S” shaped symmetry (Taylor, Readhead, & Pearson 1996a).
Since CSOs are rare (2% of compact objects, see §5), it is necessary to start with large VLBI surveys and go to moderately low flux density levels (100 mJy at 5 GHz) in order to obtain the 52 CSO candidates that make up the COINS sample. The sources in the COINS sample have been identified based on images in the Pearson-Readhead (PR; Pearson & Readhead 1988), Caltech-Jodrell Bank (CJ; Polatidis et al. 1995; Taylor et al. 1994) and VLBA Calibrator (VCS; Peck & Beasley 1998) Surveys. The sources in the VCS were primarily selected from the Jodrell Bank-VLA Astrometric Survey (JVAS; Patnaik et al. 1992).
The sources in the COINS sample are described in Table 1. Column (1) lists the J2000 convention source name of the CSO candidate. Column (2) provides an alternate name, with those prefaced by PR or CJ indicating selection from that survey. Columns (3) and (4) list the RA and Declination of the source in J2000 coordinates, and column (5) shows the optical identification of the source.
The 19 sources chosen from the PR and CJ surveys were selected based on criteria described in Readhead et al. (1996a) and in Taylor et al. (1996a). In brief, an initial selection of objects was made having (1) at 5 GHz a nearly equal double structure or (2) extended emission on either side of a strong unresolved component. These identifications are reasonably secure although it is possible further observations could eliminate one or two sources. The remaining 33 candidates were selected from the VCS, and the follow-up observations are described below. The VCS is an on-going project to image 2000 sources at 2.7 and 8.4 GHz for use as VLBI phase-reference calibrators. These sources, (in the declination 30° to +90° range) have been observed for 3 minutes at both frequencies, and the images are available on the World Wide Web at http://magnolia.nrao.edu/vlba_calib/. The sources in this study were selected from images of the 1500 positive declination sources in the VCS. The CSO candidates were identified based on at least one of the following criteria: a) double structure at 2.7 GHz, 8.4 GHz or both, where “double structure” is considered to mean having two distinct components with an intensity ratio ; b) a strong central component with possible extended structure on both sides at one or both frequencies; c) possible edge-brightening of one or more components.
3 Observations and Analysis
Observations of the sources selected from the PR and CJ surveys are reported in Readhead et al. (1996) and in Taylor et al. (1996a,1996b). The 33 remaining candidates listed in Table 1 which were chosen from the VCS were observed as described here along with 1 candidate CSO from the CJ survey.
The followup observations were made with the 10 element VLBA and a single VLA antenna, and consisted of 2 observations of 24 hours each. The first of these took place on 1997 December 28 (1997.99) when 22 sources were observed for 15 minutes each at 8.4 GHz, and 10 of these having a peak flux 100 mJy at 8 GHz in the VCS were also observed at 15 GHz for 55 minutes each. The time spent on each source was divided into 7 scans which were spread out in hour angle to obtain good (u,v) coverage. The second observation took place on 1998 March 16 (1998.21). The remaining 12 candidates were observed for 15 minutes each at 8.4 GHz, and 17 candidates were also observed at 5 GHz for 25 minutes each. In addition, 3 weak sources, (having peak fluxes at 8 GHz 40 mJy in the VCS), as well as one source which was found to be very weak at 15 GHz and one which was found to have extended emission, were observed at 1.6 GHz for 25 minutes each.
At all frequencies, right and left circular polarizations were recorded using 2 bit sampling with a total bandwidth of 8 MHz. Amplitude calibration was derived using the measurements of antenna gain and system temperature recorded at each antenna, and refined using the calibrator 3C 279 (1253055). Global fringe fitting was performed using the AIPS task FRING with the following solution intervals; 7 minutes (for the 15 GHz data), 6 minutes (8 GHz & 5 GHz), and 5 minutes (1.6 GHz). In both sets of observations, the versatile calibrator source 3C 279 was also used for bandpass calibration and polarization calibration. Following the application of all calibration solutions in AIPS, the data were averaged in frequency to a single channel. Editing, imaging and deconvolution were then performed using Difmap (Shepherd, Pearson, & Taylor 1995). Details of each image, including the restoring beam, peak, and rms noise, are given in Tables 2 and 4. Flux densities of the various components in each source were estimated by fitting elliptical Gaussian models to the self-calibrated visibility data using Difmap.
4 Results
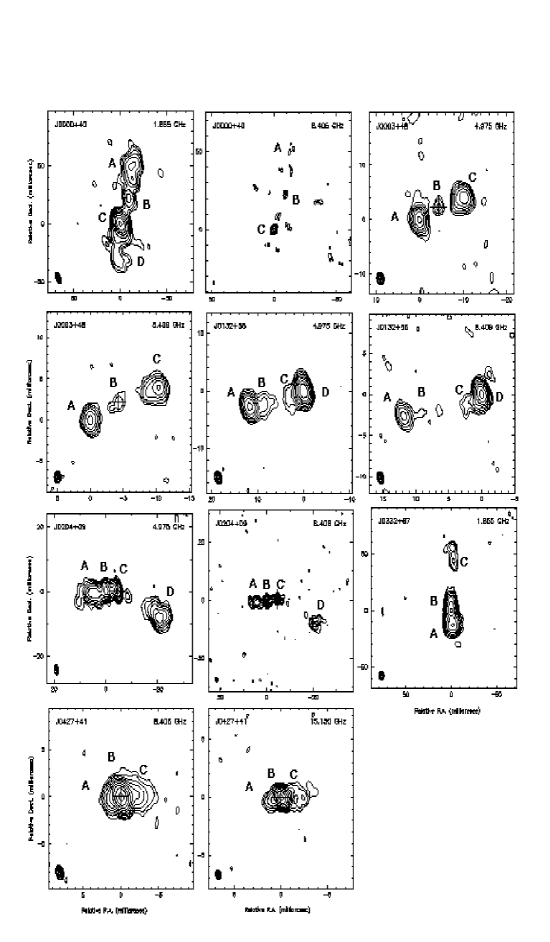
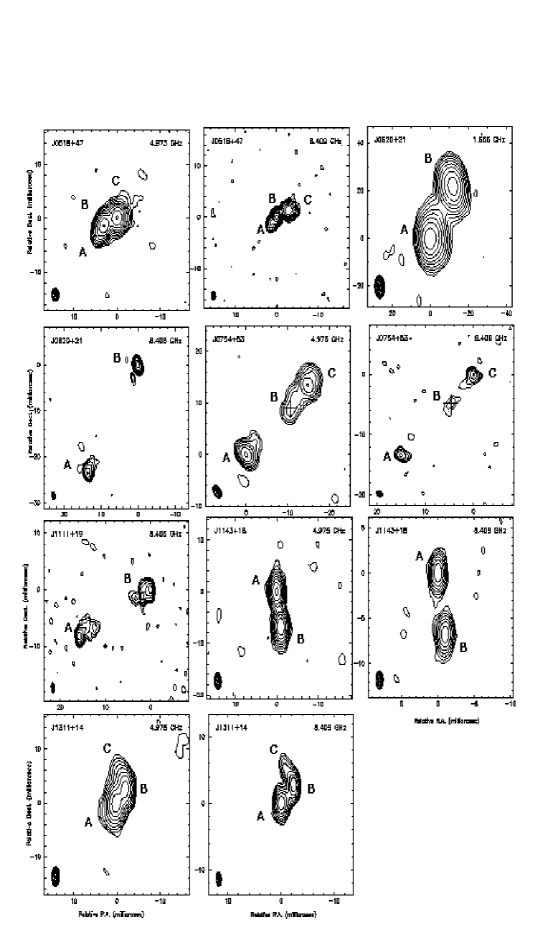
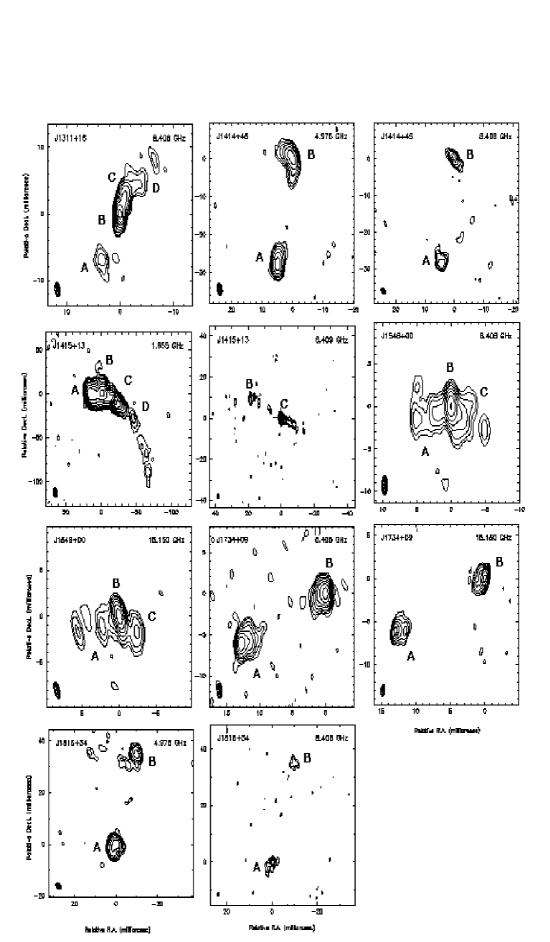
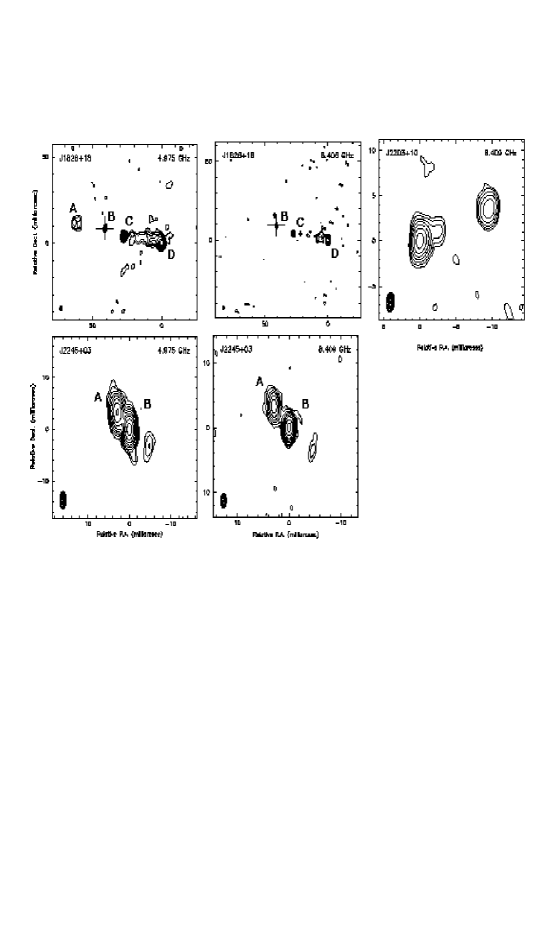
Positive identification of CSOs is contingent upon acquiring multi-frequency observations in order to correctly identify the core of the source, which is expected to have a strongly inverted spectrum (Taylor et al. 1996a). This eliminates any asymmetric core-jet sources in which a compact jet component might appear similar to the core component at the discovery frequency. We have attempted to pinpoint the location of the core component for each source using the criteria of (1) a flat or inverted spectrum; (2) compactness; and (3) low fractional polarization. When extended emission (jets, hot-spots or lobes) are found on both sides of the core we classify the object as a CSO. When the core component is found to be at an extreme end of the source it is rejected as a CSO, and when no core component can be reliably identified the source is retained as a candidate CSO.
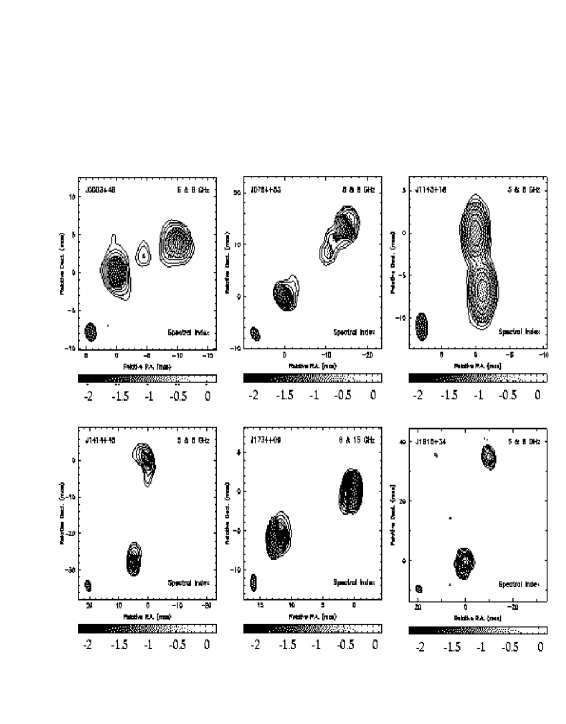
Images of the sources selected from the VCS which are deemed CSOs or CSO candidates are shown in Figure 1. Where possible, the core component has been identified with a cross. The frequency of the image shown is indicated in the upper right corner of each plot, and the beam is displayed in the lower left. Image parameters are outlined in Table 2. The last column in Table 2 indicates which sources can most reliably be identified as CSOs. The spectral index distributions for six of the newly identified CSOs are shown in Figure 2.
Table 3 lists the flux densities of each component at all frequencies at which follow-up observations were made. Column (1) lists the J2000 convention source name of the CSO candidate. Column (2) lists each component as identified in Figure 1. Columns (3) through (6) indicate the total flux density of each component, in mJy/beam, at 1.6, 5, 8.4, and 15 GHz respectively. The spectral indices for each component between 5 and 8.4 GHz are shown in column (7) and those between 8.4 and 15 GHz in column (8). Spectral indices between 1.6 GHz and other available frequencies were not calculated because the large differences in angular resolution and () coverage would render the results unreliable. Upper limits on polarized flux density at 8.4 GHz are shown (in mJy/beam) in column (9).
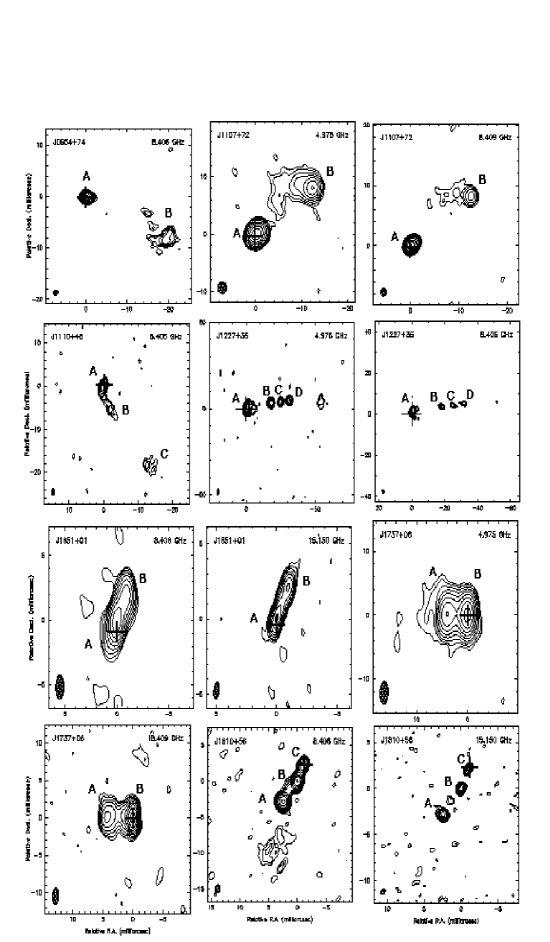
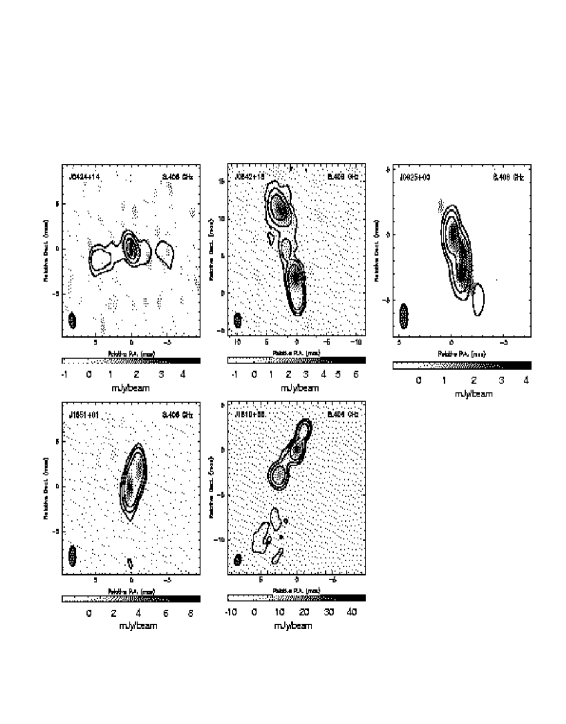
Images of the sources which have been determined not to be CSOs are shown in Figure 3. The frequency of the image shown is indicated in the upper right corner of each plot, and the beam is displayed in the lower left. Image parameters are outlined in Table 4. The flux densities of the components are detailed in Table 5, which is organized in the same manner as Table 3 above. Column (9) indicates the peak polarized flux for source components in which this was measurable, and gives an upper limit for the rest. Images of the polarized flux density in the 5 sources with significant detections are shown in Figure 4. The polarized flux is shown in grayscale, with contours from the 8 GHz continuum image superposed.
5 Discussion
5.1 The Incidence of CSOs
In the surveys we find the incidence of CSOs is 7/65 (11%) in PR, 18/411 (4.4%) in PR+CJ, and 39/1900 (2.1%) in PR+CJ+VCS. The main difference between these samples is the parent sample flux limit at 5 GHz which goes from 1.3 Jy in PR, to 0.35 Jy in CJ to 100 mJy in the VCS. Although the parent VLBI samples have somewhat different selection criteria, making it difficult to assess the significance of the difference in incidence, there does appear to be a trend to a lower CSO incidence among fainter sources. Complicating matters further, however, is the fact that since both the coverage and sensitivity of the VCS are considerably worse than the PR and CJ surveys, it is possible that some CSOs have been missed in the VCS. Data quality in the CJ survey was generally better than that from the earlier PR survey since many more telescopes were available.
5.2 Depolarization by the circumnuclear torus
Despite the fact that synchrotron emission is intrinsically polarized up to 70% (Burn 1966), less than 0.5% fractional polarization is seen in low resolution studies of CSOs at frequencies up to 5 GHz (Pearson & Readhead 1988, Taylor et al. 1996b). Even going to high resolution, Cawthorne et al. (1993) found less than 4 mJy of polarized flux (non-detections) at 5 GHz in the PR CSOs J0111+3906 and J2355+4950. In Table 3 we present limits on the polarized flux density at 8.4 GHz and 1 mas resolution for 21 CSOs and candidates in the COINS sample. In general our 3 limits on polarized flux density are less than 1.2 mJy/beam. These correspond to typical limits on the fractional polarization of 1%, and in stronger components to as low as 0.3%. These results are in sharp contrast to the fractional polarization of 1–20% typically seen in the jets of most compact sources (see Cawthorne et al. 1993 and our Table 5).
One possible explanation for the low observed linear polarization from CSOs is that their radiation is depolarized as it passes through a magnetized plasma associated with the circumnuclear torus. In order to depolarize the radio emission within our 8 MHz IF at 8.4 GHz the Faraday rotation measures could be larger than 5 105 radians m-2, or alternatively the magnetic fields in the torus could be tangled on scales smaller than the telescope beam of 1 mas to produce gradients of 1000 radian m-2 mas-1 or more.
6 Summary
From the 33 sources initially selected from the VLBA Calibrator Survey, we find 10 sources which we can securely classify as Compact Symmetric Objects. Thirteen sources, including one previously unconfirmed candidate from the CJ sample, have been ruled out based on morphology, spectral index and polarization. Eleven of the original VCS sources require further investigation.
Once the redshifts of the remaining newly identified CSOs can be determined, extensive high spatial and spectral resolution studies of the neutral hydrogen, as well as the radio continuum and ionized gas distribution, will be undertaken. A complete sample of such sources will yield unique information about accretion processes and the fueling mechanism by which these young radio galaxies might evolve into much larger FRII type sources. Future observations of CSOs identified in the COINS sample will also be used to measure bi-directional motions and employ them as cosmological probes. Studies of the hot spot advance speeds in the COINS sample should eventually yield kinematic age estimates for the sources and further advance our understanding of the evolution of radio galaxies.
Finally, it is worth mentioning that CSOs are often useful calibrators since they are compact, fairly constant in total flux density, and have very low polarized flux density.
References
- (1)
- (2) Burn, B. F. 1966, MNRAS, 133, 67
- (3)
- (4) Cawthorne, T. V., Wardle, J. F. C., Roberts, D. H., Gabuzda, D. C., & Brown, L. F. 1993, ApJ, 416, 496
- (5)
- (6) Conway, J. E. & Blanco P. R. 1995, ApJ, 449, L131
- (7)
- (8) Conway, J. E. 1996, in The Second Workshop on Gighertz Peaked Spectrum and Compact Steep Spectrum Radio Sources, eds. I. A. G. Snellen, R. T. Schilizzi, H. J. A. Rottgering and M. N. Bremer [Leiden Observatory], 198
- (9)
- (10) Fanaroff, B. L., & Riley, J. M. 1974, MNRAS, 167, 31P
- (11)
- (12) Fanti, C., Fanti, R., Dallacasa, D., Schilizzi, R. T., Spencer, R. E. & Stanghellini, C. 1995, A&A, 302, 317
- (13)
- (14) Patnaik, A. R., Browne, I. W. A., Wilkinson, P. N., & Wrobel, J. M. 1992, MNRAS, 254, 655
- (15)
- (16) Pearson, T. J., & Readhead, A. C. S. 1988, ApJ, 328, 114
- (17)
- (18) Peck, A. B. & Beasley, A. J. 1998, in IAU Colloquium 164: Radio Emission from Galactic and Extragalactic Compact Sources eds. J. A. Zensus, G. B. Taylor and J. M. Wrobel (PASP: San Francisco), Vol. 144, p. 155
- (19)
- (20) Peck, A. B., Taylor, G. B., & Conway, J. E. 1999, ApJ, 521, 103
- (21)
- (22) Peck, A. B., Taylor, G. B., Fassnacht, C. D., Readhead, A. C. S., & Vermeulen, R. C. 1999, ApJ, submitted
- (23)
- (24) Polatidis, A. G., Wilkinson, P. N., Xu, W., Readhead, A. C. S., Pearson, T. J., Taylor, G. B., & Vermeulen, R. C. 1995, ApJS, 98, 1
- (25)
- (26) Readhead, A. C. S., Taylor, G. B, Xu, W., Pearson, T. J., Wilkinson, P. N. & Polatidis, A. G. 1996a, ApJ, 460, 612
- (27)
- (28) Readhead, A. C. S., Taylor, G. B, Pearson, T. J., & Wilkinson, P. N. 1996b, ApJ, 460, 634
- (29)
- (30) Shepherd, M. C., Pearson, T. J., & Taylor, G. B. 1995, BAAS, 27, 903
- (31)
- (32) Taylor, G.B., Vermeulen, R.C., Pearson, T.J., Readhead, A.C.S., Henstock, D.R., Browne, I.W.A., & Wilkinson, P.N. 1994, ApJS, 95, 345
- (33)
- (34) Taylor, G. B., Readhead, A. C. S., & Pearson, T. J. 1996a, ApJ, 463, 95
- (35)
- (36) Taylor, G. B., Vermeulen, R. C., Readhead, A. C. S., Pearson, T. J., Henstock, D. R., & Wilkinson, P. N. 1996b, in “The Second Workshop on Gigahertz Peaked Spectrum and Compact Steep Spectrum Radio Sources”, eds. I.A.G. Snellen, R.T. Schilizzi, H.J.A. Rottgering, and M.N. Bremer (Leiden Observatory:Leiden)
- (37)
- (38) Taylor, G. B., & Vermeulen, R. C. 1997, ApJ, 485, L9
- (39)
- (40) Wilkinson, P. N., Polatidis, A. G., Readhead, A. C. S., Xu, W., & Pearson, T. J. 1994, ApJ, 432, L87
- (41)

| Source | Alternate | |||
|---|---|---|---|---|
| Name | Name | RA | Dec | ID |
| (1) | (2) | (3) | (4) | (5) |
| J0000+4054 | 4C 40.52 | 00 00 53.0815 | 40 54 01.806 | G |
| J0003+4807 | 00 03 46.0413 | 48 07 04.134 | … | |
| J0029+3456 | CJ 0026+346 | 00 29 14.2436 | 34 56 32.255 | G |
| J0029+0509 | 00 29 03.5922 | 05 09 34.860 | QSO | |
| J0111+3906 | PR 0108+388 | 01 11 37.3192 | 39 06 28.085 | G |
| J0132+5620 | 01 32 20.4503 | 56 20 40.372 | … | |
| J0204+0903 | 02 04 34.7589 | 09 03 49.248 | … | |
| J0207+3152 | 5C 06.008 | 02 07 34.9902 | 31 52 06.458 | G |
| J0332+6753 | 03 32 59.5241 | 67 53 03.860 | … | |
| J0400+0550 | 04 00 11.7358 | 05 50 43.135 | … | |
| J0410+7656 | PR 0404+768 | 04 10 45.6057 | 76 56 45.301 | G |
| J0424+1442 | 04 24 23.4914 | 14 42 16.688 | … | |
| J0427+4133 | 04 27 46.0455 | 41 33 01.091 | … | |
| J0518+4730 | 05 18 12.0899 | 47 30 55.536 | … | |
| J0620+2102 | 06 20 19.5286 | 21 02 29.501 | … | |
| J0650+6001 | CJ 0646+600 | 06 50 31.2556 | 60 01 44.547 | QSO |
| J0713+4349 | PR 0710+439 | 07 13 38.1642 | 43 49 17.199 | G |
| J0753+4231 | CJ 0749+426 | 07 53 03.3378 | 42 31 30.763 | QSO |
| J0754+5324 | 07 54 15.2177 | 53 24 56.450 | … | |
| J0842+1835 | 08 42 05.0944 | 18 35 40.987 | QSO | |
| J0925+0019 | 09 25 07.8153 | 00 19 13.929 | QSO | |
| J0954+7435 | 09 54 47.4440 | 74 35 57.140 | G | |
| J1035+5628 | PR 1031+567 | 10 35 07.0399 | 56 28 46.792 | G |
| J1107+7232 | 11 07 41.7240 | 72 32 36.003 | QSO | |
| J1110+4817 | 11 10 36.3237 | 48 17 52.446 | QSO | |
| J1111+1955 | 11 11 20.0694 | 19 55 35.950 | G | |
| J1143+1834 | 11 43 26.0706 | 18 34 38.375 | … | |
| J1148+5924 | CJ 1146+596 | 11 48 50.3670 | 59 24 56.380 | G |
| J1227+3635 | 12 27 58.7260 | 36 35 11.819 | QSO | |
| J1244+4048 | CJ 1242+410 | 12 44 49.1879 | 40 48 06.137 | QSO |
| J1311+1417 | 13 11 07.8250 | 14 17 46.659 | QSO | |
| J1311+1658 | 13 11 23.8204 | 16 58 44.213 | … | |
| J1357+4353 | CJ 1355+441 | 13 57 40.6762 | 43 53 59.671 | G |
| J1400+6210 | PR 1358+624 | 14 00 28.6526 | 62 10 38.526 | G |
| J1414+4554 | 14 14 14.8526 | 45 54 48.730 | G | |
| J1415+1320 | PKS1413+135 | 14 15 58.8188 | 13 20 23.714 | QSO |
| J1546+0026 | 15 46 09.5312 | 00 26 24.615 | G |
TABLE 1. Continued Source Alternate Name Name RA Dec ID (1) (2) (3) (4) (5) J1651+0129 16 51 03.6620 01 29 23.448 … J1734+0926 17 34 58.3773 09 26 58.274 G J1737+0621 17 37 13.7290 06 21 03.567 QSO J1810+5649 CJ 1809+568 18 10 03.3203 56 49 22.959 … J1815+6127 CJ 1815+614 18 15 36.7920 61 27 11.641 QSO J1816+3457 18 16 23.8987 34 57 45.729 G J1826+1831 18 26 17.7118 18 31 52.915 … J1823+7938 CJ 1826+796 18 23 14.1088 79 38 49.002 G J1845+3541 CJ 1843+356 18 45 35.1097 35 41 16.719 G J1944+5448 CJ 1943+546 19 44 31.5138 54 48 07.069 G J1945+7055 CJ 1946+708 19 45 53.5197 70 55 48.723 G J2022+6136 PR 2021+614 20 22 06.6820 61 36 58.806 QSO J2203+1007 22 03 30.9534 10 07 42.584 … J2245+0324 22 45 28.2846 03 24 08.863 QSO J2355+4950 PR 2352+495 23 55 09.4582 49 50 08.340 G
| Peak Flux | rms | Lowest | |||||
|---|---|---|---|---|---|---|---|
| Source | Freq. | Beam | (mJy | (mJy | Contour | Status | |
| Name | (GHz) | (mas) | beam-1) | beam-1) | (mJy) | ||
| J0000+4054 | 1.6 | 10.15.38 | 29.7 | 436.5 | 0.5 | 1.5 | CAND |
| 8.4 | 2.321.14 | 5.4 | 59.2 | 0.4 | 1.5 | ||
| J0003+4807 | 4.9 | 2.391.75 | 14.1 | 60.9 | 0.4 | 0.8 | CSO |
| 8.4 | 1.511.09 | 1.8 | 24.8 | 0.3 | 0.6 | ||
| J0132+5620 | 4.9 | 2.371.58 | 18.6 | 376.0 | 0.5 | 1.5 | CAND |
| 8.4 | 1.551.01 | 18.1 | 203.0 | 0.5 | 1.2 | ||
| J0204+0903 | 4.9 | 3.241.68 | 7.3 | 97.2 | 0.3 | 1.0 | CSO |
| 8.4 | 1.820.95 | 5.6 | 54.0 | 0.5 | 1.5 | ||
| J0332+6753 | 1.6 | 7.326.18 | 6.3 | 114.0 | 0.3 | 0.8 | CAND |
| J0427+4133 | 8.4 | 1.631.01 | 18.2 | 494.8 | 0.3 | 0.8 | CSO |
| 15.0 | 0.860.59 | 12.8 | 269.9 | 0.3 | 0.8 | ||
| J0518+4730 | 4.9 | 2.491.68 | 0.07 | 215.1 | 0.3 | 0.8 | CAND |
| 8.4 | 1.561.06 | -0.5 | 126.2 | 0.3 | 0.8 | ||
| J0620+2102 | 1.6 | 9.605.35 | 2.2 | 367.4 | 0.3 | 0.9 | CAND |
| 8.4 | 1.721.00 | 22.3 | 117.6 | 0.4 | 1.2 | ||
| J0754+5324 | 4.9 | 2.801.68 | 36.5 | 56.7 | 0.3 | 0.8 | CSO |
| 8.4 | 1.320.93 | 65.1 | 17.9 | 0.4 | 1.0 | ||
| J1111+1955 | 8.4 | 1.730.77 | 5.5 | 50.6 | 0.5 | 1.0 | CAND |
| J1143+1834 | 4.9 | 3.261.71 | 3.1 | 177.7 | 0.2 | 0.6 | CAND |
| 8.4 | 1.981.05 | 0.5 | 114.8 | 0.3 | 0.9 | ||
| J1311+1417 | 4.9 | 3.611.85 | 0.9 | 170.0 | 0.4 | 0.8 | CAND |
| 8.4 | 2.151.06 | 3.7 | 92.5 | 0.2 | 0.8 | ||
| J1311+1658 | 8.4 | 2.151.01 | 8.2 | 137.9 | 0.3 | 0.8 | CAND |
| J1414+4554 | 4.9 | 3.011.77 | 13.5 | 39.0 | 0.3 | 0.8 | CSO |
| 8.4 | 1.841.30 | 37.5 | 15.9 | 0.3 | 0.8 | ||
| J1415+1320 | 1.6 | 10.95.79 | 7.4 | 147.9 | 0.3 | 0.9 | CSO |
| 8.4 | 2.261.12 | 4.9 | 1241.3 | 0.6 | 2.0 | ||
| J1546+0026 | 8.4 | 2.380.98 | 0.1 | 289.4 | 0.6 | 2.0 | CSO |
| 15.0 | 1.860.72 | 16.9 | 193.7 | 0.6 | 1.8 | ||
| J1734+0926 | 8.4 | 2.110.95 | 1.1 | 160.8 | 0.2 | 0.8 | CSO |
| 15.0 | 1.380.55 | 7.2 | 65.5 | 0.3 | 0.8 | ||
| J1816+3457 | 4.9 | 2.872.21 | 43.1 | 75.2 | 0.4 | 1.2 | CSO |
| 8.4 | 1.550.82 | 5.9 | 21.3 | 0.4 | 1.4 | ||
| J1826+1831 | 1.6 | 1.843.12 | 7.6 | 116.0 | 0.4 | 1.0 | CSO |
| 8.4 | 1.102.25 | 4.2 | 51.3 | 0.4 | 1.0 | ||
| J2203+1007 | 8.4 | 1.122.14 | 5.1 | 95.7 | 0.4 | 1.0 | CAND |
| J2245+0324 | 4.9 | 3.341.58 | 0.13 | 357.0 | 0.4 | 1.0 | CAND |
| 8.4 | 1.102.24 | 2.0 | 259.9 | 0.6 | 1.4 |
| Source | Comp. | P8.4 | ||||||
|---|---|---|---|---|---|---|---|---|
| (1) | (2) | (3) | (4) | (5) | (6) | (7) | (8) | (9) |
| J0000+4054 | A | 228.9 | … | 28.7 | … | … | … | 1.2 |
| B | 47.3 | … | 35.2 | … | … | … | ||
| C | 688.5 | … | 173.7 | … | … | … | ||
| D | 32.2 | … | … | … | … | … | ||
| J0003+4807 | A | … | 70.6 | 36.9 | … | 1.24 | … | 0.9 |
| B | … | 3.5 | 3.4 | … | 0.06 | … | ||
| C | … | 66.0 | 40.3 | … | 0.94 | … | ||
| J0132+5620 | A | … | 140.8 | 34.6 | … | 2.68 | … | 0.9 |
| B | … | 20.1 | 4.7 | … | 2.77 | … | ||
| C | … | 7.0 | 6.5 | … | 0.14 | … | ||
| D | … | 436.1 | 245.3 | … | 1.10 | … | ||
| J0204+0903 | A | … | 181.3 | 103.5 | … | 1.07 | … | 1.2 |
| B | … | 122.6 | 75.6 | … | 0.92 | … | ||
| C | … | 90.1 | 81.2 | … | 0.20 | … | ||
| D | .. | 155.6 | 57.1 | … | 1.91 | … | ||
| J0332+6753 | A | 95.8 | … | … | … | … | … | |
| B | 207.3 | … | … | … | … | … | ||
| C | 10.9 | … | … | … | … | … | ||
| J0427+4133 | A | … | … | 32.7 | 22.0 | … | 1.46 | 0.9 |
| B | … | … | 588.9 | 406.0 | … | 0.63 | ||
| C | … | … | 28.7 | 13.9 | … | 1.23 | ||
| J0518+4730 | A | … | 56.1 | 35.7 | … | 0.86 | … | 0.7 |
| B | … | 217.1 | 134.2 | … | 0.92 | … | ||
| C | … | 304.5 | 174.9 | … | 1.06 | … | ||
| J0620+2102 | A | 478.4 | … | 77.2 | … | … | … | 0.9 |
| B | 400.0 | … | 148.4 | … | … | … | ||
| J0754+5324 | A | … | 76.1 | 29.4 | … | 1.81 | … | 1.2 |
| B | … | 27.6 | 10.2 | … | 0.52 | … | ||
| C | … | 79.6 | 34.2 | … | 1.61 | … | ||
| J1111+1955 | A | … | … | 98.2 | … | … | … | 0.9 |
| B | … | … | 126.5 | … | … | … | ||
| J1143+1834 | A | … | 180.7 | 121.2 | … | 0.76 | … | 0.6 |
| B | … | 159.8 | 112.7 | … | 0.67 | … | ||
| J1311+1417 | A | … | 214.3 | 127.1 | … | 1.00 | … | 0.9 |
| B | … | 148.5 | 103.0 | … | 0.70 | … | ||
| C | … | 33.6 | 20.8 | … | 0.91 | … | ||
| J1311+1658 | A | … | … | 8.6 | … | … | … | 1.2 |
| B | … | … | 208.7 | … | … | … | ||
| C | … | … | 11.4 | … | … | … | ||
| D | … | … | 15.6 | … | … | … |
TABLE 3. Continued Source Comp. P8.4 (1) (2) (3) (4) (5) (6) (7) (8) (9) J1414+4554 A … 76.1 34.2 … 1.52 … 1.2 B … 97.8 41.9 … 1.62 … J1415+1320 A 260.9 … … … … … 4.5 B 390.8 … 44.6 … … … C 250.2 … 1381.8 … … … D 21.8 … … … … … J1546+0026 A … … 94.2 60.7 … 0.75 0.9 B … … 354.0 242.9 … 0.64 C … … 87.8 71.7 … 0.34 J1734+0926 A … … 162.4 66.7 … 1.51 1.2 B … … 238.8 97.2 … 1.53 J1816+3457 A … 196.8 74.4 … 1.85 … 1.2 B … 75.9 27.7 … 1.92 … J1826+1831 A … 16.0 … … … … 1.5 B … 5.3 8.3 … 0.86 … C … 50.4 31.0 … 0.93 … D … 200.7 107.2 … 1.20 … J2203+1007 A … … 120.9 … … … 1.2 B … … 7.8 … … … C … … 44.0 … … … J2245+0324 A … 166.8 116.9 … 0.68 … 1.2 B … 369.2 267.2 … 0.62 …
| Peak Flux | rms | Lowest | |||||
|---|---|---|---|---|---|---|---|
| Source | Freq. | Beam | (mJy | (mJy | Contour | ||
| Name | (GHz) | (mas) | beam-1) | beam-1) | (mJy) | ||
| J0029+0509 | 1.6 | 10.84.86 | 5.1 | 110.0 | 0.5 | 1.5 | |
| 8.4 | 1.991.00 | 2.6 | 130.0 | 0.6 | 1.5 | ||
| J0207+3152 | 8.4 | 1.530.84 | 11.3 | 173.0 | 0.4 | 1.2 | |
| J0400+0550 | 4.9 | 3.521.73 | 2.9 | 310.8 | 0.4 | 1.2 | |
| 8.4 | 2.151.07 | 0.7 | 275.1 | 0.4 | 1.2 | ||
| J0424+1442 | 4.9 | 3.361.61 | 3.8 | 150.9 | 0.2 | 0.6 | |
| 8.4 | 1.680.84 | 10.4 | 74.9 | 0.4 | 1.2 | ||
| 15.0 | 1.190.61 | 1.9 | 20.8 | 0.5 | 1.2 | ||
| J0842+1835 | 4.9 | 3.371.83 | 8.9 | 525.5 | 0.4 | 1.0 | |
| 8.4 | 1.961.09 | 5.2 | 394.3 | 0.4 | 1.0 | ||
| J0925+0019 | 8.4 | 1.840.76 | 0.7 | 151.7 | 0.3 | 1.2 | |
| 15.0 | 1.040.45 | 4.4 | 151.5 | 0.4 | 1.2 | ||
| J0954+7435 | 8.4 | 1.010.89 | 68.6 | 100.6 | 0.4 | 1.0 | |
| J1107+7232 | 4.9 | 1.971.96 | 16.5 | 132.4 | 0.2 | 0.6 | |
| 8.4 | 1.251.14 | 32.9 | 175.6 | 0.2 | 0.6 | ||
| J1110+4817 | 8.4 | 1.380.92 | 7.5 | 32.6 | 0.4 | 1.0 | |
| J1227+3635 | 4.9 | 2.951.70 | 4.2 | 250.0 | 0.6 | 1.8 | |
| 8.4 | 1.691.06 | 38.5 | 79.0 | 0.3 | 1.4 | ||
| J1651+0129 | 8.4 | 2.230.93 | 0.3 | 289.7 | 0.3 | 1.2 | |
| 15.0 | 1.100.43 | 7.7 | 178.7 | 0.4 | 1.2 | ||
| J1737+0621 | 4.9 | 3.481.60 | 1.7 | 277.8 | 0.3 | 0.8 | |
| 8.4 | 2.151.00 | 1.7 | 436.1 | 0.5 | 1.2 | ||
| J1810+5649 | 8.4 | 1.210.89 | 23.0 | 221.5 | 0.4 | 0.8 | |
| 15.0 | 0.610.50 | 45.8 | 157.7 | 0.7 | 1.4 |
| Source | Comp. | P8.4 | ||||||
|---|---|---|---|---|---|---|---|---|
| (1) | (2) | (3) | (4) | (5) | (6) | (7) | (8) | (9) |
| J0029+0509 | A | 150.3 | … | 267.7 | … | … | … | 1.2 |
| B | 103.4 | … | 50.1 | … | … | … | ||
| J0207+3152 | A | … | … | 179.1 | … | … | … | 2.0 |
| B | … | … | 76.7 | … | … | … | ||
| J0400+0550 | A | … | 80.8 | 50.2 | … | 0.91 | … | 0.9 |
| B | … | 360.0 | 318.4 | … | 0.23 | … | ||
| J0424+1442 | A | … | 78.6 | 43.8 | 14.2 | 1.11 | 1.91 | 1.1 |
| B | … | 182.9 | 100.8 | 28.5 | 1.14 | 2.14 | 4.1 | |
| C | … | 36.6 | 14.6 | 1.2 | 1.75 | … | 1.1 | |
| J0842+1835 | A | … | 676.3 | 595.2 | … | 0.24 | … | 6.1 |
| B | … | 71.7 | 21.6 | … | 2.29 | … | 1.3 | |
| C | … | 281.7 | 188.8 | … | 0.76 | … | 5.3 | |
| J0925+0019 | A | … | … | 156.7 | 156.6 | … | 0.00 | 3.7 |
| B | … | … | 124.7 | 59.8 | … | 1.25 | 3.7 | |
| J0954+7435 | A | … | … | 193.8 | … | … | … | 1.2 |
| B | … | … | 151.1 | … | … | … | ||
| J1107+7232 | A | … | 164.9 | 210.0 | … | 0.46 | … | 0.6 |
| B | … | 52.9 | 32.2 | … | 0.95 | … | ||
| J1110+4817 | A | … | … | 70.7 | … | … | … | 1.2 |
| B | … | … | 18.7 | … | … | … | ||
| C | … | … | 18.8 | … | … | … | ||
| J1227+3635 | A | … | 498.9 | 191.9 | … | 1.82 | … | 1.2 |
| B | … | 92.6 | 29.1 | … | 2.21 | … | ||
| C | … | 42.9 | 16.4 | … | 1.83 | … | ||
| D | … | 49.5 | 18.0 | … | 1.93 | … | ||
| J1651+0129 | A | … | … | 331.1 | 291.1 | … | 0.22 | 8.0 |
| B | … | … | 183.2 | 121.4 | … | 0.70 | 5.1 | |
| J1737+0621 | A | … | 164.5 | 107.6 | … | 0.81 | … | 1.2 |
| B | … | 339.5 | 500.8 | … | 0.74 | … | ||
| J1810+5649 | A | … | … | 159.8 | 113.0 | … | 0.59 | 18.0 |
| B | … | … | 235.5 | 169.4 | … | 0.56 | 41.7 | |
| C | … | … | 86.0 | 67.2 | … | 0.42 | 5.6 |