A Deep 12m Survey with ISO \toctitleA Deep 12m Survey with ISO 11institutetext: Dept. Physics and Astronomy, Cardiff University, PO Box 913, Cardiff, CF2 3YB, UK 22institutetext: Institut d’Astrophysique Spatiale, Université de Paris XI, Bâtiment 121, F-91405 Orsay Cedex, France
*
Abstract
I present results from a deep 12m extragalactic survey conducted with the ISOCAM instrument. The survey covers about 0.1 sq. deg. in four fields and reaches a 5 flux limit of 500Jy. 50 sources are identified to this flux limit. Of these, 37 are classified as galaxies on the basis of optical/mid-IR colours using identifications from the USNO-A photographic survey. Number counts for these objects exceed those predicted for no-evolution models in simple models. However, these conclusions are somewhat dependent on the assumed K-corrections. For this reason, and to better determine the nature of the evolution of this population, followup observations are required to determine redshifts, broadband optical-IR colours, and optical morphologies. The first results from these followups are presented. Images and optical/IR photometry for one of the four fields is discussed, and I also present the first results from optical spectroscopy. The highest redshift for the sample so far is z=1.2 for a broad-line object.
1 Introduction
Our view of the universe was fundamentally changed when the IRAS satellite revealed the importance of the mid- and far-IR parts of the spectrum in the light output of normal galaxies. About 1/3 of the luminosity of normal spirals is emitted in the mid- to far-IR (Soifer & Neugebauer, 1991). Perhaps more surprising was the discovery of a class of objects with very high luminosities, , which is almost entirely emitted in the mid- to far-IR (eg. Joseph & Wright, 1985; Sanders & Mirabel, 1996, and references therein). Such objects are known as Ultraluminous Infrared Galaxies, and have been the targets of intense study in the local universe (eg. Genzel, these proceedings). The issue of evolution in the ULIRG and broader IR luminous populations has always been of interest. However, it was not possible to observationally tackle this issue until recently since our main database on such objects, the IRAS catalogues, were dominated by relatively low redshift sources. Two instruments have now changed this situation — ISO, and SCUBA. SCUBA provides excellent possibilities for deep surveys in the submm, allowing us to look for high redshift counterparts to local ULIRGs (eg. Eales et al., 1999 and references therein). ISO allows deeper surveys in the mid- and far-IR, boosting our capabilities relative to IRAS by up to 1000 times. The whole issue of far-IR evolution has also been made more urgent by the discovery of a cosmological infrared background (eg. Hauser, Lagache, Puget contributions in this volume).
There are numerous mid- and far-IR surveys underway, many of which are discussed in this volume. The two instruments on ISO that permit such surveys are ISOCAM, operating in the mid-IR (Cesarsky et al. 1996), and ISOPHOT, operating in the far-IR (Lemke at al., 1996). There are arguments both for and against the use of both instruments and surveys have been undertaken with both (see eg. Dole, Cesarsky, Oliver contributions in this volume). We here discuss the results from a survey conducted with ISOCAM using the LW10, 12m filter.
2 Why a 12m Survey?
By far the bulk of the surveys conducted with ISOCAM have been made at 7 or 15m. Such surveys cover larger areas of the sky (eg. ELAIS, Oliver, this volume) and go deeper (eg. ULTRADEEP, Cesarsky, this volume) than the present work. One might then ask why we should bother with a 12m survey. The answer to this lies in two directions. Firstly, the LW10 filter broadly matches the IRAS 12m passband. Our current survey can thus act as a bridge between the shallower all-sky surveys from IRAS with the deeper, smaller area surveys at 7 and 15m conducted with ISO. Secondly, the mid-IR emission of galaxies contains a complex mix of different emission mechanisms. These include the unidentified infrared bands (eg. at 7.7 and 11.3m), various emission line species (eg. NeII at 12.7m), absorption lines (principally the silicate feature at 9.7m), and contributions from very hot dust grains at 200K (see eg. Aussel et al., 1999). When this complex spectral energy distribution (SED) is combined with the effects of redshift and specific observational filters, there is the potential for substantial colour(K)-corrections to any survey. The broader the observational filter, the less subject to K-corrections the resulting survey becomes. Since we do not know, and, until SIRTF observations arrive, will not be able to determine, the underlying mid-IR SED of any given galaxy in a mid-IR survey, this can lead to significant uncertainties in scientific conclusions. This is especially true when the redshifts of the sources are unknown. Xu et al. (1998) have shown that both the average K-corrections for a 12m ISO survey and the uncertainties in those corrections for any individual object are significantly smaller than for 15m observations. The present observations will thus be easier to interpret thanks to both the smaller K-corrections, and the copious amounts of IRAS 12m data available.
3 The ISO Deep 12m Survey: A Happy Accident
The data for the 12m survey were not originally acquired for this purpose. They were originally obtained for a search for comet trails associated with comet 7P/Pons-Winnecke, and were part of a larger project (see Davies et al., 1997). The original aim was to image four fields with ISOCAM raster maps in regions 1o ahead and 0.5o, 1o and 2o behind the nucleus of the comet. Each raster was 11x7 pointings, with 6” pixel-field-of-view, and 60” by 48” spacing. Each position on the sky was thus visited 12 times, providing good redundancy to the data. Total integration time per position is about 300s. Unfortunately, the observations were scheduled one day later than assumed in the ephemeris calculations for the comet, ensuring that the comet trails will lie at or beyond the bottom of each image. No trace of the trails is in fact seen in the reduced data, so we are left with four fields at high galactic latitude (typically ) with deep mid-IR imaging — ideal for a cosmological survey. The data were reduced using the IAS dual-beamswitch method (Desert et al. 1999). Further details of the data reduction are discussed in Clements et al. (1999).
4 Survey Results
A total of 148 verified sources are detected to 3 in the survey, down to a flux limit of 300Jy. For number count purposes we restrict ourselves to those sources detected at for a number of reasons. Firstly a number of uncertainties remain in the identification of the weakest sources, and secondly the problems of Malmquist bias are most easily controlled in samples detected at . 50 objects are detected at . We obtain optical identifications for these objects from the USNO-A catalogue, which includes B and R band magnitudes. We remove stars from this catalog on the basis of optical-IR colours (see Fig. 1), and then plot the integrated number counts for the galaxies alone (Fig. 2).

Triangles are 12m galaxies, stars are objects identified as stars on the basis of their optical-IR colours. The line shows where a pure Rayleigh-Jeans spectrum object would lie. The star on the far right of the plot is a merged pair of stars in the 12m data.

Single hatched region are the number counts from the present data, double hatched are counts from the deepest IRAS 12m survey (Hacking & Houck, 1987) which is dominated by stars, dark line to the bottom are counts from the IRAS galaxy survey (Rush et al. 1993). Triangles in the middle of the diagram are galaxies from Hacking & Houck survey (lower) and Gregorich et al. (1995). Triangle to upper right are the 15 counts from the ISOHDF (Oliver et al., 1997). Solid line is a strong evolution model from Clements et al. (1999).
The number counts from this plot can be compared to evolving and non-evolving models. We find that simple non-evolving models are excluded by this data at the 3.5 level. However, uncertainties in the K-corrections mean that this conclusion is not final. For that, we need further data including redshifts.
5 Optical/IR Colours and Imaging
As part of the UKIRT mini-survey and the INT Wide Field Survey programme, much of the first of the four 12m fields was imaged at UBVRIJ and K. This multicolour imaging allows us to examine both the morphologies and optical/IR SEDs of these objects. We include in this study not only those objects detected at but also those detected at with believable optical counterparts. The issue of any blank field 12m sources, ie. those detected at but with no optical counterpart, will be discussed elsewhere. We find that the optical/near-IR colours of the 12m sources are largely unexceptional (see Fig. 3). Only one source has an unusually large B-I colour (later spectroscopy shows this object to be an M-type star). The rest of the sources largely have colours typical of the bulk of the population seen in this field. One must then ask why these objects have become luminous at 12m. The optical images perhaps provide a clue to this (Fig 4). Inspection of these reveals that 77% of the 12m galaxies have companions or disturbed morphologies. This compares with a rate of 10% for low luminosity IRAS galaxies (Lawrence et al. 1987?), and suggests that interactions or mergers may be involved in triggering the 12m activity of these sources.

Triangles are 12m sources, the brightest of which are stars. Dots are all the optically selected objects in the field. Note that the 12m sources, with one exception, are not unusually red, indicating that the optical emission of these objects is not heavily obscured by dust. The one unusually red object turns out to be an M star.
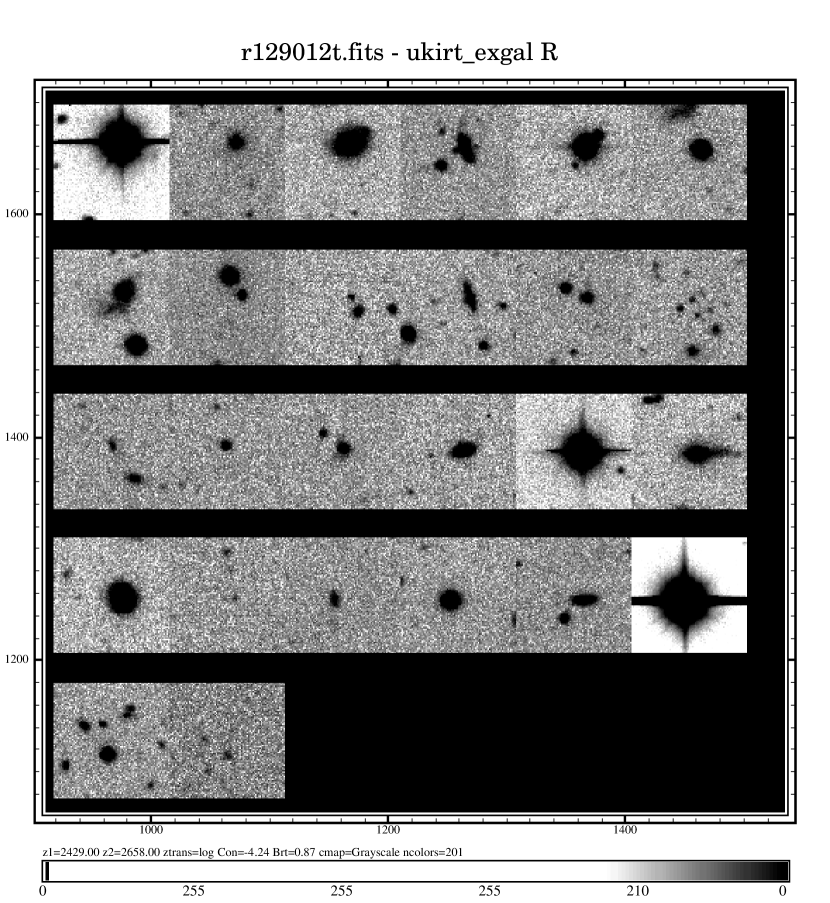
Images are 37” across with 0.37” pixels.
6 Optical Spectroscopy
Of the 12m sources identified in this survey, only one had a previously known redshift (z=0.11 (Clements et al., 1996)). We must obtain redshifts for the whole sample, or complete subsamples, to properly test evolutionary models. Optical spectroscopy for these sources is thus a high priority. We have so far had two runs at the ESO 3.6m telescope using EFOSC-2 for this part of the programme. The first of these runs suffered from poor weather conditions and instrument failures. In contrast, the most recent of these runs, shortly after the Ringberg meeting of which these are the proceedings, went very well. We now have secure redshifts for at least 25 objects, with redshifts ranging from 0.037 to 1.2. We have also found that one or two of the objects previously identified as galaxies turn out to be M-stars. Their SEDs appear to be galaxy like in the optical-mid-IR colour-colour diagram because of the large molecular absorption bands reducing their optical emission below Rayleigh-Jeans levels. As well as redshift determination, we will use these spectra to classify the nature of the ionising source in the objects. It already appears that the majority of these sources are powered by star formation, since they have HII region-like spectra. Several, though, show signs of an AGN contribution, including our highest redshift object which has a broad line spectrum (Fig. 5).

7 Conclusions
I have presented results from a deep 12m survey with ISO. The
survey data themselves suggest that strong evolution is taking place
in this population, but additional followup observations are needed
to confirm this. The followup programme is now well underway, with
optical/IR imaging for one of the four survey areas in hand, and
optical spectra complete for the brighter objects in the sample. The
next stage will be to construct luminosity functions for the
spectroscopic subsample and to compare this with IRAS data on nearby
objects. With the sad demise of the WIRE spacecraft, the present work
is likely to be the deepest 12m survey available until the NGST
era. As such it represents an important link between the IRAS surveys
and the deeper, smaller area ISO surveys at 7 and 15m. It is thus an
important resource for the future of mid-IR cosmology.
Acknowledgements It is a pleasure to thank my collaborators on
this project: Xavier Desert, Alberto Franceschini, Bill Reach, Amanda
Baker, John Davies and Catherine Cesarsky. I am also very grateful to
Steve Warren, Scott Croom and the UKIRT Minisurvey team for providing
the optical/IR imaging data. Thanks also to ESA and ESO for the use of
their facilities. This work was supported by EU TMR network and
PPARC postdoctoral posts.
References
- [1] Soifer, B.T., & Neugebauer, G. (1991) The properties of infrared galaxies in the local universe. AJ 101:354
- [2] Joseph R.D., & Wright, G.S. (1985) Recent star formation in interacting galaxies. II - Super starburst in merging galaxies. MNRAS 241:87
- [3] Sanders, D.B., & Mirabel, I.F. (1996) Luminous Infrared Galaxies ARAA 34:749
- [4] Eales, S.A., et al. (1999) The Canada-UK Deep Submillimeter Survey: First Submillimeter Images, the Source Counts, and Resolution of the Background. ApJ 515:518
- [5] Cesarsky, C., et al. (1996) ISOCAM in flight. A&A 315:L32
- [6] Lemke, D., et al. (1996) ISOPHOT - capabilities and performance. A&A 315:L64
- [7] Aussel, H. et al. (1999) ISOCAM observations of the Hubble Deep Field reduced with the PRETI method. A&A 342:313
- [8] Xu, C., et al. (1998) Emission Features and Source Counts of Galaxies in the Mid-Infrared. ApJ 508:576
- [9] Davies, J.K., et al. (1997) ISOCAM Observations of the Comet P/Kopff Dust Trail. Icarus 127:251
- [10] Desert, F-X., et al. (1999) A classical approach to faint extragalactic source extraction from ISOCAM deep surveys. Application to the Hubble Deep Field. A&A 342:363
- [11] Clements, D.L., et al. (1999) A deep 12 micron survey with ISO. A&A 346:383
- [12] Hacking, P., & Houck, J.R., (1987) A very deep IRAS survey at l = 97 deg, b = 30 deg. ApJS 63:311
- [13] Rush, B., et al. (1993) The extended 12 micron galaxy sample. ApJS 89:1
- [14] Gregorich, D.T., et al. (1995) Study of Deep IRAS Fields at 60 micron. AJ 110:259
- [15] Oliver, S.J., et al. (1997) Observations of the Hubble Deep Field with the Infrared Space Observatory - III. Source counts and P(D) analysis. MNRAS 289:471
- [16] Lawrence, A., et al. (1988) High-luminosity IRAS galaxies. I - The proportion of IRAS galaxies in interacting systems. MNRAS 240:329
- [17] Clements, D.L., et al. (1996) Optical imaging of ultraluminous IRAS galaxies: how many are mergers?. MNRAS 279:477