Large scale motions in superclusters: their imprint in the CMB
Abstract
We identify high density regions of supercluster size in high resolution -body simulations of a representative volume of three Cold Dark Matter Universes. By assuming that (1) the density and peculiar velocities of baryons trace those of the dark matter, and (2) the temperature of plasma is proportional to the velocity dispersion of the dark matter particles in regions where the crossing times is smaller than the supercluster free-fall time, we investigate how thermal motions of electrons in the intra-cluster medium and peculiar velocity of clusters can affect the secondary anisotropies in the cosmic microwave background (CMB). We show that the thermal effect dominates the kinematic effect and that the largest thermal decrements are associated with the most massive clusters in superclusters. Thus, searching for the presence of two or more close large CMB decrements represents a viable strategy for identifying superclusters at cosmological distances. Moreover, maps of the kinematic effect in superclusters are characterized by neighboring large peaks of opposite signs. These peaks can be as high as K at the arcminute angular resolution. Simultaneous pointed observations of superclusters in the millimeter and submillimeter bands with upcoming sensitive CMB experiments can separate between the thermal and kinematic effect contributions and constrain the evolution of the velocity field in large overdense regions.
Subject headings:
cosmic microwave background – large scale structure of the Universe – galaxies: clusters: general – gravitation – methods: -body simulations1. INTRODUCTION
Thermal motions of ionized gas in the intra-cluster medium and the bulk flow of clusters produce secondary temperature fluctuations in the cosmic microwave background (CMB) on the arcminute scale (Sunyaev & Zel’dovich (1970), 1972). For a given cluster velocity and mass, these thermal and kinematic effects (tSZ and kSZ effects, hereafter) are independent of redshift. Typical line-of-sight peculiar velocities of galaxy clusters, estimated from distance indicators to cluster galaxy members, are km s-1 (e.g. Giovanelli et. al. (1998)). These velocities can easily be larger for clusters in supercluster environments (Colberg et al. (1999)). Therefore, CMB anisotropies caused by the kSZ effect in superclusters will be substantially enhanced.
Ideally, one would like to estimate the magnitude of SZ anisotropies using hydro-dynamical simulations. Unfortunately, these simulations do not currently have the necessary dynamical range to study, at the same time, the large scale motions of clusters and the dynamics of the gas inside them. Therefore, we resort to high resolution -body simulations of dark matter particles only. By assuming that the motion and distribution of electron gas follow the dark matter, these simulations can be used to estimate the SZ anisotropies in the CMB. Here, we show that superclusters have a clear signature in both tSZ and kSZ maps: in tSZ maps, superclusters appear as regions of neighboring large CMB decrements; in kSZ maps, supercluster regions contain large neighboring peaks of opposite sign. The first property can provide an easy strategy for indentifying superclusters at any redshift; after removing the dominating tSZ effect contribution, the detectable kSZ peaks provide a direct measure of the velocity field in superclusters.
2. Method
To explore the non-linear evolution of the density and velocity field of superclusters, we use the -body simulations of three variants of the Cold Dark Matter (CDM) model (see Kauffmann et al. (1999) for details): two low density models with a Mpc3 comoving box111We use throughout. (OCDM with ; CDM with , ) and a high density model with a Mpc3 comoving box (CDM with ). All models contain particles and are normalized to the present abundance of galaxy clusters.
In order to locate superclusters in the simulation, we compute the density on a grid from the particle positions at with the cloud-in-cell (CIC) interpolation scheme. We then smooth the density field with a gaussian window of width Mpc, compute the average overdensity profiles around local maxima and search for regions with , where is a parameter. The chosen window width identifies superclusters efficiently: smaller widths also identify isolated clusters; larger widths miss low density superclusters. Because we set the same initial random phases in all our simulations, they yield the same large scale matter distribution at . For example, in the OCDM model at , we find 45, 15, 7, 3, and 1 regions with , 3, 4, 5, and 6, respectively. The most dense region has . Hereafter, we define as superclusters the regions with (e.g. Einasto et al. (1997)). These superclusters have crossing times larger than the Hubble time and they are not in dynamical equilibrium. Clusters within the simulation box are identified with a friends-of-friends algorithm applied to the dark matter particles.
Table 1
Evolution of the Properties of Supercluster Regions
| # | tSZ | kSZ | rms | rms tSZ | rms kSZ | |||||
|---|---|---|---|---|---|---|---|---|---|---|
| km s-1 | km s-1 | K | K | K | K | Mpc | ||||
| (1) | (2) | (3) | (4) | (5) | (6) | (7) | (8) | (9) | (10) | (11) |
| 1 | ||||||||||
| 1 | ||||||||||
| 1 | ||||||||||
| 1 | ||||||||||
| 1 | ||||||||||
| 2 | ||||||||||
| 2 | ||||||||||
| 2 | ||||||||||
| 2 | ||||||||||
| 2 | ||||||||||
| 5 | ||||||||||
| 5 | ||||||||||
| 5 | ||||||||||
| 5 | ||||||||||
| 5 |
Evolution of the properties of Mpc2 supercluster regions centered on the supercluster positions at . Values are from maps of the OCDM model with a comoving spatial resolution of Mpc. Column (1) supercluster identification number in order of decreasing overdensity; column (2) redshift; columns (3)–(7) optical depth, velocity dispersion, peculiar velocity, tSZ and kSZ fluctuations of the largest (left entries in brackets) tSZ decrement and second largest (right entries) tSZ decrement; columns (8)–(10) rms values including/excluding two squares of Mpc on a side each centered on one of the two largest tSZ decrements; (11) projected comoving separation between the two largest tSZ decrements.
The tSZ and kSZ effects depend on the temperature and line of sight velocity of the intra-cluster medium, and on the number density of free electrons. Therefore we have to relate these quantities to the positions and velocities of the dark matter particles in the simulations. We first compute the density and velocity fields in the simulation box on a grid with the CIC interpolation scheme. This grid preserves the spatial resolution of our simulations in the high density regions we are interested in, namely superclusters, filaments, clusters and groups of galaxies. A coarser grid would artificially lower the magnitude of the SZ fluctuations but not their relative location and sign. We then assume that at any point within the cluster the plasma is thermalized: , where is the gas temperature, the local one dimensional velocity dispersion of the dark matter particles, the proton mass, and the Boltzmann constant. We also assume that the electron number density, , is related to the mass density by , where is the background baryonic density parameters in terms of the critical density. All calculations in this Letter are done with (e.g. Smith, Kawano & Malaney (1993)). Note however, that clusters may contain more baryons than the average baryon fraction in the Universe (e.g. Fukugita, Hogan & Peebles (1998)), so we might be underestimating the actual magnitude of the SZ effects by a factor of a few.
Under these assumptions, the hot electron gas causes tSZ temperature decrements in the CMB spectrum
| (1) |
where , is the radiation temperature, the simulation box proper size, the Thomson cross-section, the electron mass, and the speed of light. Numerical values of the tSZ decrement presented here are computed in the Rayleigh-Jeans limit . Line-of-sight peculiar velocities produce kSZ temperature fluctuations
| (2) |
With broad band observations, one can separate the thermal and kinematic effects and use the latter to measure the peculiar velocity of clusters (Sunyaev & Zel’dovich (1980); Rephaeli & Lahav (1991); Haehnelt & Tegmark (1996); Aghanim et al. (1997)).
We obtain two dimensional maps by projecting the simulation box along a random line of sight. Hereafter, we present results for all models projected along the same direction. We also compute maps of the Thomson optical depth , the line of sight velocity dispersion , and the line of sight velocity field .
3. results
Figure 1 shows the tSZ decrements in the OCDM box at . The largest decrements are in high density regions: superclusters appear as neighboring large decrements. This signature is characteristic of supercluster regions. Because the tSZ effect is independent of redshift, and, on arcminute angular scales, the tSZ decrements of the most massive clusters in a supercluster are larger than the cosmological fluctuations, neighboring large CMB decrements clearly indicate the presence of superclusters at cosmological distances.
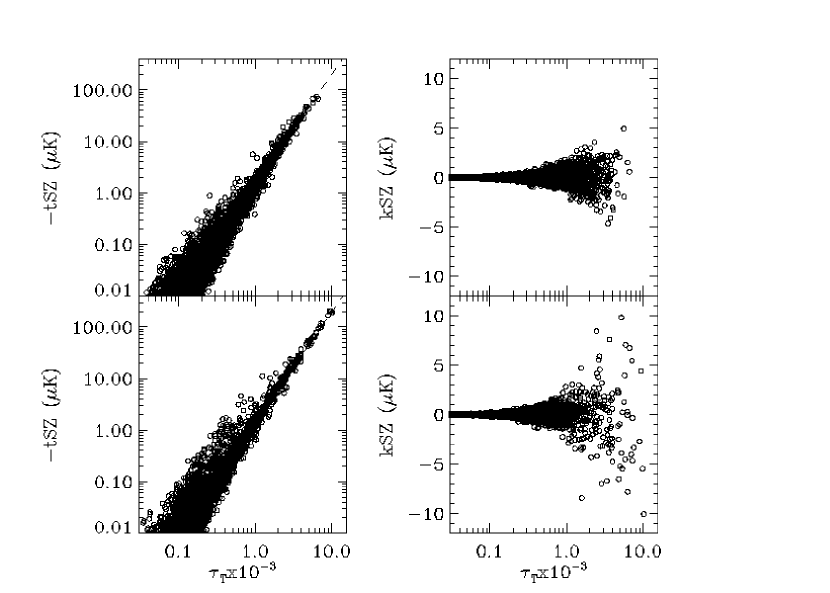
Figure 2 shows the kSZ map corresponding to Figure 1. There are many pairs of close fluctuations with opposite sign. The large scale structure clearly appears as a fuzzy filamentary network of small spots, which are the dark matter halos constituting the filaments. These are only a few Mpc long and are substantially curved. Because of this curvature, filaments have relatively small optical depth and do not appreciably contribute to the CMB anisotropies with the kSZ effect. The largest kSZ contributions comes from high density regions (Figure 3). All the peaks in the map which show kSZ fluctuations larger than K are within regions with . There are 41 peaks with of which 12 are outside regions with . There are no significant contributions to the kSZ fluctuations from peaks with . Peaks with obey the relation tSZ(K. Note that the bulk flow of the entire simulation box, when included, may increase the magnitude of the kSZ fluctuations. For example, in OCDM, the rms velocity of spheres of diameter Mpc is km s-1, and some kSZ fluctuations in Figure 3 would increase by .
Figure 4 shows a supercluster region. Because the clusters are approaching each other, the kSZ peaks have opposite signs: this is the characteristic signature of the velocity field within superclusters. The maps shown in Figure 4 are 22.2 arcmin on a side and have resolution 0.4 arcmin; the two largest tSZ decrements have separation of 5 arcmin. Examples of neighboring positive and negative kSZ peaks are also shown in Figure 5 for a supercluster at as it would appear in our three cosmological models. The angular dimension of these maps depends on the supercluster distance. The CDM, CDM and OCDM models yield fluctuations with increasing magnitude. A full comparison of the magnitude of the SZ effects in our cosmological models will be discussed elsewhere. Here, we emphasize that, in all models, superclusters present neighboring tSZ decrements and kSZ fluctuations with opposite sign. Therefore our supercluster identification method is independent of the cosmology.
Table 1 lists the properties of the two largest tSZ decrements in a few dense superclusters at different redshifts in the OCDM box. In some cases, superclusters have a peculiar feature: the kSZ fluctuations corresponding to the two tSZ decrements are not the largest fluctuations in the kSZ maps. We have searched for the kSZ fluctuations which are more than twice the kSZ fluctuation corresponding to the tSZ decrement. We find 9 such shifted kSZ fluctuations, out of the 3 superclusters at 5 different redshifts listed in Table 1. For example, in supercluster #2 at , there are two kSZ fluctuations of K and K at a projected distance Mpc and Mpc from the tSZ decrement K, whose corresponding kSZ fluctuation is K. These shifted kSZ peaks originate from clusters which are different from the clusters yielding the two largest tSZ decrements and are not necessarily relaxed.
The presence of large kSZ fluctuations and tSZ decrements that do not overlap is confirmed by the rms of the map fluctuations within the supercluster regions. In Table 1 we list two rms’s, including or excluding two squares of Mpc on a side, each centered on one of the two largest tSZ decrements. The tSZ rms drops substantially when these two squares are excluded. However, this is not always the case for the and kSZ rms’s. Therefore, within superclusters, there may be halos with large peculiar velocities and sufficiently high Thomson optical depth which cause kSZ fluctuations larger than the fluctuations due to the most massive clusters. We finally note that in our two low density models, amplitudes of both the tSZ and kSZ effects do not show any substantial evolution in the redshift range . At higher redshifts, however, the average amplitudes decrease appreciably.
4. Conclusion
The recent development in the microwave detector technology, the planned MAP, Planck Surveyor, and FIRST experiments, large ground arrays (e.g. ALMA and in Antarctica), and various balloon projects will provide high precision measurements of CMB temperature fluctuations on small scales. Here, we have seen that peculiar motions of clusters in supercluster environment produce detectable arcminute anisotropies. These kSZ fluctuations come in the form of peaks of opposite signs but they are an order of magniture smaller than temperature decrements estimated from the tSZ effect in the Rayleigh-Jeans limit.
In single-band low frequency CMB observations, superclusters at any redshift can be identified as well separated areas of neighboring non-gaussian large decrements superimposed on cosmological and foregrounds contributions which are more uniformly distributed. Follow-up observations in the millimeter and submillimeter bands can disentangle the thermal and kinematic contributions. We find that the largest thermal and kinematic fluctuations can originate from different clusters within the same supercluster and, therefore, might not always be perfectly overlapping.
References
- Aghanim et al. (1997) Aghanim, N., de Luca, A., Bouchet, F. R., Gispert, R., & Puget, J. L. 1997, A&A, 325, 9
- Colberg et al. (1999) Colberg, J. M., White, S. D. M., MacFarland, T. J., Jenkins, A., Pearce, F. R., Frenk, C. S., Thomas, P. A., & Couchman, H. M. P. 1999, MNRAS, in press (astro-ph/9805078)
- Fukugita, Hogan & Peebles (1998) Fukugita, M., Hogan, C. G., & Peebles, P. J. E. 1998, ApJ, 503, 518
- Giovanelli et. al. (1998) Giovanelli, R., Haynes, M.P., Salzer, J.J., Wegner, G., da Costa, L.N., Freudling, W., 1998, AJ, 116, 2632
- Einasto et al. (1997) Einasto, M., Tago, E., Jaaniste, J., Einasto, J., & Andernach, H. 1997, A&AS, 123, 119
- Haehnelt & Tegmark (1996) Haehnelt, M. G., & Tegmark, M. 1996, MNRAS, 279, 545
- Kauffmann et al. (1999) Kauffmann G., Colberg J. M., Diaferio A., White S. D. M. 1999, MNRAS, 303, 188
- Rephaeli & Lahav (1991) Rephaeli, Y., & Lahav, O. 1991, ApJ, 372, 21
- Smith, Kawano & Malaney (1993) Smith, M. S., Kawano, L. H., & Malaney, R. A. 1993, ApJS, 85, 219
- Sunyaev & Zel’dovich (1970) Sunyaev, R. A., & Zel’dovich, Ya. 1970, Ap&SS, 7, 3
- Sunyaev & Zel’dovich (1972) Sunyaev, R. A., & Zel’dovich, Ya. 1972, Comments Astrophys. Space Phys., 4, 173
- Sunyaev & Zel’dovich (1980) Sunyaev, R. A., & Zel’dovich, Ya. 1980, MNRAS, 190, 413