Evolved Super Star Clusters in M82
Abstract
We present high-resolution optical and near-infrared HST
observations of two adjacent regions in the fossil starburst region in
M82, B1 and B2.
Age estimates date the cluster population in the fossil starburst
between and years, assuming
solar metallicity. The star cluster population in B2 is more heavily
affected by internal extinction than that in B1. Although our cluster
size estimates indicate that they are gravitationally bound, and not
unlike Galactic globular clusters, their luminosity distribution is
significantly fainter than both super star cluster luminosity functions
(LFs) and the Galactic globular cluster LF. This makes them unlikely
proto-globular clusters, since their luminosities will fade further
before they are of similar age as the Galactic globular cluster
population.
If the compact H-bright sources in M82 B are Type II supernova
remnants (SNRs), they set an upper limit to the end of the starburst in
region “B2,” about 500 pc from the galaxy’s core, of Myr.
Region “B1,” about 1000 pc from the core, lacks good SNR candidates
and is evidently somewhat older. This suggests star formation in the
galaxy has propagated inward toward the present-day intense starburst
core.
keywords:
galaxies: evolution, galaxies: individual (M82), galaxies: photometry, galaxies: starburst, galaxies: star clusters, galaxies: stellar content1 Introduction
Observations at all wavelengths from radio to X-rays are consistent with a scenario that tidal interactions between M82 and another member galaxy of the M81 group have channeled large amounts of gas into the central regions of M82 during the last several 100 Myr (e.g., Telesco 1988, Rieke et al. 1993). This has induced a starburst which has continued for up to about 50 Myr. All of the bright radio and infrared sources associated with the active starburst are confined to the galaxy’s center, lying within a radius of pc, and corresponding spatially with bright optical structures, labeled M82 A, C, and E in O’Connell & Mangano (1978, OM78), see Fig. 1.
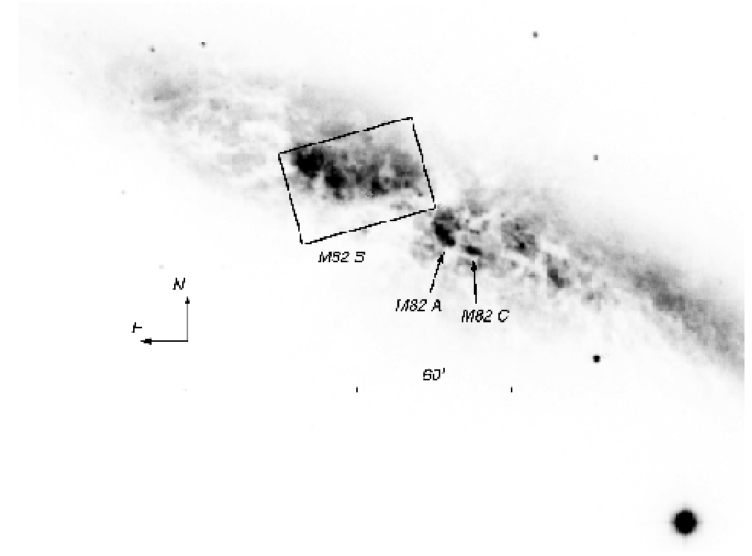
However, evidence exists that this is not the only major starburst episode to have occurred in M82. A region at about 1 kpc NE from the galactic center, M82 B (cf. OM78), has exactly the properties one would predict for a fossil starburst with a similar amplitude to the active burst. Marcum & O’Connell (1996) find a sharp main-sequence cut-off of the composite stellar system in M82 B, corresponding to an age of 100–200 Myr and an average extinction of mag. Region A, on the other hand, is only consistent with a very young population ( Myr) and is more heavily affected by internal extinction ( mag). By extrapolating region B’s surface brightness ( mag arcsec-2, after correction for foreground extinction; OM78) back to an age of 10 Myr we estimate that its surface brightness was magnitudes brighter (cf. the Bruzual & Charlot [1996, BC96] stellar population models), similar to that presently observed in the active starburst.
Hubble Space Telescope (HST) imaging of the bright central regions of M82 (A and C) resolved these into a swarm of young star cluster candidates, with a FWHM of pc () and mean (O’Connell et al. 1994, 1995), brighter than any globular cluster in the Local Group.
This is the nearest rich system of such objects; such “super star clusters” (SSCs) have also been discovered with HST in other interacting and amorphous systems, and in dwarf and starburst galaxies (e.g., Holtzman et al. 1992, Whitmore et al. 1993, O’Connell et al. 1994, Conti et al. 1996, Ho 1997, Carlson et al. 1998, Watson et al. 1998, among others). Their diameters, luminosities, and – in several cases – masses are consistent with these being young globular clusters formed as a result of recent gas flows (e.g., van den Bergh 1995, Meurer 1995, Ho & Filippenko 1996). It is possible that most of the star formation in starbursts takes place in the form of such concentrated clusters. Our observations of M82 do not reveal similar cluster formation outside the active and the fossil starburst regions.
Under the assumption that region B is indeed a fossil starburst site, it is expected that it originally contained a complement of luminous clusters similar to that now observed in region A. The combination of observations of both the active and the fossil starburst sites in M82 therefore provides a unique physical environment for the study of the stellar and dynamical evolution of these star cluster systems.
2 HST observations of the M82 central region
The fossil starburst region, M82 B, was observed on September 15, 1997, with both WFPC2 and NICMOS on board the HST. We imaged two adjacent square fields (Planetary Camera [PC] field of view, pix-1) in the M82 B region in the F439W, F555W and F814W passbands, with total integration times of 4400s, 2500s and 2200s, respectively, for region “B1”, and 4100s, 3100s and 2200s, respectively, for region “B2”. These observations were obtained using four exposures per filter, covering a large range in integration times to facilitate the removal of cosmic ray events. The F439W, F555W and F814W filters have roughly similar characteristics to the Johnson-Cousins broad-band B, V and I filters, respectively.
In the near-infrared (NIR) we chose to use NICMOS Camera-2 ( pix-1), which provided the best compromise of resolution and field of view. We acquired 4 partially spatially overlapping exposures in both the F110W and F160W filters (approximately similar to the Bessell J and H filters, respectively) in a tiled pattern; the integrations, of 512s each, were taken in MULTIACCUM mode to preserve dynamic range and to correct for cosmic rays.
3 Selection procedure
3.1 Selection of real sources
Unfortunately, the separation of real sources from artifacts in M82 B is problematic, due to significant small-scale variations in the amplitude of the background emission, which are largely caused by the highly variable extinction. For this reason, we cannot use standard unsharp masking techniques to remove this background, since this produces significant residual emission along the dust features.
An initial visual examination of the multi-passband observations revealed a multitude of faint point sources that become increasingly obvious with increasing wavelength. To include in our source selection a maximum number of real and a minimum amount of spurious sources (due to, e.g., dust features, weak cosmic rays, or poisson noise in regions of high surface brightness or at the CCD edges), we decided to cross correlate source lists obtained in individual passbands. We performed extensive checks to find the best selection criteria and thus to minimize the effects introduced by artifacts on the one hand and the exclusion of either very red or very blue sources on the other.
We chose our detection thresholds such that the number of candidate sources selected from the images in all passbands were comparable, of order 4000. Then, we cross correlated the source lists obtained in the individual passbands. Finally, we determined which combination of passbands resulted in the optimal matching of sources detected in both the blue and the NIR passbands. This source selection procedure led us to conclude that a final source list obtained from the cross correlation of the candidate sources detected in the F555W and F814W filters would contain the most representative fraction of the M82 B-region source population.
However, an initial visual examination of the cross-correlated V and I-band sources showed that the automated detection routine had returned many artifacts that were clearly associated with dust features. It also showed that the quality of the resulting sources for photometric follow-up was highly variable. Therefore, we decided to check the reality of all cross-correlated sources by examining them visually, in both passbands, at the same time classifying them in terms of contrast, sharpness, and the presence of nearby neighbors. Moreover, we added (and verified) the 30% of the sources in each field that were missed by the automated detection routine, but were clearly real sources, and were recognized as such by the visual examination of both the V and the I-band images.
The final source lists thus obtained contain 737 and 642 verified sources in M82 B1 and B2, respectively.
One should realize, however, that our I-band-to-NIR selection bias will lead to rather conservative age estimates due to the older mean ages of the sources emitting in these wavelength regimes: we visually examined the distribution of our verified source population superposed on the B-band images, and concluded that, by following the source selection procedure outlined above, we missed less than of the bluest (real) sources in each field due to this selection effect. The less complex galactic background at shorter (i.e., V band) wavelengths helped to filter out artifacts of the data, the majority of the resolved stellar population that becomes increasingly dominant at longer wavelengths (see de Grijs et al. 2000b), and features due to the background emission. An important concern for the subsequent analysis of our source sample is that we are only sampling the outer and possibly slightly older surface of the M82 B region, while active star formation, obscured by the ubiquitous dust component, may still be ongoing inside this region.
3.2 Control fields
We estimated the completeness of our object list by randomly and uniformly adding 500 synthetic point sources of input magnitudes between 20.0 and 25.0 mag to the observed images in both the F555W and the F814W filters. The PSFs of the synthetic point sources were obtained from observational PSFs, and scaled to the desired magnitudes. The effects of crowding in our simulated star fields are small: only 1–2% of the simulated objects were not retrieved due to crowding or overlap of adjacent sources.
For the uniformly distributed simulated sources, we established the 50% completeness limits at F555W as and 23.3 mag (for B1 and B2, respectively) and at F814W as mag.
In addition to these synthetic star fields, we used our Cen HST observations in the F555W passband, obtained as part of program GO-6053, to verify the reduction procedures and the accuracy of our photometry.
3.3 Separating star clusters from stars
We based the distinction between stars and more extended sources in the M82 B fields on the statistical differences between the size characteristics of the populations of real sources in these fields and those of the stars in the Cen control field. To do so, we added a scaled version of the Cen field to the M82 B fields, such that the output magnitudes of the majority of the Cen stars were in the same magnitude range as those of the M82 B sources, in the latter reference frame.
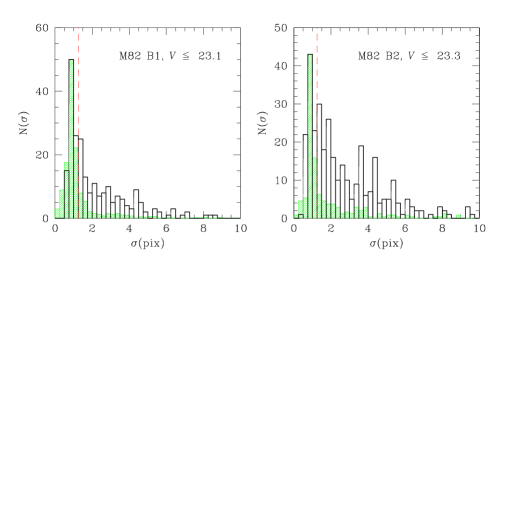
We determined characteristic sizes of both our M82 B verified sources and the Cen stars, synthetically added to the M82 frames, using a Gaussian fitting routine. Although the true luminosity profiles of the star clusters in M82 B may differ from Gaussians (de Grijs et al. 1999, 2000b), this method allows us to distinguish between compact and extended sources. A comparison between the distribution of characteristic stellar sizes from the globular cluster field with those of the verified sources in M82 B revealed that the population of extended sources in M82 B is well-represented by sources with pixels, see Fig. 2. Therefore, in the following we will consider those sources with and V-band magnitude brighter than the 50% completeness limit to be part of our verified cluster samples. They contain 128 and 218 cluster candidates in B1 and B2, respectively.
4 Cluster colors, ages and extinction
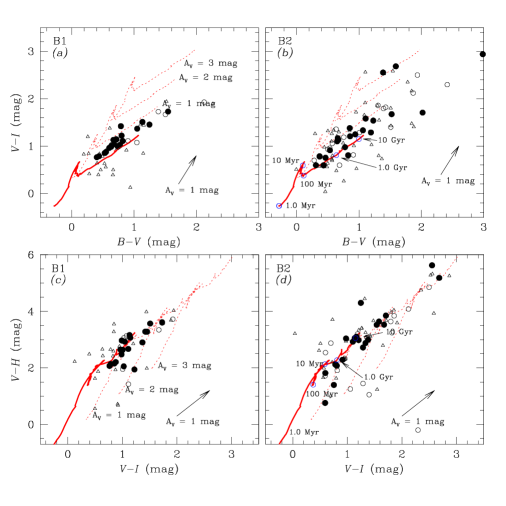
A close examination of the color-color diagrams of the cluster populations in either field (Fig. 3) reveals that M82 B2 is more heavily affected by internal extinction than region B1 (assuming similar, Galactic foreground extinction), as is evidenced by the larger spread of the data points along the direction of the reddening vectors. Most of the redder cluster colors observed, in particular in region B2, can be achieved by up to 2(–3) mag of visual extinction (assuming a similar extinction law as in the Galaxy and a foreground screen extinction geometry).
Employing the BC96 initial burst models (solid lines in Fig. 3) yields ages between and yr for region B1, and a slightly smaller lower age limit for B2, assuming solar metallicity. Near-solar metallicity should be a reasonable match to the young objects in M82 (e.g., Gallagher & Smith 1999); Fritze-v. Alvensleben & Gerhard (1994) also show that chemical evolution models indicate that young clusters should have metallicities . Other than the slightly bluer envelope in M82 B2 with respect to B1, indicating more recent star formation in B2, the representative age range and upper age limits inferred from the panels in Fig. 3 appears to be similar for either region. The upper age limit of billion years may be indicative of the onset of the gravitational interaction with M81 (or another galaxy in the same group) that produced the star clusters presently seen in the post-starburst region M82 B.
5 Comparison with Galactic globular clusters
5.1 Sizes
We need a good estimate of the star clusters’ linear sizes to determine if they are as compact as (Galactic old) globular clusters (e.g., Whitmore & Schweizer 1995, among others), or more diffuse, like open clusters or stellar (OB) associations (e.g., van den Bergh 1995, but see Meurer 1995), which may be less tightly bound and may therefore dissolve over the clusters’ lifetimes (e.g., van den Bergh 1995, Miller et al. 1997). Any stellar associations in our sample that are gravitationally unbound, and with net expansion velocities of order 1 km s-1 (Blaauw 1964) will – over the allowed lifetimes of to billion years – have expanded to radii of pc to kpc. On the other hand, sources with effective radii of order 10 pc and lifetimes of a few hundred Myr are many crossing times (of typically a few Myr) old and therefore likely gravitationally bound globular clusters (e.g., Schweizer et al. 1996).
The majority of the extended sources in the M82 B regions are characterized by effective radii of pc (based on Gaussian fits of the stellar radial luminosity behavior, but see Holtzman et al. 1996 and de Grijs et al. 1999), with a wing extending to larger sizes. Due to our size selection threshold at pixels, we are likely only probing the more extended star clusters, since we cannot distinguish star clusters with smaller effective radii from stars. Therefore, these effective radii are consistent with size estimates obtained from HST imaging for the majority of young globular clusters and cluster systems in other galaxies (e.g., O’Connell et al. 1994, Barth et al. 1995, Holtzman et al. 1996, Schweizer et al. 1996, Miller et al. 1997, Whitmore et al. 1999) as well as in the Galaxy. The Galactic globular cluster population is characterized by a median effective radius of pc (van den Bergh et al. 1991, Djorgovski 1993, van den Bergh 1995), and a total range from 0.7 to 20 pc.
Thus, it appears that the population of star cluster candidates in the M82 B regions resembles the Galactic globular cluster population at a younger age. We point out that in order to become old globular clusters, the sizes of these objects should not change significantly over their lifetimes. Additional support for an insignificant evolution of effective radii over the first Gyr is provided by our observations of the star cluster candidates in the actively star forming region, A, in the center of M82 (O’Connell et al. 1995). The recently formed young cluster candidates in M82 A are found to have typical effective radii of pc, which makes them closely resemble the slightly evolved populations in M82 B1 and B2.
In de Grijs et al. (2000b) we show that similar conclusions are reached if we take, e.g., modified Hubble laws (among others) as representative star cluster profiles.
5.2 The cluster luminosity function
Fig. 4 shows the absolute V-band cluster luminosity functions (CLFs) for B1 and B2; for comparison, we have also included the CLFs of the globular cluster system in the Galaxy and recently published (HST-based) CLFs for nearby galaxies that contain a statistically significant number of young (super) star clusters (where applicable, we used km s-1 Mpc-1 to obtain absolute magnitudes), including M82 A (O’Connell et al. 1995). Where available, we have indicated the completeness limits by dashed lines.
From this figure, it is immediately clear that the star clusters in M82 B are significantly fainter than the SSCs recently detected by HST in other galaxies. They are also significantly fainter than the majority of the Galactic globular cluster population, which must have faded by several magnitudes compared to the young SSCs, due to stellar evolution (cf. BC96). Considering the younger ages of the M82 B star clusters with respect to the Galactic globular cluster population, it is unlikely that the M82 B CLF will resemble the Galactic globular cluster LF after evolving to similar ages: stellar and star cluster evolution indicates an additional fading with time, the amount of which depends on the current ages of the M82 star clusters (cf. BC96).

6 Supernova Remnants
To supplement our ongoing broad-band imaging program on the SSCs in M82 B, we extracted from the HST archive H+continuum observations of the central regions of M82, taken through the F656N narrow-band filter (March 16, 1997, program GO-6826; and September 12, 1995, GO-5957). Since we lacked a suitable narrow-band continuum image near the bandpass of the F656N filter, we created a pseudo-continuum image from our co-registered (and essentially emission-line-free) V and I-band WFPC2 images, by linearly interpolating the continuum fluxes to the mean wavelength of the F656N filter. We subtracted the pseudo-continuum image thus constructed from the H+continuum image to obtain an image containing pure line emission (see de Grijs et al. 2000a for a detailed technical description).
Close examination of the continuum subtracted H image of M82 B shows that region B1 has few compact H sources. However, B2, located closer to the active starburst core, is brighter in H, due to both compact sources and diffuse emission, although still at a surface brightness lower than in the active starburst. Most of the identified H sources in B2 have H brightnesses significantly above the norm for the exterior regions of the galaxy, especially considering the excess extinction in B2 (see Sect. 4). The brightest H sources could not be cross correlated with any of the verified continuum sources described in the previous sections, however. The brightest object in B2 resolves to a “string of pearls” of discrete sources and is conspicuously located adjacent to the strong central dust lane which separates region B from the starburst core.
One expects to find two types of compact H sources in a galaxy like M82. Hii regions will exist around young star clusters with ages Myr by virtue of the presence of ionizing O- or early B-type stars. However, there should always be a significant continuum source associated with such very young Hii regions, even if there is considerable extinction in the vicinity. Type II supernovae (SNe) can also produce compact H remnants. These will often be associated with their parent star clusters, but in many cases there may be no well-defined compact continuum source. Since Type II SNe can occur up to 50 Myr after a star formation event, the associated cluster may have faded or dynamically expanded enough to be inconspicuous against the bright background of the galaxy. Alternatively, the parent star of the SNR could have been ejected from the cluster or could have formed initially in the lower density field. In fact, earlier studies of resolved starbursts suggest that 80-90% of the bright stellar population resides in a diffuse component outside of compact clusters (e.g., Meurer et al. 1995, O’Connell et al. 1995).
The identified M82 B H sources fall into two wide luminosity ranges: those with and those with . Neither group has the properties expected for normal Hii regions in the disk of a late-type galaxy. Recent samples of normal Hii regions in spiral and irregular galaxies have been compiled by, among others, Kennicutt, Edgar & Hodge (1989), Bresolin & Kennicutt (1997), and Youngblood & Hunter (1999). The brightest H source in M82 B has . Although normal galaxies contain many Hii regions with luminosities in this range, they invariably also have much brighter sources, with luminosities up to 10. The largest M82 B source is smaller than 20 pc in diameter, whereas typical diameters for normal disk Hii regions are 30–100 pc.
Instead, we believe that the 10 sources in the more luminous group are good candidates for SNRs. Six of these have only faint counterparts in the continuum passbands. Some of the sources show evidence of limb brightening, as might be expected for older SNRs. Further (circumstantial) evidence for their SNR nature is discussed in de Grijs et al. (2000a).
7 Propagating star formation?
The presence of SNRs in the post-starburst region of M82 can help to set limits on its star formation history. The last SNe in a quenched starburst region would occur at a time comparable to the longest lifetime of an SN progenitor after the end of the starburst activity. Following Iben & Laughlin (1989) and Hansen & Kawaler (1994), the time spent between the zero-age main sequence and planetary nebula phase by an progenitor star, which is generally adopted as a lower limit for Type II SNe (e.g., Kennicutt 1984), corresponds to Myr. Type Ia SNe, which involve lower mass stars in binary systems, can occur much later, but one expects these to be more uniformly distributed over the galaxy’s surface, not concentrated near regions of recent star formation. The radiative lifetimes of the shell SNRs in their later phases are short in this context. They are limited by the expansion velocities of their shells.
Therefore, if our candidates are indeed SNRs they suggest an upper limit to the end of the starburst event in region B2 of Myr. The absence of SNR candidates in B1 indicates it is older. The ages derived from our analysis of the color-color diagrams of the M82 B1 and B2 clusters (Sect. 4, de Grijs et al. 2000b), and those of spectral synthesis dating of region B1 ( 100–200 Myr, Marcum & O’Connell 1996) are consistent with this. There is then the following progression of ages with distance from the center of the current starburst: B1 ( 100 Myr, pc), B2 ( 50 Myr, pc), and the present core (active for Myr, pc), and this suggests that intense star-forming activity in M82 has propagated inward toward the present starburst core during the past 100–200 Myr.
Acknowledgements.
This work is based on observations with the NASA/ESA Hubble Space Telescope, obtained at the Space Telescope Science Institute, which is operated by the Association of Universities for Research in Astronomy (AURA), Inc., under NASA contract NAS 5-26555. We acknowledge funding from NASA grants NAG 5-3428 and NAG 5-6403.References
- [] Barth, A.J., Ho, L.C., Filippenko, A., Sargent, W.L.W., 1995, AJ, 110, 1009
- [] Blaauw, A. 1964, ARA&A, 2, 213
- [] Bresolin, F., Kennicutt, R.C. 1997, AJ, 113, 975
- [] Bruzual, G., Charlot, S., 1996, in: Leitherer, C., Alloin, D., Fritze-von Alvensleben, U., et al., 1996, PASP 108, 996
- [] Burstein, D., Heiles, C. 1984, ApJS, 54, 33
- [] Carlson, M.N., Holtzman, J.A., Watson, A.M., et al., 1998, AJ 115, 1778
- [] Conti, P.S., Leitherer, C., Vacca, W.D., 1996, ApJ 461, L87
- [] de Grijs, R., O’Connell, R.W., Gallagher, J.S. iii, 1999, in: The Evolution of Galaxies on Cosmological Timescales, eds. Beckman, J.E., Mahoney, T.J., ApSS special issue, in press (astro-ph/9903188)
- [] de Grijs, R., O’Connell, R.W., Becker, G.D., Chevalier, R.A., Gallagher, J.S. iii, 2000a, AJ 119, in press (February issue; astro-ph/9910064)
- [] de Grijs, R., O’Connell, R.W., Gallagher, J.S. iii, 2000b, ApJ, in prep.
- [] Djorgovski, S.G. 1993, in Structure and Dynamics of Globular Clusters, eds. S. G. Djorgovski, G. Meylan (San Francisco: ASP), 373
- [] Fritze-v. Alvensleben, U., Gerhard, O.E. 1994, A&A, 285, 775
- [] Gallagher, J.S., III, Smith, L.J. 1999, MNRAS, 304, 540
- [] Hansen, C.J., Kawaler, S.D. 1994, Stellar Interiors: Physical Principles, Structure, and Evolution, New York: Springer
- [] Harris, W.E. 1996, AJ, 112, 1487
- [] Ho, L.C., 1997, in: Starburst Activity in Galaxies, eds. Franco, J., Terlevich, R., Tenorio-Tagle, G., Rev. Mex. A. A. Conf. Series, Vol. 6, Mexico City: IAUNAM, p. 5
- [] Ho, L.C., Filippenko, A.V. 1996, ApJ, 472, 600
- [] Holtzman, J.A., Faber, S.M., Shaya, E.J., et al., 1992, AJ 103, 691
- [] Holtzman, J.A., Watson, A.M., Mould, J.R., et al. 1996, AJ, 112, 416
- [] Iben, I., Jr., Laughlin, G. 1989, ApJ, 341, 312
- [] Kennicutt, R.C. 1984, ApJ, 277, 361
- [] Kennicutt, R.C., Edgar, B.K, Hodge, P.W. 1989, ApJ, 337, 761
- [] Marcum, P., O’Connell, R.W., 1996, in: From Stars to Galaxies: The Impact of Stellar Physics on Galaxy Evolution, eds. Leitherer, C., Fritze-von Alvensleben, U., Huchra, J., San Francisco: ASP, p. 419
- [] Meurer, G.R., 1995, Nat 375, 742
- [] Miller, B.W., Whitmore, B.C., Schweizer, F., Fall, S.M., 1997, AJ, 114, 2381
- [] O’Connell, R.W., Gallagher, J.S., Hunter, D.A., 1994, ApJ 433, 65
- [] O’Connell, R.W., Gallagher, J.S., Hunter, D.A., Colley, W.N., 1995, ApJ 446, L1
- [] O’Connell, R.W., Mangano, J.J., 1978, ApJ 221, 62
- [] Rieke, G.H., Loken, K., Rieke, M.J., Tamblyn, P., 1993, ApJ 412, 99
- [] Schweizer, F., Miller, B.W., Whitmore, B.C., Fall, S.M., 1996, AJ, 112, 1839
- [] Telesco, C.M., 1988, ARA&A 26, 343
- [] van den Bergh, S., 1995, Nat. 374, 215
- [] van den Bergh, S., Morbey, C., Pazder, J. 1991, ApJ, 375, 594
- [] Watson, A.M., Gallagher, J.S., Holtzman, J.A., et al., 1996, AJ 112, 534
- [] Whitmore, B.C., Schweizer, F., Leitherer, C., Borne, K., Robert, C., 1993, AJ 106, 1354
- [] Whitmore, B.C., Zhang, Q., Leitherer, C., Fall, S.M., Schweizer, F., Miller, B.W. 1999, AJ, in press (astro-ph/9907430)
- [] Youngblood, A.J., Hunter, D.A. 1999, ApJ, 519, 55