Abstract
Results from recent multiwavelength observations of blazars are reviewed, with particular emphasis on those involving the Rossi X-ray Timing Explorer (RXTE). I discuss blazars’ spectral energy distributions, their correlated variability at various energies, and the insights they offer on the physical processes in the jet. New results on Mrk 501, PKS 2155–304, and PKS 2005–489 are highlighted.
1 Blazars and Their spectral energy distributions (SEDs)
Blazars are radio-loud Active Galactic Nuclei characterized by polarized, highly luminous, and rapidly variable non-thermal continuum emission (Angel & Stockmann 1980) from a relativistic jet oriented close to the line of sight (Blandford & Rees 1978). As such, blazars provide fortuitous natural laboratories to study the jet processes and ultimately how energy is extracted from the central black hole.
The radio through gamma-ray spectral energy distributions (SEDs) of blazars exhibit two broad humps (Figure 1). The first component peaks at IR/optical in “red” blazars and at UV/X-rays in their “blue” counterparts, and is most likely due to synchrotron emission from relativistic electrons in the jet (see Ulrich, Maraschi, & Urry 1997 and references therein). The second component extends from X-rays to gamma-rays (GeV and TeV energies), and its origin is less well understood. A popular scenario is inverse Compton (IC) scattering of ambient photons, either internal (synchrotron-self Compton, SSC; Tavecchio, Maraschi, & Ghisellini 1998) or external to the jet (external Compton, EC; see Böttcher 1999 and references therein). In the following discussion I will assume the synchrotron and IC scenarios, keeping in mind, however, that a possible alternative for the production of gamma-rays is provided by the hadronic models (proton-induced cascades; see Rachen 1999 and references therein).
Red and blue blazars are just the extrema of a continuous distribution of SEDs. This is becoming increasingly apparent from recent multicolor surveys (Laurent-Muehleisen et al. 1998; Perlman et al. 1998), which find sources with intermediate spectral shapes, and trends with bolometric luminosity were discovered (Sambruna, Maraschi, & Urry 1996; Fossati et al. 1998). In the more luminous red blazars the synchrotron and IC peak frequencies are lower, the Compton dominance (ratio of the synchrotron to IC peak luminosities) is larger, and the luminosity of the optical emission lines/non-thermal blue bumps is larger than in their blue counterparts (Sambruna 1997).
A possible interpretation is that the different types of blazars are due to the different predominant electrons’ cooling mechanisms (Ghisellini et al. 1998). In a simple homogeneous scenario, the synchrotron peak frequency , where is the electron energy determined by the competition between acceleration and cooling. Because of the lower energy densities, in lineless blue blazars the balance between heating and cooling is achieved at larger , contrary to red blazars, where, because of the additional external energy density, the balance is reached at lower . Blue blazars are SSC-dominated, while red blazars are EC-dominated. While there are a few caveats to this picture (Urry 1999), the spectral diversity of blazars’ jets cannot be explained by beaming effects only (Sambruna et al. 1996; Georganopoulos & Marscher 1998), but require instead a change of physical parameters and/or a different jet environment.


2 Correlated multiwavelength variability: Testing the blazar paradigm
Correlated multiwavelength variability provides a way to test the cooling paradigm since the various synchrotron and IC models make different predictions for the relative flare amplitudes and shape, and the time lags. First, since the same population of electrons is responsible for emitting both spectral components (in a homogeneous scenario), correlated variability of the fluxes at the low- and high-energy peaks with no lags is expected (Ghisellini & Maraschi 1996). Second, if the flare is caused by a change of the electron density and/or seed photons, for a fixed beaming factor the relative amplitudes of the flares at the synchrotron and IC peaks obey simple and yet precise relationships (Ghisellini & Maraschi 1996; see however Böttcher 1999). Third, the rise and decay times of the gamma-ray flux are a sensitive function of the external gas opacity and geometry in the EC models (Böttcher & Dermer 1998). Fourth, the rise and decay times of the synchrotron flux depend on a few source typical timescales (Chiaberge & Ghisellini 1999). Fifth, spectral variability accompanying the synchrotron flare (in X-rays for blue blazars, in optical for red blazars) is a strong diagnostic of the electron acceleration versus cooling processes (Kirk, Riegler, & Mastichiadis 1998). When cooling dominates, time lags between the shorter and longer synchrotron wavelengths provide an estimate of the magnetic field (in Gauss) of the source via (Takahashi et al. 1996; Urry et al. 1997).
The role of RXTE. With its wide energy band coverage (2–250 keV), RXTE plays a crucial role in monitoring campaigns of blazars, since it probes the region where the synchrotron and Compton component overlap in the SEDs (Figure 1), allowing us to quantify their relative importance in the different sources. Its high time resolution and good sensitivity are ideal to detect the smallest X-ray variability timescales, study the lags between the harder and softer X-rays, and to follow the particle spectral evolution down to timescales of a few hours or less, pinning down the microphysics of blazars’ jets.
2.1 Results for red blazars
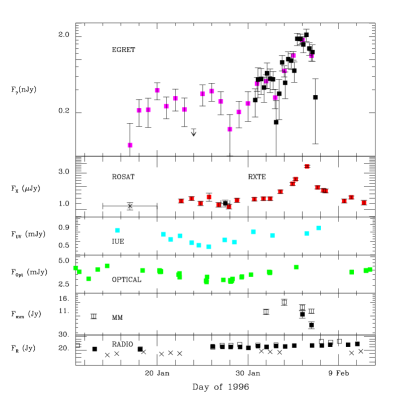
One of the best monitored red blazars is 3C279. From the simultaneous or contemporaneous SEDs in Figure 1a, it is apparent that the largest variations are observed above the synchrotron peak in IR/optical (not well defined) and the Compton peak at GeV energies, supporting the synchrotron and IC models. The GeV amplitude is roughly the square of the optical flux during the earlier campaigns, supporting an SSC interpretation (Maraschi et al. 1994) or a change of in the EC models, while in 1996 large variations were recorded at gamma-rays but not at lower energies (Wehrle et al. 1998). During the latter campaign, the rapid decay of the GeV flare (Figure 2a) favors an EC model (Böttcher & Dermer 1998; Wehrle et al. 1998). Note in Figure 2a the good correlation, within one day, of the EGRET and RXTE flares, which provides the first evidence that the gamma-rays and X-rays are cospatial (Wehrle et al. 1998).
Another candidate for future gamma-ray monitorings is BL Lac itself. In 1997 July it underwent a strong flare at GeV and optical energies (Bloom et al. 1997). The gamma-ray light curve shows a strong flare possibly anticipating the optical by up to 0.5 days; however, the poor sampling does not allow firmer conclusions. Contemporaneous RXTE observations showed a harder X-ray continuum (Madejski et al. 1999) than in previous ASCA measurements. The SED during the outburst is best modeled by the SSC model from radio to X-rays, while an EC contribution is required above a few MeV (Sambruna et al. 1999a). A similar mix of SSC and EC is also required to fit the SEDs of PKS 0528+134 (Sambruna et al. 1997; Mukherjee et al. 1998; Ghisellini et al. 1999).
2.2 Results for blue blazars
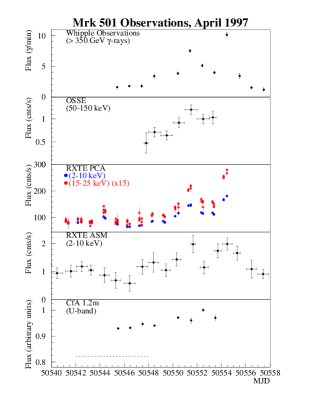
Mrk 501, one of the two brightest TeV blazars, attracted much attention in 1997 April when it underwent a spectacular flare at TeV energies (Catanese et al. 1997; Aharonian et al. 1999; Djannati-Atai et al. 1999). This was correlated to a similarly-structured X-ray flare observed with RXTE (Figure 2b), with no delay larger than one day (Krawczynski et al. 1999). These results are consistent with an SSC scenario where the most energetic electrons are responsible for both the hard X-rays (via synchrotron) and the TeV (via IC).
Figure 1b shows the SEDs of Mrk 501 during the 1997 April TeV activity, compared to the “quiescent” SED from the literature. An unusually flat (photon index, ) X-ray continuum was measured by SAX and RXTE during the TeV flare ( Pian et al. 1998; Krawczynski et al. 1999), implying a shift of the synchrotron peak by more than two orders of magnitude. This almost certainly reflects a large increase of the electron energy (Pian et al. 1998), or the injection of a new electron population on top a quiescent one (Kataoka et al. 1999a). Later RXTE observations in 1997 July found the source still in a high and hard X-ray state (Lamer & Wagner 1998), indicating a persistent energizing mechanism.
An interesting new behavior was observed during our latest 2-week RXTE-HEGRA monitoring of Mrk 501 in 1998 June (Sambruna et al. 1999b), when 100% overlap between the X-rays and TeV light curves was achieved (Figure 3a). A strong short-lived ( two days) TeV flare was detected, correlated to a flare in the very hard (20–50 keV) X-rays, with the softer X-rays being delayed by up to one day. As in 1997, large X-ray spectral variations are observed, with the X-ray continuum flattening to at the peak of the TeV flare, implying a similar shift to 50 keV of the synchrotron peak (Figure 3b). However, while in 1997 the TeV spectrum hardened during the flare (Djannati-Atai et al. 1997), as it did in the X-rays, we did not observe significant variability in the TeV hardness ratios during the flare (Figure 3a, panel (e)); instead the spectrum softens 1-2 days later. The correspondence between the X-ray and TeV spectra is no longer present during the 1998 June flare.


3 Acceleration and cooling in blue blazars
X-ray monitorings of blue blazars are a powerful diagnostic of physical processes occurring in these sources. This is because in these objects the X-rays are the high-energy tail of the synchrotron component where rapid and complex flux and spectral variability is expected depending on the balance between escape, acceleration, and cooling of the emitting particles (Kirk et al. 1998).
An ideal target for X-ray monitorings is PKS 2155–304, one of the brightest X-ray blazars (Treves et al. 1989; Sembay et al. 1993; Pesce et al. 1998). Interest in this source was recently revived due to a TeV detection (Chadwick et al. 1999) during a high X-ray state (Chiappetti et al. 1999). ASCA and SAX observations detected strong X-ray variability, with the softer energies lagging the harder energies by one hour or less (Chiappetti et al. 1999; Kataoka et al. 1999b; Zhang et al. 1999), and are consistent with a model where the electron cooling dominates the flares. This implies magnetic fields of Gauss (for ), similar to Mrk 421 (Takahashi et al. 1996).
A new mode of variability was discovered during our RXTE monitoring of PKS 2155–304 in 1996 May, as part of a larger multifrequency campaign (Sambruna et al. 1999c). The sampling in the X-rays was excellent (Figure 4a), and complex flux variations were observed, with short, symmetric flares superposed to a longer baseline trend. Inspection of the hardness ratios (the ratio of the counts in 6–20 keV over the counts in 2–6 keV) versus flux shows that different flares (separated by vertical dashed lines in Figure 4a) exhibit hysteresis loops of opposite signs, both in a “clockwise” and “anti-clockwise” sense (labeled as C and A in Figure 4a, respectively). Applying a correlation analysis to each flare separately, we find that the C loops corresponds to a soft lag (softer energies lagging) and the A loop corresponds to a hard lag (harder energies lagging), of the order of a few hours in both cases. Two examples are shown in Figure 5b for the May 18.5–20.2 and 24.2–26.9 flares, respectively.
We interpreted the data using the acceleration model of Kirk et al. (1998). Here loops/lags of both signs are expected depending on how fast the electrons are accelerated compared to their cooling time, . If the acceleration is instantaneous (i.e., ), cooling dominates variability and, because of its energy dependence, the harder energies are emitted first, with C loops and soft lags. If instead the acceleration is slower (), the electrons need to work their way up in energy and the softer energies are emitted first, with A loops and hard lags predicted. A close agreement between the RXTE light curve and the model is found by increasing by a factor 100 going from a C to an A loop, when becomes similar to the duration of the flare, and by steepening the electron energy distribution (see Sambruna et al. 1999d for details). Thus we reach the important conclusion that we are indeed observing electron acceleration, and together with cooling this is responsible for the observed X-ray variability properties of PKS 2155–304.
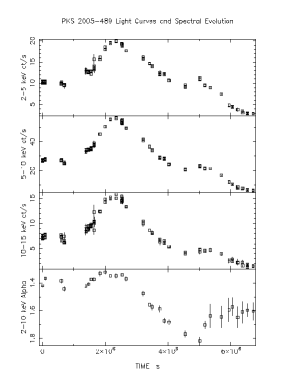
The complex spectral behavior of PKS 2155–304 in 1996 May is in contrast to the remarkable simplicity observed in earlier X-ray observations of this source (e.g., Kataoka et al. 1999b) and of other objects. Figure 5 summarizes two epochs of RXTE monitoring of another bright blue blazar, PKS 2005–489, which has an SED very similar to PKS 2155–304 and is a TeV candidate (Sambruna et al. 1995). During 1998 September, our RXTE monitoring detected a general trend of flux increase of 30% amplitude in 3.5 days (Figure 5a). Despite gaps in the sampling, it is clear that the variability at harder energies is faster than at softer energies, consistent with cooling dominating the flares. This is confirmed by the analysis of the hardness ratios versus flux, where only clockwise loops are observed. A consistent behavior was also observed one month later (Figure 5b) during a much larger, longer-lasting flare, when spectral variations occurred on timescales of a few hours (Perlman et al. 1999).


4 Summary and Future work
Recent multiwavelength campaigns of blazars expanded the current available database, from which we are learning important new lessons. Detailed modeling of the SEDs of bright gamma-ray blazars of the red and blue types tend to support the current cooling paradigm, where the different blazars flavors are related to the predominant cooling mechanisms of the electrons at the higher energies (EC in more luminous sources, SSC in lower-luminosity ones). However, several observational biases could be present which can be addressed by future larger statistical samples, especially in gamma-rays. In particular, it will be important to expand the sample of TeV blazars, which currently includes only a handful (5) of sources, with only two bright enough to allow detailed spectral and timing analysis.
A promising diagnostic for the origin of the seed photons for the IC process is the shape of the gamma-ray flare. This awaits well-sampled gamma-ray light curves, which will be afforded by the next higher-sensitivities missions (GLAST, AGILE in GeV and HESS, VERITAS, MAGIC, CANGAROO II in TeV). Broader-band, higher quality gamma-ray spectra will also be available, allowing a better location of the IC peak, a more precise measure of the spectral shape at gamma-rays, and its variability. More correlated X-ray/TeV monitorings are necessary, in which RXTE and SAX have crucial roles, to add to the current knowledge of the variability modes.
Finally, the current data show that acceleration and cooling are the dominant physical mechanisms responsible for the observed variability properties from blazars’ jets. We are starting to study these processes well in the X-rays for blue blazars, where RXTE has the potential to determine the shortest X-ray variability timescales and lags, probing into even more detail the jets’ microphysics. It would also be interesting to perform similar studies in the optical for red blazars, to compare the nature of the acceleration and cooling in the two subclasses.
Acknowledgements
This work was supported by NASA contract NAS–38252 and NASA grant NAG5–7276. I thank Laura Maraschi for a critical reading of the manuscript, Felix Aharonian and the HEGRA team for allowing me to report the 1998 TeV data of Mrk 501, and Lester Chou for help with the RXTE data reduction.
References
- 1
- 2 Aharonian, F. et al.: 1999, Astron. Astrophys. 342, 69.
- 3 Angel, J.R.P. & Stockman, H.S.: 1980, Ann. Rev. Astron. Astrophys. 18, 321.
- 4 Blandford, R.D. & Rees. M.J: 1978, in Pittsburgh Conference on BL Lac Objects, ed. A.M.Wolfe, Univ. of Pittsburgh Press, p. 328.
- 5 Bloom, S. et al.: 1997, Astrophys.. J. Lett. 490, L145.
- 6 Böttcher, M.: 1999, in GeV-TeV Astronomy: Toward a major Cherenkov detector IV, ed. B.Dingus, AIP, in press.
- 7 Böttcher, M. & Dermer, C.D.: 1998, Astrophys.. J. Lett. 501, L51.
- 8 Catanese, M.: 1999, in BL Lac phenomenon, ed. E. Valtonen, in press.
- 9 Catanese, M. et al.: 1997, Astrophys.. J. Lett. 487, L143.
- 10 Chadwick, P. et al.: 1999, Astrophys. J. 513, 161.
- 11 Chiaberge, M. & Ghisellini, G.: 1999, Mon. Not. R. Astr. Soc. 306, 551.
- 12 Chiappetti, L. et al.: 1999, Astrophys. J. 521, 552.
- 13 Djannati-Atai, A. et al.: 1999, Astron. Astrophys., in press (astro-ph/9906060).
- 14 Edelson, R.A. & Krolik, J.H.: 1988, Astrophys. J. 333, 646
- 15 Fossati, G. et al.: 1998, Mon. Not. R. Astr. Soc. 299, 433.
- 16 Georganopoulos, M. & Marscher, A.: 1998, Astrophys. J. 506, 621.
- 17 Ghisellini, G. et al.: 1999, Astron. Astrophys. 348, 63.
- 18 Ghisellini, G. et al.: 1998, Mon. Not. R. Astr. Soc. 301, 451.
- 19 Ghisellini, G. & Maraschi, L.: 1996, in Blazar continuum variability, ed. H.R.Miller, J.R.Webb, & J.C.Noble, ASP Conf. Series, vol. 110, p. 436.
- 20 Kataoka, J. et al.: 1999a, Astrophys. J. 514, 138.
- 21 Kataoka, J. et al.: 1999b, Astrophys. J., in press (astro-ph/9908090).
- 22 Kirk, J.G., Riegler, F.M., & Mastichiadis, A.: 1998, Astron. Astrophys. 333, 452.
- 23 Krawczynski, H. et al.: 1999, Astron. Astrophys., subm.
- 24 Lamer, G. & Wagner, S.: 1998, Astron. Astrophys. Lett. 331, L13
- 25 Laurent-Muehleisen, S. et al.: 1998, Astrophys. J. Suppl. 118, 127.
- 26 Madejski, G. et al.: 1999, Astrophys. J., in press (astro-ph/9902167).
- 27 Maraschi, L. et al.: 1994, Astrophys.. J. Lett. 435, L91.
- 28 Mukherjee, R. et al.: 1999, Astrophys. J., in press (astro-ph/9901106).
- 29 Perlman, E.S. et al.: 1999, Astrophys. J. Lett., in press (astro-ph/9906351).
- 30 Perlman, E.S. et al.: 1998, Astron. J. 115, 1253.
- 31 Pesce, J.E. et al.: 1998, Astrophys. J. 486, 770.
- 32 Pian, E. et al.: 1998, Astrophys.. J. Lett. 492, L17.
- 33 Rachen, J.: 1999, in GeV-TeV Astronomy: Toward a major Cherenkov detector IV, ed. B.Dingus, AIP, in press.
- 34 Sambruna, R.M. et al.: 1999a, Astrophys. J. 515, 140.
- 35 Sambruna, R.M. et al.: 1999b, Astrophys. J. Lett., subm.
- 36 Sambruna, R.M. et al.: 1999c, Astrophys. J. Lett., subm.
- 37 Sambruna, R.M. et al.: 1997, Astrophys. J. 474, 639.
- 38 Sambruna, R.M.: 1997, Astrophys. J. 474, 639
- 39 Sambruna, R.M., Maraschi, L., & Urry, C.M.: 1996, Astrophys. J. 463, 444.
- 40 Sambruna, R.M. et al.: 1995, Astrophys. J. 449, 567
- 41 Sembay, S. et al.: 1993, Astrophys. J. 404, 112
- 42 Tavecchio, F., Maraschi, L., & Ghisellini, G.: 1998, Astrophys. J. 509, 608.
- 43 Takahashi, T. et al.: 1996, Astrophys.. J. Lett. 470, L89.
- 44 Treves, A. et al.: 1989, Astrophys. J. 341, 733.
- 45 Ulrich, M.-H., Maraschi, L., & Urry, C.M.: 1997, Ann. Rev. Astron. Astrophys. 35, 445
- 46 Urry, C.M.: 1999, in TeV Blazars, ed. T.Weekes & M.Catanese, AIP, in press.
- 47 Urry, C.M. et al.: 1997, Astrophys. J. 486, 799.
- 48 Wherle, A. et al.: 1998, Astrophys. J. 497, 178.
- 49 Zhang, Y.H. et al.: 1999, Astrophys. J., in press (astro-ph/9907325).
- 50