The Flux Ratio Method for Determining the Dust Attenuation of Starburst Galaxies
Abstract
The presence of dust in starburst galaxies complicates the study of their stellar populations as the dust’s effects are similar to those associated with changes in the galaxies’ stellar age and metallicity. This degeneracy can be overcome for starburst galaxies if UV/optical/near-infrared observations are combined with far-infrared observations. We present the calibration of the flux ratio method for calculating the dust attenuation at a particular wavelength, , based on the measurement of flux ratio. Our calibration is based on spectral energy distributions (SEDs) from the PEGASE stellar evolutionary synthesis model and the effects of dust (absorption and scattering) as calculated from our Monte Carlo radiative transfer model. We tested the attenuations predicted from this method for the Balmer emission lines of a sample starburst galaxies against those calculated using radio observations and found good agreement. The UV attenuation curves for a handful of starburst galaxies were calculated using the flux ratio method, and they compare favorably with past work. The relationship between and is almost completely independent of the assumed dust properties (grain type, distribution, and clumpiness). For the UV, the relationship is also independent of the assumed stellar properties (age, metallicity, etc) accept for the case of very old burst populations. However at longer wavelengths, the relationship is dependent on the assumed stellar properties.
1 Introduction
To study galaxies, it is crucial to be able to separate the effects of the dust intrinsic to the galaxy from those associated with the galaxy’s stellar age and metallicity. Currently, the accuracy of separating the stars and dust in galaxies is fairly poor and the study of galaxies has suffered. This is in contrast with studies of individual stars and their associated sightlines in the Milky Way and nearby galaxies for which the standard pair method (Massa, Savage, & Fitzpatrick, 1983) works quite well at determining the effects of dust on the star’s spectral energy distribution (SED). The standard pair method is based on comparing a reddened star’s SED with the SED of an unreddened star with the same spectral type. Application of the standard pair method to galaxies is not possible as each galaxy is the result of a unique evolutionary history and, thus, each has a unique mix of stellar populations and star/gas/dust geometry.
Nevertheless, it would be very advantageous to find a method which would allow one to determine the dust attenuation of an individual galaxy. Such a method would greatly improve the accuracy of different star formation rate measurements. For example, two widely used star formation rate measurements are based on UV and H luminosities. Both are affected by dust and this limits their accuracy (Kennicutt, 1998; Schaerer, 1999). The importance of correcting for the effects of dust in galaxies has gained attention through recent investigations into the redshift dependence of the global star formation rate (Madau, Pozzetti, & Dickinson, 1998; Steidel et al., 1999). The uncertainty in the correction for dust currently dominates the uncertainty in the inferred star formation rate in galaxies (Pettini et al., 1998; Meurer, Heckman, & Calzetti, 1999) and conclusions about the evolution of galaxies (Calzetti & Heckman, 1999).
Initially, the effects of dust in galaxies were removed using a screen geometry. This assumption has been shown to be a dangerous oversimplification as the dust in galaxies is mixed with the stars. Radiative transfer studies have shown that mixing the emitting sources and dust and having a clumpy dust distribution produces highly unscreen-like effects (Witt, Thronson, & Capuano, 1992; Witt & Gordon, 1996; Gordon, Calzetti, & Witt, 1997; Ferrara et al., 1999; Takagi, Arimoto, & Vansevičius, 1999; Witt & Gordon, 1999). For example, the traditional reddening arrows in color-color plots turn into complex, non-linear reddening trajectories. In general, the attenuation curve of a galaxy is not directly proportional to the dust extinction curve and its shape changes as a function of dust column (e.g., Figs. 6 & 7 of Witt & Gordon (1999)).
While the various radiative transfer studies have made it abundantly clear that correcting for the effects of dust in galaxies is hard, none have come up with a method that is not highly dependent on the assumed dust grain characteristics, star/gas/dust geometry, and clumpiness of the dust distribution. This has led to a search for empirical methods. For galaxies with hydrogen emission lines, it is possible to determine the slope and, with radio observations, the strength of the galaxies’ attenuation curves at the emission line wavelengths (Calzetti, Kinney, & Storchi-Bergmann, 1994; Smith et al., 1995). Unfortunately, this method is limited to the select few wavelengths associated with hydrogen emission lines. In the pioneering study of the IUE sample of starburst galaxies (Kinney et al., 1993), Calzetti, Kinney, & Storchi-Bergmann (1994) used a variant of the standard reddened star/unreddened star method to compute the average attenuation curve for these galaxies. This work binned the sample using values derived from the H and H emission lines and assigned the lowest bin the status of unreddened. While this work was a significant advance in the study of dust in galaxies, it is only applicable to statistical studies of similar samples of starburst galaxies, not individual galaxies (Sawicki & Yee, 1998).
More recently, Meurer, Heckman, & Calzetti (1999) derived a relationship between the slope of the UV spectrum of a starburst galaxy and the attenuation suffered at 1600 Å, , using the properties of the IUE sample. This slope is parameterized by where the UV spectrum is fit to a power law () in the wavelength range between 1200 and 2600 Å (Calzetti, Kinney, & Storchi-Bergmann, 1994). The purpose of Meurer, Heckman, & Calzetti (1999) was to calculate the attenuation suffered by high redshift starburst galaxies using only their UV observations. From our radiative transfer work, we have found that this relationship is strongly dependent on the star/gas/dust geometry, dust grain properties, and dust clumpiness (Witt & Gordon, 1996, 1999) as suspected by Meurer, Heckman, & Calzetti (1999). Fig. 11 of Witt & Gordon (1999) shows the dependence of on () for various geometries, dust clumpinesses, and dust types. Meurer, Heckman, & Calzetti (1999) used the observed relationship between and for starburst galaxies, combined with a semi-empirical calibration between and to determine the relationship between and . The correlation between and was first introduced by Meurer et al. (1997) where . Witt & Gordon (1999) discovered that the relationship between and was almost completely independent of the star/gas/dust geometry, dust grain properties, and dust clumpiness (see Fig. 12b of Witt & Gordon (1999)). This implies that is a much better indicator of than .
This opened the possibility that the might be a good measure of and was the motivation for this paper. Qualitatively, there is good reason to think that a measure based on the flux at a wavelength and the total flux absorbed and re-emitted by dust, , should be a measure of . This is basically a statement of conservation of energy. Evidence that is a rough indicator of in disk galaxies is given by Wang & Heckman (1996). The details of the relationship between and will be dependent on the stellar, gas, and dust properties of a galaxy. Thus, a calibration of the relationship is necessary.
In §2, we calibrate the relationship between and for UV, optical, and near-IR wavelengths using a stellar evolutionary synthesis model combined with our dust radiative transfer model. This allowed us to investigate the dependence of the relationship on stellar parameters (age, star formation type, and metallicity) and dust parameters (geometry, local dust distribution, dust type, and the fraction of Lyman continuum photons absorbed by dust). We show a comparison of , , and values determined with this flux ratio method and the radio method (Condon, 1992) for 10 starburst galaxies in §3. In §4, we apply the flux ratio method to construct the UV attenuation curves for 8 starburst galaxies. The implications this work are discussed in §5.
2 The Flux Ratio Method
2.1 Flux Ratio
In a galaxy, almost all of the photons absorbed by dust are emitted by stars and gas in the UV, optical, and near-IR. This energy heats the dust which then re-emits in the mid- and far-infrared (small and large dust grains). Thus, the ratio of the total infrared flux to the flux at a particular wavelength is
| (1) |
where is the total IR flux in ergs cm-2 s-1, is the total unattenuated stellar flux below 912 Å in ergs cm-2 s-1, is the fraction of absorbed by dust internal to the H II regions (Petrosian, Silk, & Field, 1972; Mathis, 1986), is the emission line flux, is the unattenuated stellar/nebular flux in ergs cm-2 s-1 Å-1, , and is the attenuation at in magnitudes. For emission lines, the denominator of eq. 1 becomes where is the intrinsic integrated flux of the emission line. The line is resonantly scattered and, thus, is completely absorbed by the dust internal to the H II regions. Eq. 1 is similar to eq. 3 of Meurer, Heckman, & Calzetti (1999), but includes an additional term to account for the Lyman continuum photons absorbed by dust.
2.2 Relationship between and
We can calculate the relationship between and by using a stellar evolutionary synthesis (SES) model and a dust radiative transfer model. We use the PEGASE SES model (Fioc & Rocca-Volmerange, 1997, 1999) which gives the SEDs of stellar populations with a range of ages, type of star formation (burst/constant), and metallicity. One strength of the PEGASE model is that it computes the continuum and emission lines expected from gas emission as well as the stellar emission. We used a Salpeter IMF for the PEGASE calculations. The SES model SEDs give , , and emission line values. The effects of dust were calculated using the DIRTY radiative transfer model (Witt & Gordon, 1999). The DIRTY model gives the attenuation curves, , for a range of spherical star/gas/dust global geometries (shell, dusty, or cloudy), local dust distribution (homogeneous or clumpy), Milky Way (Cardelli, Clayton, & Mathis, 1989) or Small Magellanic Cloud (Gordon & Clayton, 1998) dust grain characteristics, and dust columns (). The cloudy geometry has dust extending to 0.69 of the system radius and stars extending to the model radius. The dusty geometry has both dust and stars extending to the model radius. This geometry represents a uniform mixture of stars and dust. The shell geometry has stars extending to 0.3 of the model radius and dust extending from 0.3 to 1 of the model radius. These three star/gas/dust geometries are shown pictorially in Figure 1 of Witt & Gordon (1999). Additional details of the the DIRTY model calculations can be found in Witt & Gordon (1999).
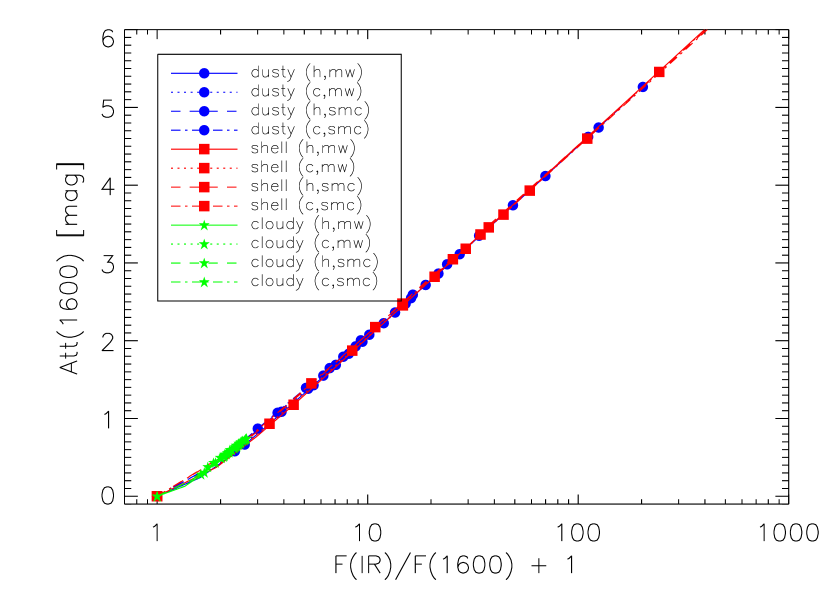
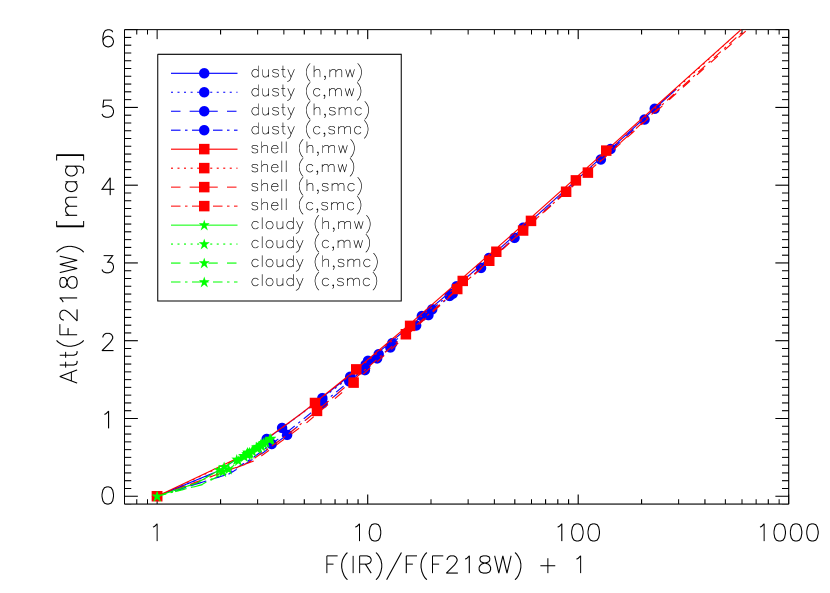
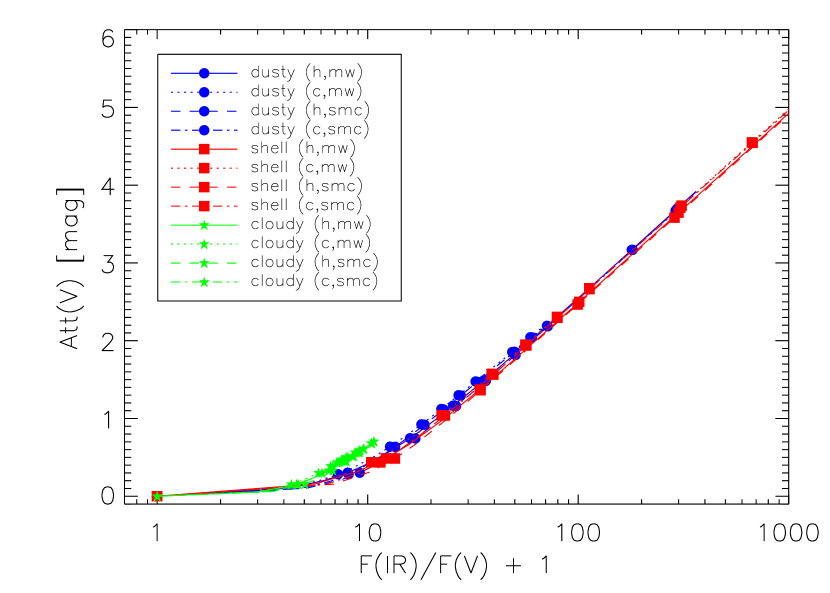
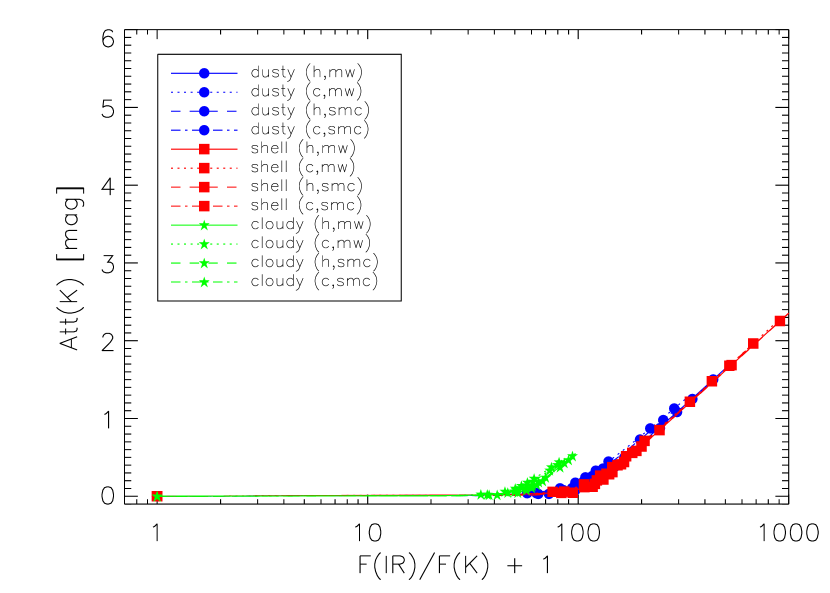
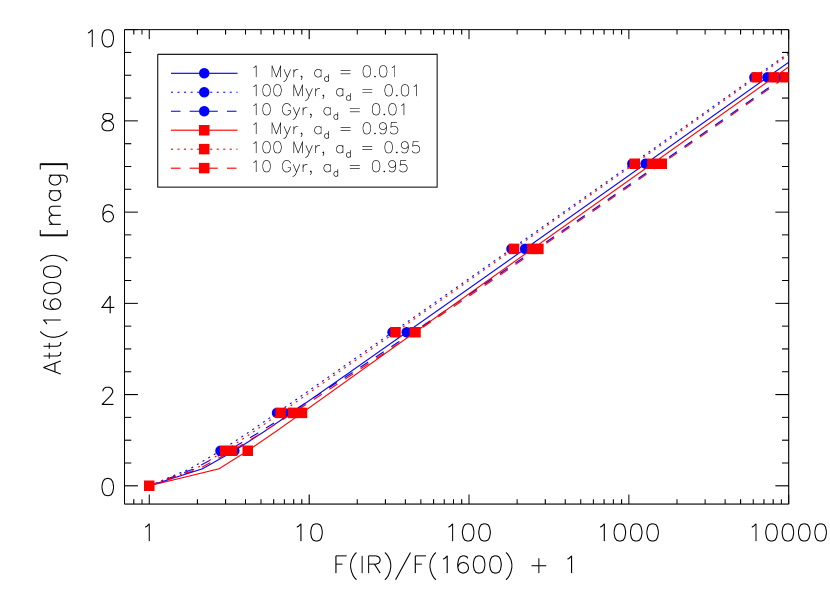
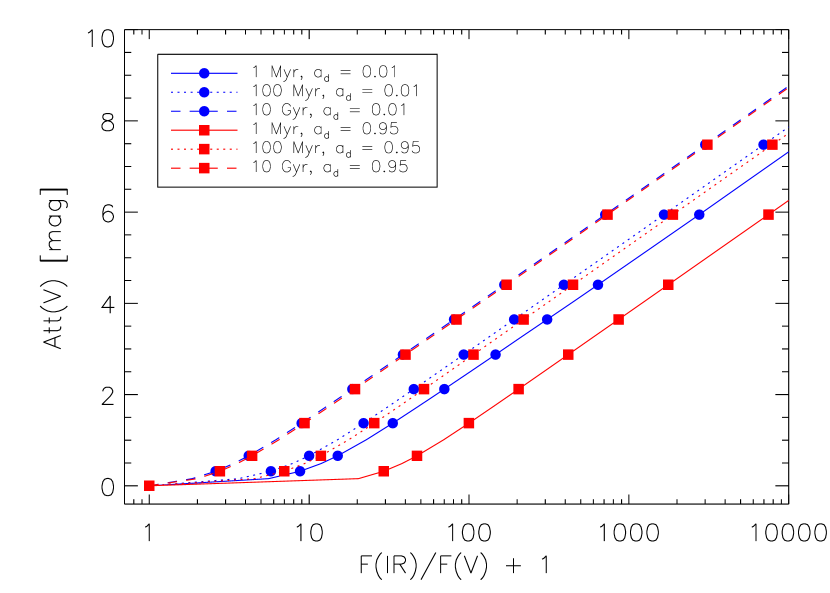
In Figure 1, we plot the the relationship between and for the Meurer, Heckman, & Calzetti (1999) 1600 Å, HST/WFPC2 F218W, V, and K bands assuming a constant star formation, 10 Myr old, solar metallicity SED, , and the full range of dust parameters (see above). The most surprising result is that this relationship is not sensitive to the type of dust (MW/SMC) or the local dust distribution (homogeneous/clumpy). This is true not just for the four bands plotted in Fig. 1, but for all the ultraviolet, optical, and near-infrared. Less surprising is that this relationship in the V and K bands is sensitive to the presence of stars outside the dust. The dusty and shell geometries follow similar curves while the cloudy geometry follows a different curve. For the cloudy geometry, as the attenuation is increased the dominance of the band flux from the stars outside the dust increases to the point where the band flux no longer depends on the attenuation (i.e. the flux from the stars attenuated by dust is much less than the flux from the unattenuated stars). This is not the case for the dusty and shell geometries where band flux continues to decrease with increasing attenuation since all the stars are inside the dust and attenuated to some degree.
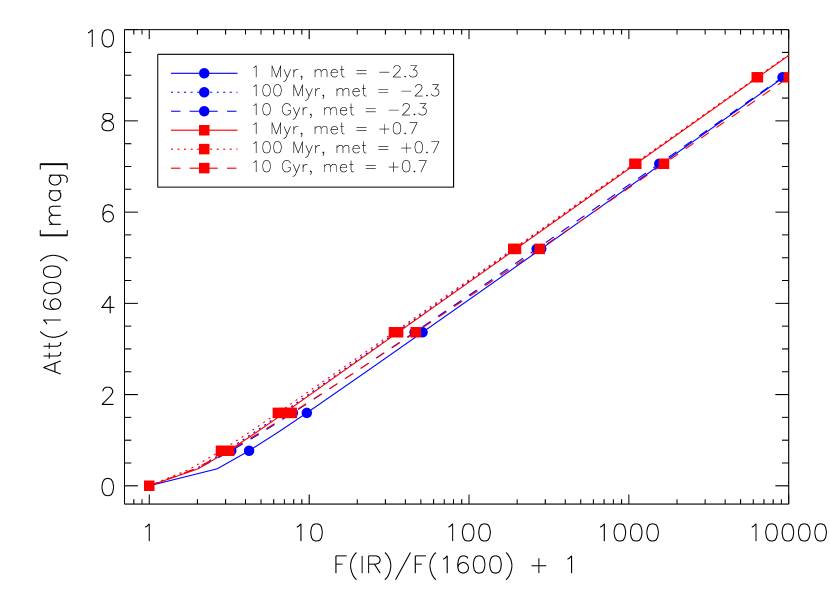
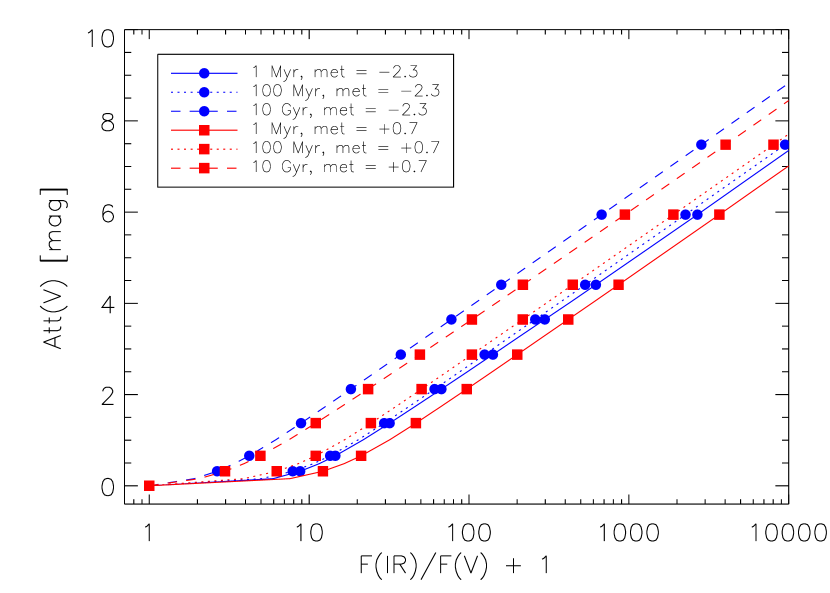
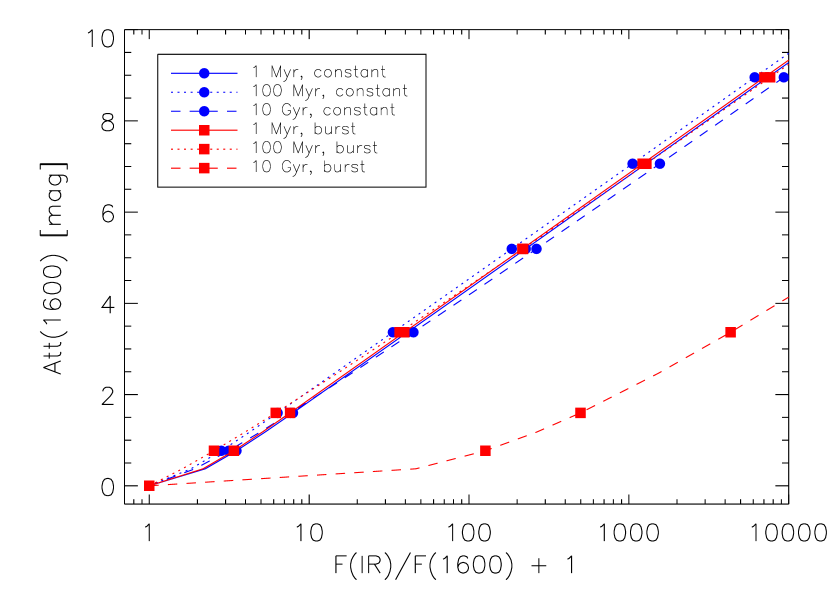
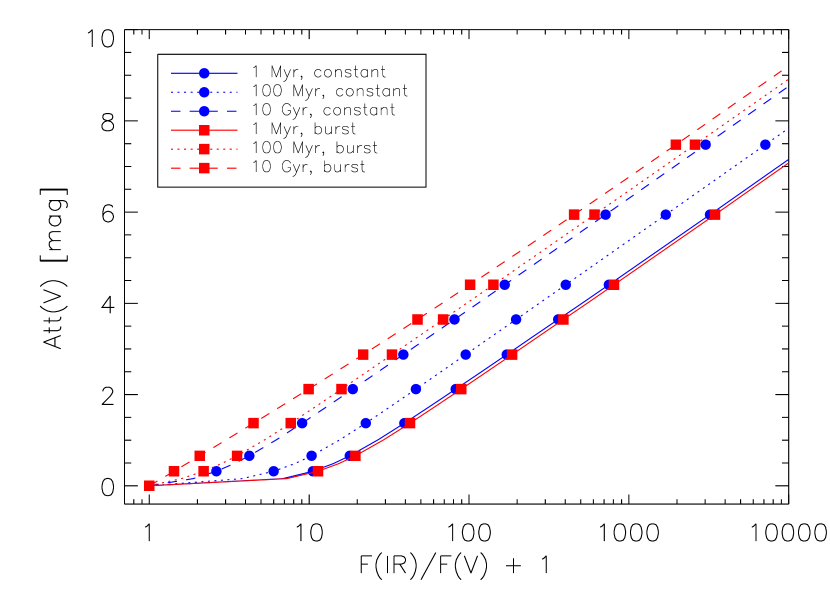
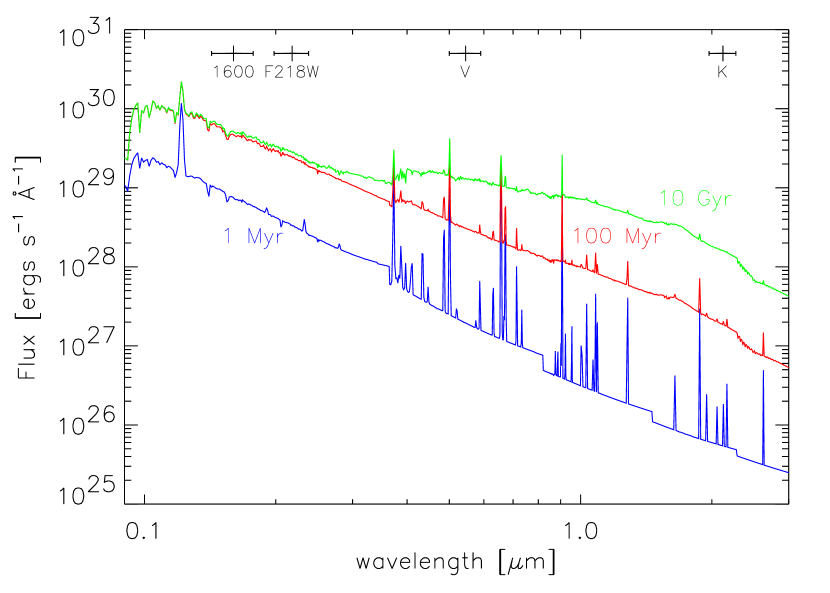
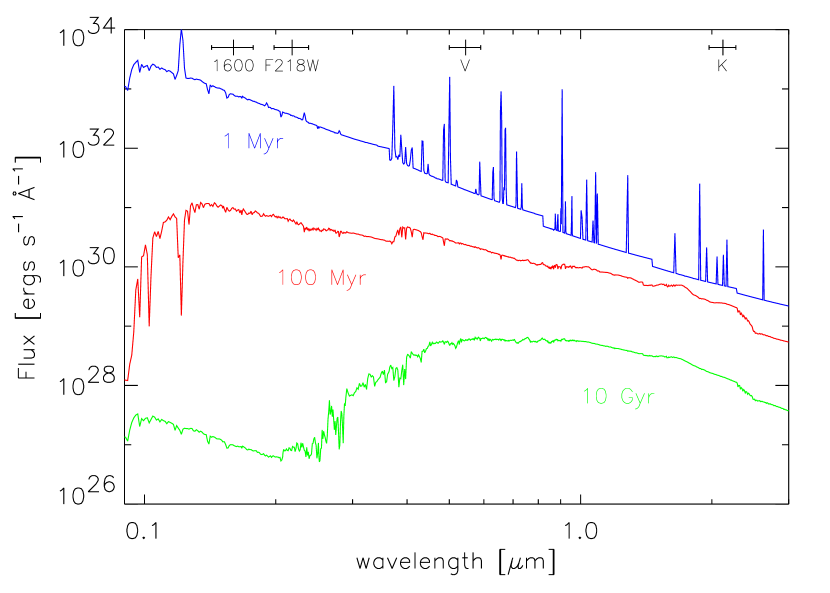
The dependence of the versus relationship can be sensitive to the shape of the intrinsic SED. Example SEDs for solar metallicity stellar populations are given in Fig. 3. The dependence of on is illustrated in Figure 2 which shows the dependence of the flux ratio relationship for the 1600 and V bands on age, metallicity, star formation rate, and value. In the 1600 band, the relationship is quite similar for most choices of the above parameters except for old burst stellar populations (Fig. 2c). Our calibration of versus is indistinguishable from that presented in Meurer, Heckman, & Calzetti (1999) after correcting for 30% difference between (Helou et al., 1988) and as does not include the hotter dust detected in the mid-IR. In the V band, the relationship is dependent, in decreasing order of dependence, on age, burst versus constant star formation, metallicity, and value of . The qualitative dependence of other UV bands ( Å) is similar to that seen for the 1600 Å band. The behavior of optical and near-infrared bands is similar to that of the V band with the increasing dependence on the above parameters as increases.
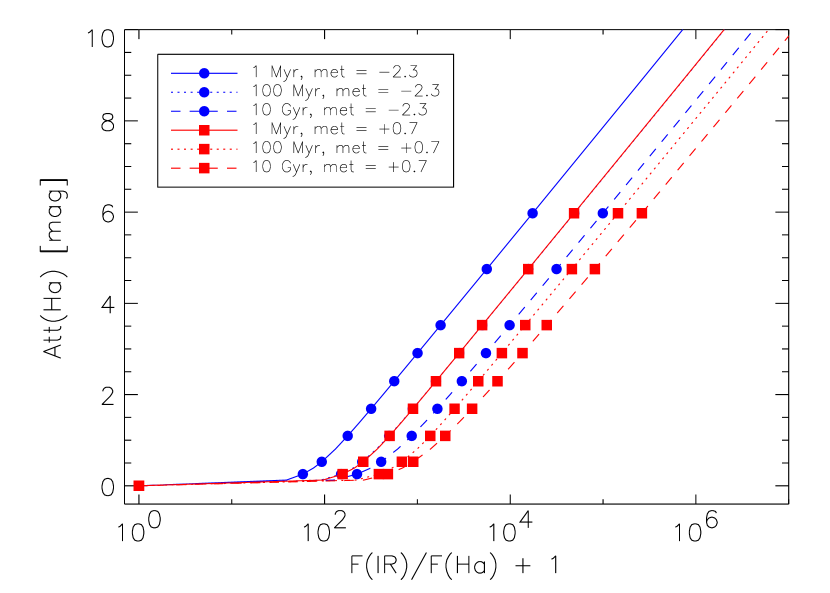
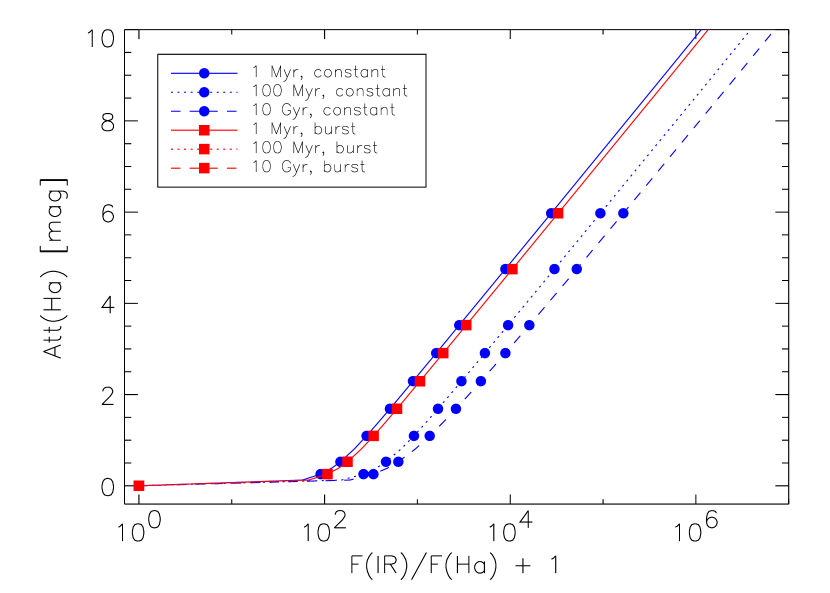
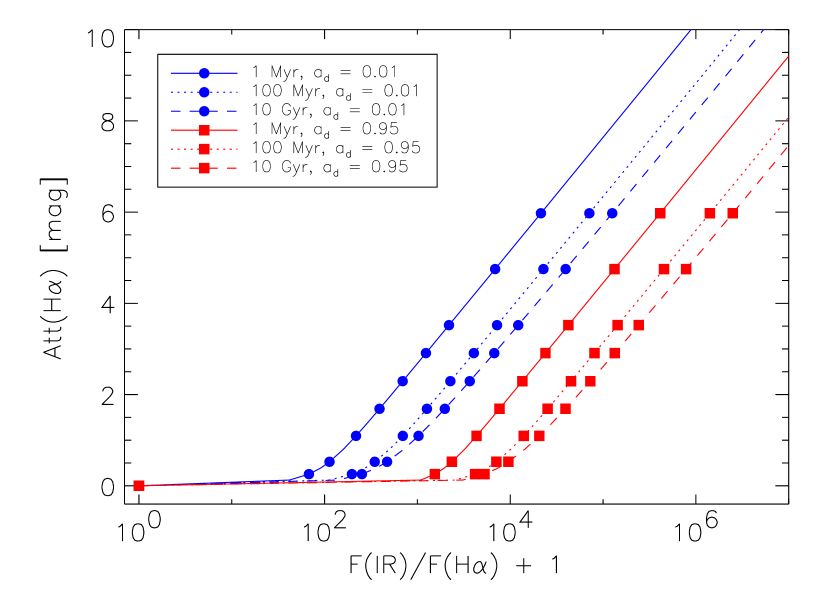
The behavior of emission lines is similar to that seen for the V band, but has notable differences. Figure 4 gives the relationship between and for the same parameters plotted in Fig. 2. One obvious difference between the V band and H emission line is that the behavior with age is reversed. In particular, the H emission line is very sensitive to the value of since the strength of H is directly proportional to .
The behavior of the flux ratio versus relationship can be qualitatively explained fairly easily. The general shape of the curves (see Fig. 1) is seen to be non-linear versus below and nearly linear versus above . The non-linearity of the curve is due to changing relationship between the effective wavelength of energy absorption and that of . The linear portion of the curve is in the realm where is changing slowly (most of the galaxy’s luminosity is now being emitted in the IR), but continues to decrease due to the steady increase of . Thus, above the curves for all wavelengths have the same slope but different offsets reflecting the contributions different wavelengths make to . Below , the effective wavelength of the 1600 and F218W bands is similar to that of the energy absorption resulting in a nearly linear relationship. This is not the case for the V and K bands where their effective wavelengths are much larger than that of the energy absorption and, therfore, the V and K bands have non-linear relationships below . The different behaviors of the star/gas/dust geometry relationships (see Fig. 1) is due to the presence of stars outside the dust in the cloudy geometry and the lack of external stars in the shell and dusty geometries.
The behavior of the relationship for different stellar populations (Fig. 2 & 4) can be easily explained using the same arguments used above. The invariance of the relationship for the 1600 band is a reflection of the dominance of the UV in the energy absorption. The only time when the 1600 relationship is not invariant is for old burst stellar populations where the lack of significant UV flux means that the optical dominates the energy absorption (Fig. 3b). This is confirmed by the linear behavior over the entire range of the V band curves for old stellar populations (Fig. 2d). The separation of the curves in the V band is the result of the different contributions the V band flux makes to the absorbed energy for different stellar populations. The older the stellar population, the more the optical contributes to the and, thus, the more linear the V band relationship is below .
2.3 Fits to the Relationships
In order to use this method, we have fit the relationship between and for combinations of stellar age, metallicity, burst or constant star formation, and values of . We chose to fit the combination of the dusty/shell geometry curves. However, this does not limit the use of our fits in the UV since the cloudy geometry curves follow the dusty/shell geometry curves. This does limit the use of our fits for wavelengths longer than 3500 Å to cases where the dominant stellar sources are embedded in the dust such as starburst galaxies. The curvature of the relationship at required us to use a combination of a 3rd order polynomial for and a 2nd order polynomial for . As a result the fit is:
| (2) |
where
For each curve fit with equation 2, 9 numbers result; 4 coefficients for , 3 coefficients for , the values where and ( and ). Computing the value corresponding to a particular value of then involves specifying the stellar age, metallicity, star formation type, and value of which specify the appropriate fit coefficients to use. The parameters of these fits are available from the lead author as well as an IDL function which implements the calibration.
3 Comparison with Radio Method
While the flux ratio method is relatively simple and makes sense qualitatively, to be truly convincing, we need an independent method for determining the attenuation for comparison. Fortunately, radio observations combined with measured hydrogen emission line fluxes allows just such a test. The radio method (Condon, 1992) is based on the measurement of the free-free radio flux from H II regions and the assumption of Case B recombination (Osterbrock, 1989). From the thermal flux, the number of Lyman continuum photons absorbed by the gas can be calculated and, thus, the intrinsic fluxes of the hydrogen emission lines. Comparison of the intrinsic and observed line fluxes gives the attenuation at the emission line wavelength. The major source of uncertainty in the radio method is that radio observations contain both thermal (free-free) and nonthermal (synchrotron) components. For example, approximately a quarter of the flux measured at 4.85 GHz has a thermal origin. The decomposition of the measured radio flux into thermal and nonthermal components imparts a factor of two uncertainty in the resulting thermal flux (Condon, 1992).
Unfortunately, determining attenuations using the flux ratio method is the most uncertain for hydrogen emission line fluxes. This is due to the lack of knowledge of the value of , the fraction of Lyman continuum photons absorbed by dust (Fig. 4). We can take guidance from the work done by DeGioia-Eastwood (1992) on six Large Magellanic Cloud H II regions. She found that ranges from 0.21 – 0.55 using the approximation of Petrosian, Silk, & Field (1972). We will use this range of values in the calculations below.
To do this comparison, we need galaxies which have hydrogen emission line fluxes, infrared, and radio observations. In the IUE sample of starburst galaxies (Kinney et al., 1993), there are 10 galaxies with Balmer emission line (Storchi-Bergmann, Calzetti, & Kinney, 1994; Mcquade, Calzetti, & Kinney, 1995), IRAS (Calzetti et al., 1995), and 4.85 GHz observations (Gregory & Condon, 1991; Wright et al., 1994, 1995, 1996). The 10 galaxies are NGC 1313, 1569, 1614, 3256, 4194, 5236, 5253, 6052, 7552, & 7714. The emission lines were measured in a aperture which was usually large enough to include the entire starburst region but not the entire galaxy. While the IRAS and 4.85 GHz observations usually encompass the entire galaxy, the majority of the IRAS and radio flux emerges from the starburst region which should minimize the importance of the aperture mismatch (Calzetti et al., 1995).
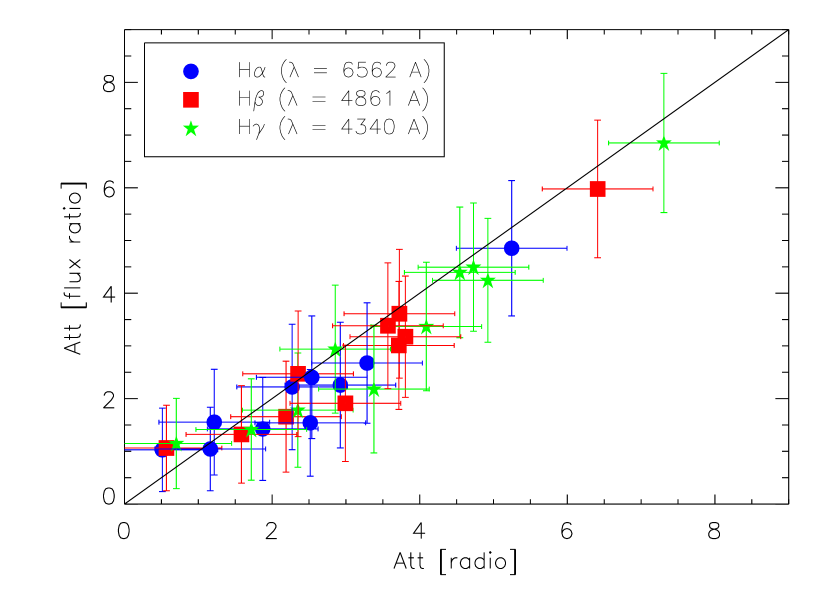
Figure 5 shows the comparison between the attenuations suffered by the H, H, and H emission lines in the 10 galaxies as calculated from the flux ratio method and the radio method. While the measurements of each galaxy’s three Balmer emission lines are related (through Case B recombination theory), plotting all three reduces the observational uncertainty due to the emission line flux measurements and increases the range of attenuations tested. For the radio method, we calculated the intrinsic emission line strengths using eqs. 3 & 5 of Condon (1992) assuming a and Table 4.2 of Osterbrock (1989). The attenuations were then easily calculated from the intrinsic and observed emission line fluxes.
For flux ratio method, the flux was computed by integrating each galaxy’s 8 to 1000 SED after extrapolating the IRAS fluxes to longer wavelengths using a modified black body (dust emissivity ). The temperature and flux level of the modified black body were determined from the IRAS 60 and 100 fluxes. ISO observations of starburst galaxies support the use of a single temperature for the large dust grain emission (Krügel et al., 1998). The 10 galaxies’ fluxes were 1.6 to 2.5 times larger than their FIR fluxes (as defined by Helou et al. (1988)) due to our inclusion of the mid-infrared hot, small dust grains. We assumed the 10 galaxies were undergoing constant star formation and used their measured metallicities (Calzetti et al., 1995) for the calculation of their attenuations from their measured infrared to emission line flux ratios. The error bars in Fig. 5 for the flux ratio method reflect the range of attenuations possible, assuming the galaxy age is between 1 Myr and 10 Gyr and values between 0.21 and 0.55.
The attenuations calculated for the two methods agree well within their associated uncertainties. This gives confidence that the flux ratio method for calculating attenuations is valid. Of course, this conclusion would be strengthened with a larger sample of galaxies and observations with similar apertures at optical, infrared, and radio wavelengths. Such infrared observations will become possible with the launch of SIRTF.
4 Application to Individual Galaxies
The application of the flux ratio method to determining the UV attenuations of individual galaxies is straightforward. Due to the insensitivity in the UV of this method to the star, gas, or dust parameters (Figs. 1a,b & 2a,c,e), the observed is directly related to . This is not the case for optical and near-IR wavelengths where this method is sensitive to the intrinsic SED shape (Figs. 2b,d,f) and, to a lesser extent, the geometry of the star, gas and dust (Fig. 1c,d).
In order to construct the full UV through near-IR attenuation curve for a galaxy, an iterative procedure must be followed. The steps of the iterative procedure are:
-
1.
Assume an intrinsic SED shape (stellar age, metallicity, star formation type, and value),
-
2.
Construct a candidate attenuation curve using the observed UV-NIR and our calibration of versus ,
-
3.
Deredden the observed UV-NIR SED with the candidate attenuation curve,
-
4.
Compare the dereddened SED (step 3) with the assumed SED (step 1),
-
5.
Repeat steps 1-4 to find the attenuation curve which produces the best match between the dereddened SED and the assumed SED.
We attempted to apply this iterative method to 10 starburst galaxies listed in the previous section as they have UV, optical, near-infrared, infrared, and radio observations. We were unable to find fits which would simultaneously fit the UV/optical/NIR continuum and the H emission attenuations derived from the ratio observations. To do the fitting we used the measured metallicities of the galaxies and allowed the galaxy’s age and type of star formation as well as the the value of to vary. The fact that we could not find fits to any of the 10 galaxies is an indication that at least two stellar populations are contributing to the observed SED. But, the correlation between the radio and flux ratio H attenuations is strong evidence that only one of these stellar populations is ionizing the gas and is the main source for the dust heating (see Fig. 5). This stellar population is likely the starburst and the other stellar population is likely that of the underlying galaxy. The existence of two stellar populations, each with different stellar parameters and attenuation curves, complicates the fitting to the point where the number of free parameters can exceed the number of observed data points. This illustrates one of the main difficulties of applying the flux ratio method. The calibration of the flux ratio method is based on the assumption that there is a single stellar population responsible for the UV-NIR continuum and IR dust emission. When a second stellar population contributes to the continuum or IR dust emission, applying the flux ratio method will become more difficult.
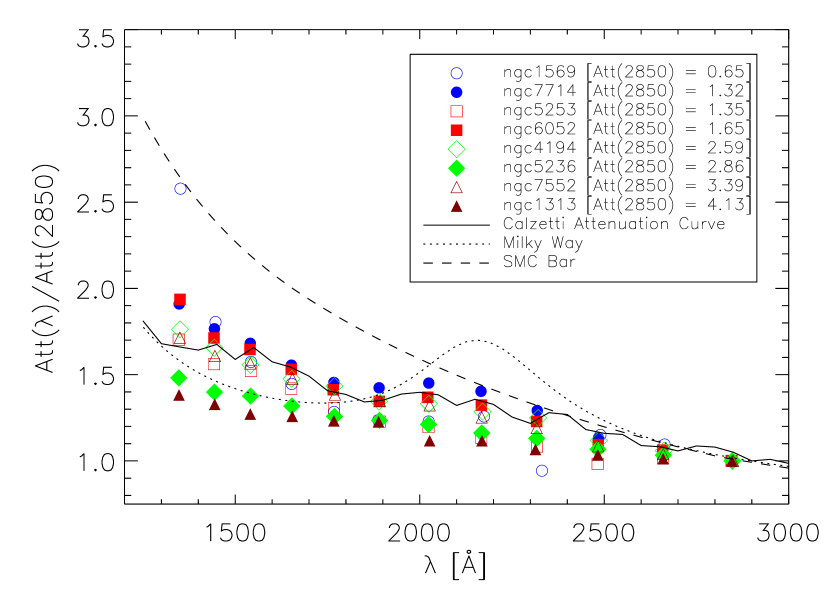
While we cannot determine the UV-NIR attenuation curves for the 10 starburst galaxies, we can determine their UV attenuation curves for the following reason. The identification of the stellar population heating the dust as the same population ionizing the gas leads us to conclude that the same population also emits the majority of the galaxies’ UV continua since UV photons are the main source of dust heating for starburst galaxies (see §3). Figure 6 gives the attenuation curves for 8 of the 10 starburst galaxies used in the previous section. The other 2 galaxies were excluded as they did not have near UV data. All of the curves lack a substantial 2175 Å bump in agreement with previous work (Calzetti, Kinney, & Storchi-Bergmann, 1994; Gordon, Calzetti, & Witt, 1997). There is also a trend towards steeper attenuation curves as decreases which is the behavior predicted by Witt & Gordon (1999). The curves are similar to the “Calzetti attenuation curve” (Calzetti, Kinney, & Storchi-Bergmann, 1994; Calzetti, 1997) derived for the IUE sample of galaxies. As the Calzetti attenuation curve is an average, the scatter of our individual curves is likely to be real. While the 8 galaxies in Fig. 6 were included in the Calzetti (1997) work, the method used to derive the Calzetti attenuation curve was quite different from the flux ratio method. This is further evidence that the flux ratio method can determine the attenuation curves of starburst galaxies.
5 Discussion
We have presented a method which uses the flux ratio to determine for individual starburst galaxies. The major strengths of this method is that it is almost completely independent of the type of dust (MW/SMC) or the local distribution of dust (homogeneous/clumpy), and is only weakly dependent on the global distribution of stars and dust (presence/lack of stars outside dust). In the ultraviolet, this method is independent of the intrinsic stellar SED except for the case of very old burst populations. In the optical/near-IR, this method is dependent on the intrinsic stellar SED shape. The flux ratio method is not based on the properties of the nebular emission (as is the radio method), but on the properties of the stellar continuum and IR dust emission. As a result, it is applicable to any wavelength from the UV to near-IR and not just wavelengths with hydrogen emission lines.
A major limitation of the flux ratio method is that the majority of the observed UV through far-infrared flux must originate from a single stellar population (either burst or constant star formation). An example of a case where the flux ratio method would not be applicable would be a heavily embedded starburst in a galaxy with a second older, less embedded stellar population. At UV and IR wavelengths the starburst would dominate, but at optical and near-IR wavelengths the older population would dominate. Another possible limitation is that the measured infrared flux is assumed to be a direct measure of the flux absorbed by the dust. If the infrared radiation in not emitted symmetrically (e.g., for non-symmetrically distributed dust which is optical thick in the infrared), then the measured infrared flux will not be a direct measure of the flux absorbed by the dust. The assumption that the infrared flux is a direct measure of the flux absorbed by the dust is crucial to the accuracy flux ratio method. It is possible to account for these weaknesses by increasing the complexity of the modeling by adding additional stellar populations and/or complex dust geometries. Such increases in the complexity of the modeling will necessarily require more detailed spectral and spatial observations as the number of model parameters increases.
For any starburst galaxy with UV and IR observations, the UV attenuation curve can be calculated using the flux ratio method. Starburst galaxies are likely to be the best case for applying the flux ratio method as the intensity of the starburst greatly increases the probability that the UV and IR flux originate from only the starburst population. If the parameters (age, metallicity, etc) of the intrinsic SED shape can be determined and the contamination from the underlying stellar population removed, then the attenuation of the starburst galaxy can be determined not only for the UV, but also for the optical and near-IR.
Thus, the flux ratio method seems very promising for determining the dust attenuations of individual galaxies. The easiest way to ensure the basic assumptions of our calibration of the flux ratio method are met is to take high spatial resolution observations of starburst regions in nearby galaxies or integrated galaxy observations of intense starburst galaxies at any distance. This would ensure that the UV through far-infrared flux originates from the starburst and not the host galaxy. Examples of these observations would be super star clusters in nearby galaxies (Calzetti et al., 1997) and observations of high-z starburst galaxies which have been shown to be similar to local starbursts except more intense (Heckman et al., 1998). Currently, both types of UV, optical, and near-IR observations can and have been done, but the far-infrared observations needed await SIRTF. SIRTF will have the spatial resolution and sensitivity to do both types of observations.
The ability to determine the UV dust attenuation curve for individual starburst galaxies will facilitate the study of dust in different star formation environments. The traditional explanation for the differences seen in the dust extinction between the Milky Way, LMC, and SMC has been that the different metallicities of the three galaxies lead to different dust grains. Work on starburst galaxies with metallicities between 0.1 and 2 times solar which found most of these galaxies possess dust which lacks a 2175 Å bump (Calzetti, Kinney, & Storchi-Bergmann, 1994; Gordon, Calzetti, & Witt, 1997) seriously called this explanation into question. Subsequent work on the extinction curves in both the SMC (Gordon & Clayton, 1998) and LMC (Misselt, Clayton, & Gordon, 1999) found that the extinction curves toward star forming regions in both galaxies were systematically different than those toward more quiescent regions. These results imply that dust near sites of active star formation is different due to processing (Gordon, Calzetti, & Witt, 1997) of existing dust or formation of new dust (Dwek, 1998). The processing interpretation is supported by recent work in the Milky Way along low density sightlines toward the Galactic Center (Clayton, Gordon, & Wolff, 1999). This work found that sightlines which show evidence of processing (probed by N(Ca II)/N(Na I)) have weaker 2175 Å bumps and stronger far-UV extinctions than most other Milky Way sightlines (Cardelli, Clayton, & Mathis, 1989). The actual processing mechanism is not simple as the dust towards the most intense star formation in the LMC (30 Dor) has a weak 2175 Å bump, but the dust towards the most intense star formation in the SMC, which has only 10% the strength of 30 Dor, has no 2175 Å bump. In order to completely characterize the dust near starbursts, attenuation curves for a large sample of starbursts galaxies with a range of metallicity, dust content, and starburst strength are needed.
In conjunction with investigating the impact environment has on dust properties, the ability to determine individual starburst galaxy attenuation curves will simplify the study of the starburst phenomenon. By being able to remove the effects of dust accurately, the age and strength of starburst galaxies and regions in galaxies can be determined with confidence. In the realm of high redshift starburst galaxies (), the ability to determine the dust attenuation of individual galaxies will arrive with the advent of deep SIRTF/MIPS imaging of fields with existing rest-frame UV imaging (eg., Hubble Deep Fields). The currently large uncertainty on the global star formation history of the universe due to the effects of dust on starburst galaxies will be greatly reduced (Madau, Pozzetti, & Dickinson, 1998; Pettini et al., 1998; Steidel et al., 1999).
References
- Calzetti (1997) Calzetti, D. 1997, AJ, 113,162
- Calzetti et al. (1995) Calzetti, K., Bohlin, R. C., Kinney, A. L., Storchi-Bergmann, T., & Heckman, T. M. 1995, ApJ, 443, 136
- Calzetti & Heckman (1999) Calzetti, D. & Heckman, T. M. 1999, ApJ, 519, 27
- Calzetti, Kinney, & Storchi-Bergmann (1994) Calzetti, D., Kinney, A. L., & Storchi-Bergmann, T. 1994, ApJ, 429, 582
- Calzetti et al. (1997) Calzetti, D., Meurer, G. R., Bohlin, R. C., Garnett, D. R., Kinney, A. L., Leitherer, C., & Storchi-Bergmann, T. 1997, AJ, 114, 1834
- Cardelli, Clayton, & Mathis (1989) Cardelli, J. A., Clayton, G. C., & Mathis, J. S. 1989, ApJ, 345, 245
- Clayton, Gordon, & Wolff (1999) Clayton, G. C., Gordon, K. D., & Wolff, M. J. 1999, ApJ, submitted
- Condon (1992) Condon, J. J. 1992, ARA&A, 30, 575
- DeGioia-Eastwood (1992) DeGioia-Eastwood, K. 1992, ApJ, 397, 542
- Dwek (1998) Dwek, E. 1998, ApJ, 501, 643
- Ferrara et al. (1999) Ferrara, A., Bianchi, S., Cimatti, A., & Giovanardi, C. 1999, ApJS, in press (astro-ph/9903078)
- Fioc & Rocca-Volmerange (1997) Fioc, M. & Rocca-Volmerange, B. 1997, A&A, 326, 950
- Fioc & Rocca-Volmerange (1999) Fioc, M. & Rocca-Volmerange, B. 1999, in preparation
- Gordon, Calzetti, & Witt (1997) Gordon, K. D., Calzetti, D., & Witt, A. N. 1997,ApJ, 487, 625
- Gordon & Clayton (1998) Gordon, K. D. & Clayton, G. C. 1998, ApJ, 500, 816
- Gregory & Condon (1991) Gregory, P. C. & Condon, J. J. 1991, ApJS, 75, 1011
- Heckman et al. (1998) Heckman, T. M., Robert, C., Leitherer, C., Garnett, D. R., van der Rydt, F. 1998, ApJ, 503, 646
- Helou et al. (1988) Helou, G., Khan, I. R., Malek, L., & Boehmer, L. 1988, ApJS, 68, 151
- Kennicutt (1998) Kennicutt, R. C. 1998, ARA&A, 36, 189
- Kinney et al. (1993) Kinney, A. L., Bohlin, R. C., Calzetti, D., Panagia, N., & Wyse, R. F. G. 1993, ApJS, 86, 5
- Krügel et al. (1998) Krügel, E., Siebenmorgen, R., Zota, V., & Chini, R. 1998, A&A, 331, L9
- Madau, Pozzetti, & Dickinson (1998) Madau, P., Pozzetti, L., & Dickinson, M. 1998, ApJ, 498, 106
- Massa, Savage, & Fitzpatrick (1983) Massa, D., Savage, B. D., & Fitzpatrick, E. L. 1983, ApJ, 266, 662
- Mathis (1986) Mathis, J. S. 1986, PASP, 98, 995
- Mcquade, Calzetti, & Kinney (1995) Mcquade, K., Calzetti, D., & Kinney, A. L. 1995, ApJS, 97, 331
- Meurer, Heckman, & Calzetti (1999) Meurer, G. R., Heckman, T. M., & Calzetti, D. 1999, ApJ, 512, 64
- Meurer et al. (1997) Meurer, G. R., Heckman, T. M., Lehnert, M. D., Leitherer, C., & Lowenthal, J. 1997, AJ, 114, 54
- Misselt, Clayton, & Gordon (1999) Misselt, K. A., Clayton, G. C., & Gordon, K. D. 1998, ApJ, 515, 128
- Osterbrock (1989) Osterbrock, D. E. 1989, Astrophysics of Gaseous Nebulae and Active Galactic Nuclei (Mill Valley, CA: University Science Books)
- Petrosian, Silk, & Field (1972) Petrosian, V., Silk, J., & Field, G. B. 1972, ApJ, 177, L69
- Pettini et al. (1998) Pettini, M., Kellogg, M., Steidel, C. C., Dickinson, M., Adelberger, K. L., & Giavalisco, M. 1998, ApJ, 508, 539
- Sawicki & Yee (1998) Sawicki, M. & Yee, H. K. C. 1998, AJ, 115, 1329
- Schaerer (1999) Schaerer, D. 1999, in Building the Galaxies: from the Primordial Universe to the Present, eds. F. Hammer et al. (Gif-sur-Yvette: Editions Frontiéres), in press
- Smith et al. (1995) Smith, D. A., Herter, T., Haynes, M. P., Beichman, C. A., Gautheir, & T. N., III 1995, ApJ, 439, 623
- Steidel et al. (1999) Steidel, C., Adelberger, K. L., Giavalisco, M., Dickinson, M., & Pettini, M. 1999, ApJ, 519, 1
- Storchi-Bergmann, Calzetti, & Kinney (1994) Storchi-Bergmann, T., Calzetti, D., & Kinney, A. L. 1994, ApJ, 429, 572
- Takagi, Arimoto, & Vansevičius (1999) Takagi, T., Arimoto, N., & Vansevičius, V. 1999, ApJ, in press (astro-ph/9902219)
- Wang & Heckman (1996) Wang, B. & Heckman, T. M. 1996, ApJ, 457, 645
- Witt & Gordon (1996) Witt, A. N. & Gordon, K. D. 1996, ApJ, 463, 681
- Witt & Gordon (1999) Witt, A. N. & Gordon, K. D. 1999, ApJ, in press
- Witt, Thronson, & Capuano (1992) Witt, A. N., Thronson, H. A., & Capuano, J. M. 1992, ApJ, 393, 611
- Wright et al. (1994) Wright, A. E., Griffith, M. R., Burke, B. F., & Ekers, R. D. 1994, ApJS, 91, 111
- Wright et al. (1995) Wright, A. E., Griffith, M. R., Burke, B. F., & Ekers, R. D. 1995, ApJS, 97, 347
- Wright et al. (1996) Wright, A. E., Griffith, M. R., Hunt, A. J., Troup, E., Burke, B. F., & Ekers, R. D. 1996, ApJS, 103, 145