Is the exponential distribution a good approximation of dusty galactic disks?
Abstract
We investigate how significant the spiral structure is on calculations concerning radiative transfer in dusty spiral galaxies seen edge-on. The widely adopted exponential disk model (i.e. both the stars and the dust are distributed exponentially in the radial direction and also perpendicular to the plane of the disk) is now subject to a detailed comparison with a realistic model that includes spiral structure for the stars and the dust in the disk. In particular, model images of galaxies with logarithmic spiral arms are constructed, such that the azimuthally averaged disk is exponential in radius and in height, as the observations suggest. Then, pure exponential disk models (i.e. with no spiral structure) are used to fit the edge-on appearance of the model images. As a result, the parameters derived after the fit are compared to the real values used to create the spiral-structured images. It turns out that the plain exponential disk model is able to give a very good description of the galactic disk with its parameters varying only by a few percent from their true values.
Key Words.:
(ISM:) dust, extinction – galaxies: photometry – galaxies: spiral – galaxies: structure1 Introduction
Modeling the dust and stellar content of spiral galaxies is a very crucial procedure needed for the correct interpretation of the observations. The amount of interstellar dust embedded inside spiral galaxies, the way that dust is distributed within spiral galaxies and also the extinction effects of the dust to the starlight are some of the questions that can be answered by performing radiative transfer modeling of individual spiral galaxies.
One very important thing that needs consideration when doing such analysis is the right choice of the stellar and dust distributions. In particular, the galactic disk is a quite complex system, where stars and dust are mixed together usually in a spiral formation. For this reason, one has to use realistic distributions able to reproduce quite accurately the observations. On the other hand, simple mathematical expressions for these distributions are chosen in order to keep the free parameters to the minimum.
For the distribution of the starlight in the disk of spiral galaxies, the exponential function is very widely in use. This simple mathematical expression is able to describe the distribution of stars in both directions, radially and perpendicular to the disk. Decomposition techniques used by different authors in order to separate the bulge and the disk component strongly support this argument. For galaxies seen face-on (and at moderate inclination angles), radial profile fitting (e.g. Freeman 1970), fitting to azimuthally averaged profiles (e.g. Boroson 1981), as well as ellipse fitting techniques to 2D images (e.g. de Jong 1995) show that the exponential in the radial distance is a good representation of galactic disks with only small deviations mainly due to the spiral structure of the galaxy (see Serna 1997). Other works like those of Shaw & Gilmore (1989) and de Grijs (1997) dealing with modeling of edge-on galaxies support the idea that exponential functions are good representations also for the (vertical to the disk) direction.
Performing radiative transfer modeling of edge-on galaxies, Xilouris et al. (1997, 1998, 1999) found that exponential functions for the luminosity density of the stars in the disk as well as for the extinction coefficient give an excellent description of the observations. The advantage of modeling galaxies in the edge-on configuration is that the integration of light along the line of sight is able to cancel out most of the structure of the galaxies (i.e. spiral structure) and therfore allows for simple functions such as exponentials to give good representation of the observations. Thus, although in the face-on configuration a large variation between arm and interarm regions might be present for both the stars and the dust (White & Keel 1992, Corradi et al. 1996, Beckman et al. 1996, Gonzalez et al. 1998), in the edge-on case an average description of the galaxy characteristics can be obtained quite accurately. We are going to investigate the validity of this argument by comparing the exponential distributions with more realistic distributions which include spiral structure.
In Sect. 2 we describe the method that we use to address this problem and in Sect. 3 we present the results of our calculations. Finally, in Sect. 4 we summarize our work.
2 Method
The method that we follow in this work consists of two basic steps. In the first step, model galaxies with realistic spiral structure are constructed. After a visual inspection of the face-on appearance of these models to see the spiral pattern, we create their edge-on images which are now treated as real observations. In the second step we fit these “observations” with a galaxy model where now the galactic disk is described by the widely used plain exponential model. In this way, a comparison between the parameters derived from the fitting procedure and those used to produce the artificial “observations” can be made and thus a quantitative answer about the validity of the plain exponential model as an approximation to galactic disks can be given.
2.1 Artificial spiral galaxies
We adopt a simple, yet realistic, distribution of stars and dust in the artificial galaxy. A simple expression is needed in order to keep the number of free parameters as small as possible and thus have a better control on the problem. A realistic spiral structure is that of logarithmic spiral arms (Binney & Merrifield 1998). Thus, a simple but realistic artificial spiral galaxy is constructed by imposing the logarithmic spiral arms as a perturbation on an exponential disk. In this way, the azimuthally averaged face-on profile of the artificial galaxy has an exponential radial distribution.
For the stellar emissivity we use the formula
| (1) |
In this expression the first part describes an exponential disk, the second part gives the spiral perturbation and the third part describes the bulge, which in projection is the well-known -law (Christensen 1990). Here , and are the cylindrical coordinates, is the stellar emissivity per unit volume at the center of the disk and and are the scalelength and scaleheight respectively of the stars in the disk.
The amplitude of the spiral perturbation is described by the parameter . When the plain exponential disk is obtained, while the spiral perturbation becomes higher with larger values of . Another parameter that defines the shape of the spiral arms is the pitch angle . Small values of mean that the spiral arms are tightly wound, while larger values produce a looser spiral structure. The integer gives the number of the spiral arms.
For the bulge, is the stellar emissivity per unit volume at the center, while is defined by
| (2) |
with being the effective radius of the bulge and and being the semi-major and semi-minor axis respectively of the bulge.
For the dust distribution we use a similar formula as that adopted for the stellar distribution in the disk, namely
| (3) |
where is the extinction coefficient at wavelength at the center of the disk and and are the scalelength and scaleheight respectively of the dust. Here gives the amplitude of the spiral perturbation of the dust. Note that the angle here need not be the same as that in Eq. (1). The stellar arm and the dust arm may have a phase difference between them.
| Parameter | Units | B band |
|---|---|---|
| mag/arcsec2 | ||
| kpc | ||
| kpc | ||
| mag/arcsec2 | ||
| kpc | ||
| – | ||
| – | ||
| kpc | ||
| kpc | ||
| – | ||
| – | ||
| – | ||
| degrees |

For the parameters describing the exponential disk of the stars and the dust as well as the bulge characteristics we use the mean values derived from the B-band modeling of seven spiral galaxies presented in Xilouris et al. (1999).
Since the most dominant spiral structure in galaxies is that of the two spiral arms (Kennicutt 1981; Considere & Athanassoula 1988; Puerari & Dottori 1992) we only consider models where . Galaxies with strong one-arm structure do exist, but they constitute a minority (Rudnick & Rix 1998).
For the parameter we take the value of 0.4. With this value the optical depth calculated in the arm region is roughly twice as much as in the inter-arm region. This is in good agreement with studies of overlapping galaxies (e.g. White & Keel 1992).
For we use the value of 0.3 resulting (with the extinction effects included) in a spiral arm amplitude of mag, which is a typical amplitude seen in radial profiles of face-on spiral galaxies and reproduces the desired strength for the spiral arms (Rix & Zaritsky 1995).
For the pitch angle we consider the cases of and , which give a wide variety of spiral patterns from tightly wound to loosely wound. All the parameters mentioned above are summarized in Table 1.
The radiative transfer is done in the way described by Kylafis & Bahcall (1987; see also Xilouris et al. 1997). As described in detail in these references, the radiative transfer code is capable of dealing with both absorption and scattering of light by the interstellar dust and also of allowing for various distributions for the stars and the dust.
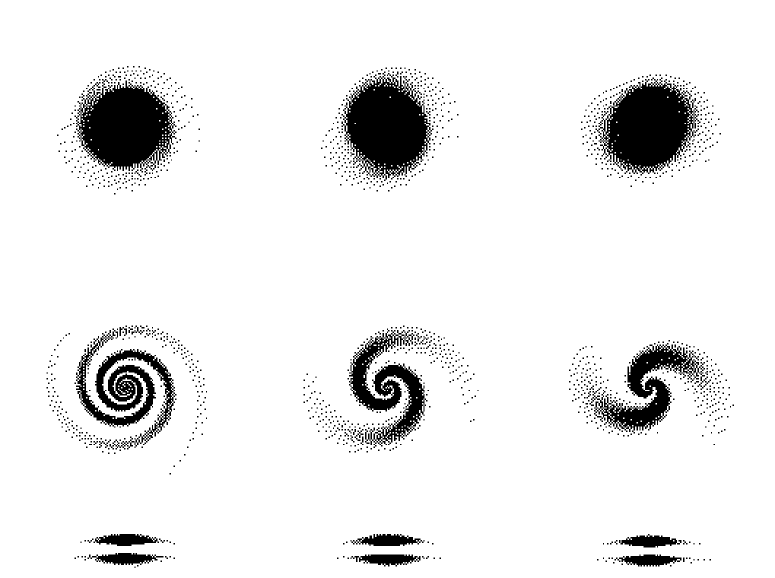
Using the model described above and the parameters given in Table 1 we produce the images shown in Fig. 1. The top three panels of this figure show the face-on surface brightness distribution of such a galaxy for the three values of the pitch angle ( and ) from left to right. The spiral structure is evident in these images with the spiral arms being more tightly wound for and looser when .
In the middle three panels of Fig. 1 we show the distribution of the optical depth when the galaxy is seen face-on for the three different values of the pitch angle mentioned above. In these pictures one can follow the spiral pattern all the way to the center of the galaxy since the bulge is assumed to contain no dust.
Finally, in the last three panels of Fig. 1 one can see the corresponding edge-on appearance of the galaxies shown face-on in the top three panels.
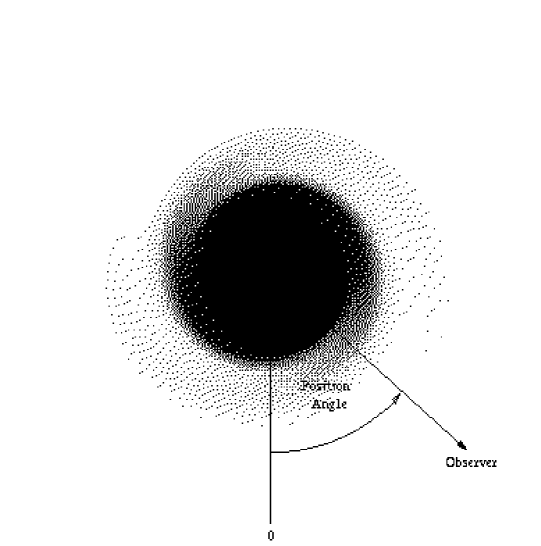
One thing that is very obvious from Fig. 1 (top and middle panels) is that the galaxy is no more axisymmetric as it is the case in the plain exponential disk model. The spiral structure that is now embedded in the model as a perturbation in the disk has broken this symmetry. Thus, in order to do a full analysis of the problem we have to examine the galaxy from different azimuthal views (position angles). To do so we have created nine edge-on model galaxies (for each of the three different pitch angles considered here), covering the range from to with a step of for the position angle. For the definition of the position angle, see Fig. 2. Since the galaxy has exactly the same appearance in the interval from to , we only consider the range of position angles mentioned above.
To demonstrate this asymmetry more quantitatively we have computed the central edge-on optical depth () for all these nine model galaxies. Unlike the plain exponential disk model where can be calculated analytically (), here we have to perform numerical integration of Eq. (3) along the line of sight that passes through the center. The value of is shown in Fig. 3 as a function of the position angle. In order to have the full coverage in position angle (from to ), the values calculated in the interval ( - ) were repeated in the interval ( - ). In this figure, the three models constructed with pitch angles and are denoted with circles, squares and diamonds respectively. In all three cases, a variation of the optical depth with position angle is evident. The largest variation is found for the case where the pitch angle is and it is . It is obvious that all the values are around the true value of 27, used to construct the galaxy (see Table 1).
2.2 The fitting procedure
The edge-on images created as described earlier are now treated as “observations” and with a fitting procedure we seek for the values of the parameters of the plain exponential disk that gives the best possible representation of the “observations”. The fitting algorithm is a modification of the Levenberg-Marquardt routine taken from the Minipack library. The whole procedure is described in detail in Xilouris et al. (1997).
Preliminary tests have shown that the derived values of the parameters describing the bulge are essentially identical to the real values used to construct the model images. In order to simplify the fitting process and since we are only interested in the disk, the bulge parameters were kept constant during the fit. Six parameters are now free to vary. These are the scalelength and scaleheight of the stellar disk with its central surface brightness (, and respectively) as well as the scalelength and scaleheight of the dust and the central edge-on optical depth (, and respectively).
3 Results


Figure 4 shows six graphs. The top left graph gives the variation of the deduced edge-on optical depth of the galaxy as we observe it from different angles. From this graph one can see that the variation of the deduced optical depth from different points of view is no more than 6% different than the mean value of the optical depth. Furthermore, a comparison with Fig. 3, which shows the real value of the optical depth, reveals that there is no systematic error in the derived value. The deviations are equally distributed around , which is what we would have without the spiral structure. The variation is of the same order of magnitude regardless of the pitch angle. The top right graph in Fig. 4 presents the deduced central luminosity of the disk. This graph shows that the variation of the inferred central luminosity of the stellar disk is very small and it is weakly dependent on the pitch angle. In the middle left graph of Fig. 4 the derived scalelength of the dust is presented. The variation of the derived value is about 5% for the 10-degree pitch angle and goes up to 17% for the 30-degree pitch angle. The increase of the variation with increasing pitch angle is expected, because for large pitch angles the spiral arms are loosely wound, thus causing the galaxy to be less axisymmetric. As a result, from some points of view the dust seems to be more concentrated to the center of the galaxy and from other points of view more extended.
In the middle right graph of Fig. 4, that shows the scalelength of the stars, it is evident that the same effect occurs for the stars as well. Certain points of view give the impression of a more centrally condensed disk, while others of an extended disk. The fact that we have taken the stellar and the dust spiral structure to be in phase (i.e. the dust spiral arms are neither trailing nor leading the stellar spiral arms) causes the deduced scalelengths of the dust and the stars to also vary in phase. The case of a phase difference is examined below.
The bottom left and bottom right graphs of Fig. 4 show the variation of the scaleheight of the dust and the stars respectively. The variation of both scaleheights is negligible. This is an attribute of the formula we used for our artificial galaxy. Since the spiral variation we added to the exponential disks is not a function of it is expected that in the direction our artificial galaxy behaves exactly as the exponential model.
There are indications (van der Kruit & Searle 1981;Wainscoat et al. 1989) that the dust arms are not located exactly on the stellar arms. Thus, we re-created the edge-on images, but this time the stellar spiral arms were set to lead the dust arms by 30 degrees. We then fitted the new images with the exponential model and the deduced parameters are shown in Fig. 5. As in Fig.4, the top left graph of Fig. 5 shows the optical depth as a function of position angle. A comparison of this graph with the corresponding graph in Fig. 4 reveals that the variation of the values derived from the new set of images is significantly larger. The origin of this effect is the fact that the dust is either in front of the stars (for some position angles) or behind the stars (for other position angles). A strong dependence on the pitch angle is also evident. Note, however, that the mean of all the derived values is unaffected. The same effect can be seen on the top right graph of Fig. 5, where the derived central luminosity of the disk is plotted. The variation of the central luminosity is again larger than in the previous case, but the mean value is equal to the true one.
In the middle left graph of Fig. 5 we show the scalelength of the dust as a function of the position angle. The variation of the derived dust scalelength can differ as much as 25% for a galaxy with pitch angle equal to 30 degrees. But again the mean value for all position angles is identical to the one we used to create the images. In the middle right graph one can see that the scalelength of the stars also varies as much as 30%,but the mean of all the derived values is the correct one.
The left and right bottom graphs show the variation of the scaleheights of the dust and the stars, which is about 10% for the worst case of a 30-degree pitch angle and is practically zero for a galaxy with more tight arms.
The most important conclusion of all the graphs is that the derived values of all quantities tend to distribute equally around the real value we used to create the artificial images.
4 Summary
In our attempt to investigate how significant the spiral structure is when doing radiative transfer modeling of spiral galaxies seen edge-on, we constructed a model galaxy with very prominent spiral arms in the disk. This quite realistic image of the galaxy is now treated as observation and the widely adopted exponential model for the galactic disk is now fitted to the data.
This analysis shows that the plain exponential disk model is a very accurate description for galactic disks seen edge-on with only small deviations of its parameters from the real ones (typically a few percent). Furthermore, the variation from the real parameters would be averaged out if we could see the same galaxy from several point of views. This is of course impossible for an individual galaxy, but suggests that if the exponential model is used for a statistical study of many edge-on galaxies no systematic error is introduced. Thus, we conclude that the exponential model is a very good approximation of the galactic disks.
References
- Binney (1998) Binney J., Merrifield M., 1998, Galactic Astronomy, Princeton University Press, New Jersey
- Boroson (1981) Boroson T., 1981, ApJS, 46, 177
- Beckman et. al. (1996) Beckman J.E., Peletier R.F., Knapen J.H., Corradi R.L.M.,Gentet L.J., 1996, ApJ, 467 175
- Christensen (1990) Christensen H. J., 1990, MNRAS, 246, 535
- Considere & Athanassoula (1988) Considere S., Athanassoula E., 1988, A&AS., 76, 365
- Corradi et al (1996) Corradi R.L.M., Beckman J.E., Simonneau E., 1996 MNRAS, 282, 1005
- de Grijs (1997) de Grijs R., 1997, A&AS 190, 1303
- de Jong (1995) de Jong R.S., 1995, Ph.D. thesis, Groningen University
- Freeman (1970) Freeman K. C., 1970, ApJ, 160, 811
- Gonzalez et al. (1998) Gonzalez R.A., Allen R.J., Dirsch B., Ferguson H.C., Calzetti D., Panagia N., 1998, ApJ, 506 152
- Kennicutt, (1981) Kennicutt R. C. Jr., 1981, AJ, 86, 1847
- Kylafis & Bahcall (1987) Kylafis N. D., Bahcall J.N., 1987, ApJ, 317, 637
- Puerari & Dottori (1992) Puerari I., Dottori H. A., 1992, A&AS., 93, 469
- Rix & Zaritsky (1995) Rix H-W., Zaritsky D., 1995, ApJ, 447, 82
- Rudnick & Rix (1998) Rudnick G., Rix H-W., 1998, AJ, 116,1163
- Serna (1997) Serna A., 1997, A&A, 318, 741
- (17) Shaw M.A., Gilmore G., 1989, MNRAS, 237, 903
- (18) van der Kruit P. C., Searle L., 1981, A&A, 95, 116
- Wainscoat et. al. (1989) Wainscoat R.J., Freeman K. C., Hyland A. R., 1989, ApJ, 337, 163
- White & Keel (1992) White R.E., Keel W.C., 1992, Nat, 359, 129
- Xilouris et al. (1997) Xilouris E. M., Kylafis N. D., Papamastorakis J., Paleologou E. V., Haerendel G. 1997, A&A, 325, 135
- Xilouris et al. (1998) Xilouris E. M., Alton P. B., Davies J. I., et al., 1998, A&A, 331, 894
- Xilouris et al. (1999) Xilouris E. M.,Byun Y.I., Kylafis N. D., Paleologou E. V., Papamastorakis J., 1999, A&A, 344, 868