SCUBA observations of NGC 6946††thanks: Based on observations at the James Clerk Maxwell Telescope. JCMT is operated by The Joint Astronomy Centre on behalf of the Particle Physics and Astronomy Research Council of the United Kingdom, the Netherlands Organisation for Scientific Research, and the National Research Council of Canada.
Abstract
We present sub-millimetre images of the spiral galaxy NGC 6946 at 450 and 850 m. The observations have been carried out using the scan/map imaging mode of the Sub-millimetre Common User Bolometer Array (SCUBA) at the James Clark Maxwell Telescope (JCMT). The comparison with a 12CO(2-1) line emission map from IRAM and with an U-band image, clearly shows that the 850 m emission is associated with molecular gas and bright star-forming regions, tracing the spiral arms. We place an upper limit of 0.7 for the V-band optical depth of dust associated with a diffuse atomic component.
Key Words.:
dust, extinction – Galaxies: individual: NGC 6946 – Galaxies: spiral – Galaxies: ISM – Galaxies: structure1 Introduction
Until recently,the main source of Far-Infrared (FIR) data for spiral galaxies has come from the IRAS satellite. The availability of instruments capable of observing at m, like those onboard the satellite ISO, has allowed the detection of large amounts of cold dust, much colder than IRAS was able to detect. Spiral galaxies are found to have a dust content similar to the one in the Galaxy (Alton et al. 1998a ).
Cold temperatures (T20K) can be reached by diffuse dust heated by the general interstellar radiation field, while dust close to star-forming region is hotter (T50K; Whittet WhittetBook1992 (1992)). Since diffuse dust is the main contributor to the internal extinction in a galaxy, observations of cold dust help to trace its opacity. Additionally, ISO observations have suggested that the dust distribution is more extended than the stellar disk (Alton et al. 1998a ; Bianchi, Davies & Alton 1999b ). If this is confirmed, observation of the distant universe may be severely biased, because of the large cross section of the dust disks.
Unfortunately, the poor resolution () of the current FIR images does not allow detailed studies of the spatial distribution of dust. Higher resolution can be achieved in the sub-mm, but a high sensitivity is required because of the fainter dust emission. High sensitivity and resolution are both characteristics of the recently developed SCUBA sub-mm camera. Only a few large nearby galaxies have been observed with SCUBA, notably the highly inclined galaxy NGC 7331 (Bianchi et al. BianchiMNRAS1998 (1998)) and the edge-on galaxy NGC 891 (Alton et al. 1998b ; Israel et al. IsraelA&A1999 (1999)). The observed dust emission is found to correlate well with the molecular gas phase, dominant in the centre. However, a dust component associated with the atomic gas is needed to explain the dust and gas column density at large galactocentric distance along the major axis of NCG 891 (Alton et al. AltonSub1999 (1999)).
In this Letter we present SCUBA observations of the face-on galaxy NGC 6946. Because the galaxy is larger than the camera field of view, images have been produced with the scan-mapping technique, chopping within the observed field. The observation and the data reduction needed to restore the source signal are described in the next section. The description and the discussion of the results are given in Section 3.
2 Observations and data reduction
NGC 6946 was observed at 450 m and 850 m, during April 10, 11 and June 17, 18, 19, 20 1998.
SCUBA consists of two bolometer arrays of 91 elements optimised to observe at 450 m and 37 elements optimised at 850 m, covering a field of view of about 2.3 arcmin (Holland et al. HollandMNRASprep1998 (1999)). The camera, mounted on the Nasmyth focus of the telescope can be used simultaneously at both wavelengths, by means of a dichroic beamsplitter.
In the scan-map mode, the telescope scans the source at a rate of 24 arcsec per second, along specific angles to ensure a fully sampled map. Meanwhile the secondary chops with a frequency of 7.8 Hz within the observed field. While this ensures a correct subtraction of the sky background, the resulting maps unfortunately have the profile of the source convolved with the chop. The profile of the source is restored deconvolving the chop from the observed map by mean of Fourier Transform (FT) analysis.
Scan-maps of NGC 6946 presented here are fully sampled over an area of 8x8. Each set of observations consisted of six scans, with different chop configurations: chop throws of 20, 30 and 65 along RA and Dec are needed to retrieve the final image. Data have been reduced using the STARLINK package SURF (Jenness & Lightfoot JennessMan1997 (1999)). Images were first flat-fielded to correct for different sensitivities of the bolometers. Noisy bolometers were masked and spikes from transient detections removed by applying a 5- clip. A correction for atmospheric extinction was applied, using measures of the atmosphere opacities taken several times during the nights of observation. Zenith optical depth varied during the six nights, with and . The 450 m opacity on the last night was too high () for the source to be detected and therefore the relative maps were not used for this wavelength. Because of the chopping in the source field, each bolometer sees a different background: a baseline, estimated from a linear interpolation at the edges of the scan, has been subtracted from each bolometer.
Sky fluctuations were derived from the time sequence of observations for each bolometer, after the subtraction of a model of the source, obtained from the data themselves. The images have then been corrected by subtacting the systematic sky variations from each bolometer.
Data taken with the same chop configuration were rebinned together into a map in an equatorial coordinate frame, to increase the signal to noise. Six maps with 3 pixels were finally obtained for each wavelength, combining 33 and 25 observations, at 850 and 450 m, respectively. In each of the six maps the signal from the source is convolved with a different chop function. The final deconvolved image is retrieved using the Emerson II technique (Holland et al. HollandMNRASprep1998 (1999); Jenness, Lightfoot & Holland JennessProc1998 (1998)). Essentially, for each rebinned image, the FT of the source is derived by dividing the FT of the map by the FT of the chop function, a simple sine-wave. Since the division boosts up the noise near the zeros of the sine-wave, different chop configuration are used. For the chosen chop throws, the FT of the chop functions do not have coincident zeros, apart from the zero frequency. A smoother FT of source can therefore be obtained, and the final image is retrieved by the applying an inverse FT.
Unfortunately the deconvolution introduces artifacts in the images, like a curved sky background. This may be due to residual, uncorrected, sky fluctuation at frequencies close to zero, where all the chops FT goes to zero. Work to solve this problem is ongoing (Jenness, private communication). To enhance the contrast between the sky and the source, we have modelled a curved surface from the images, masking all the regions were the signal was evidently coming from the galaxy. The surface has been then subtracted from the image.
Calibration was achieved from scan-maps of Uranus, that were reduced in the same way as the galaxy. Integrated flux densities of Uranus were derived, for each observing period, using the STARLINK package FLUXES (Privett, Jenness & Matthews PrivettMan1998 (1998)) for JCMT planetary fluxes. Comparing data for each night we derived a relative error in calibration of 8 per cent and 17 per cent, for 850 m and 450 m respectively. From the planet profile, the beam size was estimated: FWHMs of 15.2 and 8.7 were measured for the beam at 850 and 450 m, respectively. To increase the signal to noise, the 850 m image has been smoothed with a gaussian of 9 thus degrading the beam to a FWHM of 17.7 The 450 m image has been smoothed to the same resolution as for the 850 m one, to facilitate the comparison between features present in both. The sky in the smoothed images is 3.3 mJy beam-1 at 850 m and 22 mJy beam-1 at 450 m.
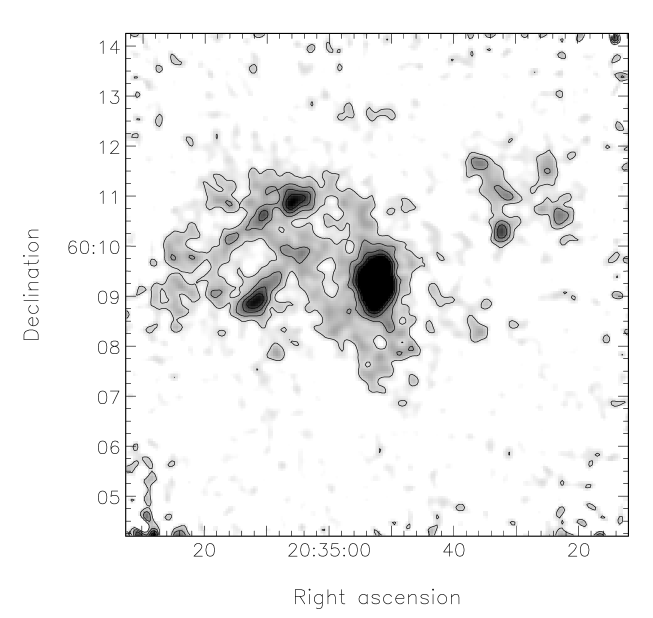
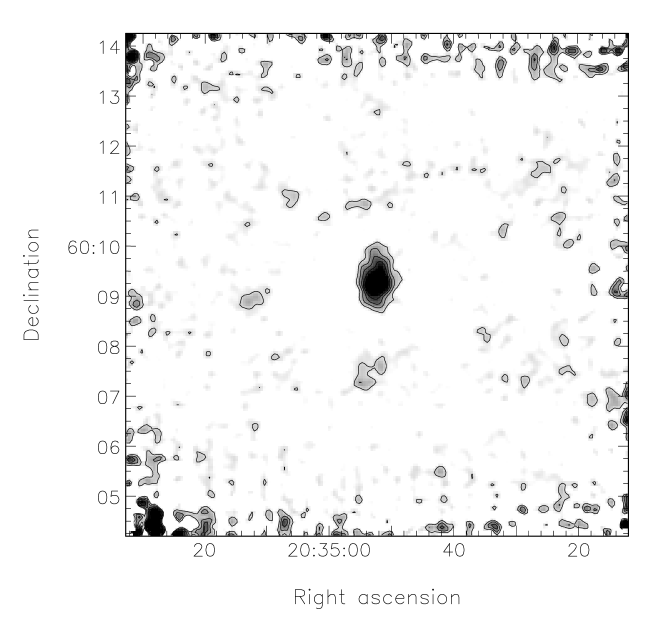
The final images, after removing the curved background and smoothing are presented in Fig. 1. For each wavelength, the grey scale shows all the features 1-, while contours starts at 3- and have steps of 3-.
3 Results and discussion
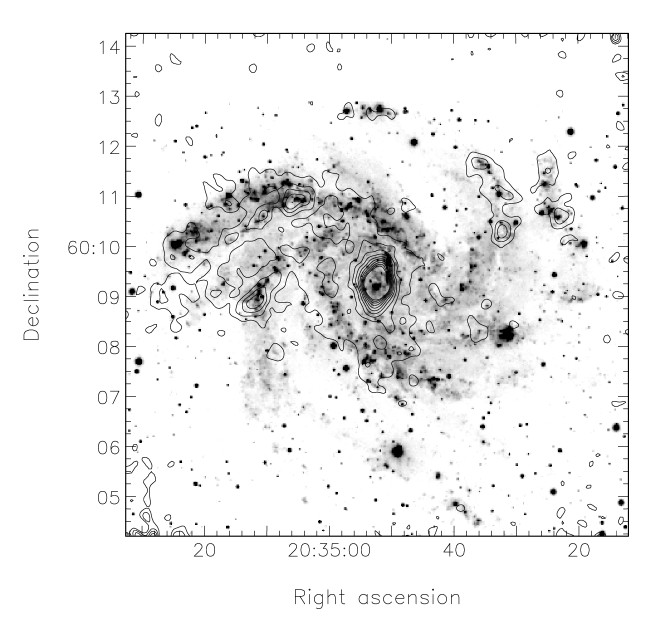
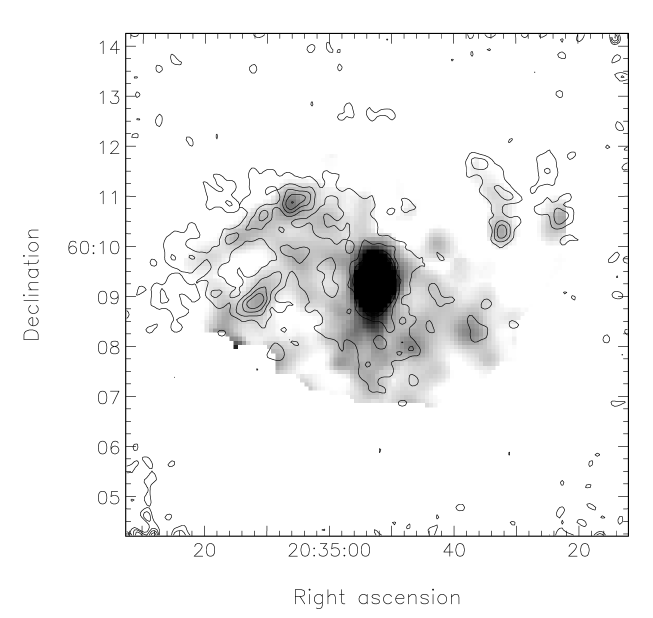
The 850 m image shows a bright nucleus and several features that clearly trace the spiral arms (in Fig. 1 the sub-mm contours are overlayed to a U-band image of the galaxy (Trewhella TrewhellaThesis1998 (1998))) As already seen in optical images (Tacconi & Young TacconiApJ1990 (1990)), the spiral arms originating in the northeast quadrant are more pronounced than the others, where only regions with bright HII regions have detectable emission in the sub-mm. The 850 m image presents a striking similarity to the 12CO(2-1) emission map in Sauty, Gerin & Casoli (SautyA&A1998 (1998)), observed with the IRAM 30m radiotelescope with a comparable resolution (13). The image of molecular line emission is also shown in Fig. 1, with the 850 m contour overlayed. The similarity with the sub-mm image is hardly surprising, since the molecular gas is the dominant component of the ISM over the optical disk of NGC 6946 (Tacconi & Young TacconiApJ1986 (1986)). The nucleus is elongated in the direction north-south, as observed for the central bar of molecular gas (Ishizuki et al. IshizukiApJ1990 (1990); Regan & Vogel ReganApJL1995 (1995)).
Emission associated with a more diffuse atomic gas component cannot be detected, for several reasons. First of all the face-on inclination of the galaxy: since dust is optically thin to its own emission a faint component can be observed only if the dust column density is large. This is the case for the high inclination galaxies NGC 7331 (Bianchi et al. BianchiMNRAS1998 (1998)) and NGC 891 (Alton et al. 1998b ), where higher signal to noise were obtained coadding a smaller number of observations. The large face-on galaxy M51 has been observed using the scan-map mode and confirms the necessity of long integrations (Tilanus, private communication). Furthermore, chopping inside the source field removes not only the emission from the sky but also from possible components with a shallow gradient: this may be the case for dust associated with the flat HI distribution in NGC 6946 (Tacconi & Young TacconiApJ1986 (1986)). Finally, a faint diffuse emission could have been masked by the mentioned artifacts and subtracted together with the curved background.
The 450 m image is much noisier than the 850 m one, because of the larger sky emission at this wavelength. Only a central region of 075 x 15 can be clearly detected, although most of the features at a 3- level correspond to regions emitting in the long wavelength image.
The temperature from the two sub-mm fluxes can be measured only for the central region with significant 450 m flux. Sub-mm fluxes are 1.2 Jy at 850 m and 9.3 Jy at 450 m. We checked for the contribution of the strong 12CO(3-2) line emission at 346 GHz to the 850 m flux using the observation of NGC 6946 centre in this line reported by Mauersberger et al. (MauersbergerA&A1999 (1999)) for a beam of 21. Converting from the original units to Jansky (Braine et al. BraineA&A1995 (1995)) and averaging over the 30 GHz bandwidth of 850 m filter (Matthews MatthewsMan1999 (1999)), a flux density of 80 mJy/beam is derived. As pointed out by the referee, the pointing of the Mauersberger et al. observations was offset from the strongly concentrated central emission by nearly one beamwidth in the SW direction. Using the 12CO(2-1) image as a template of the higher state emission, we corrected for the offset and derived the flux for the central region, larger than the beam. A total contribution of 0.6 Jy is derived for the 346 GHz line (50% of the 850 m flux). However, this large contribution is due to the high density and gas temperature of the central region. In fact, for 850 m fluxes on larger apertures, the contamination is much smaller: Israel et al. (IsraelA&A1999 (1999)) derive a contribution of only 4% to the total sub-mm flux of NGC 891. Therefore, the derivation of cold dust temperature at large galactic radii (Alton et al. 1998b ) are not severely biased. We did not correct the 450 m flux for the contribution of the 12CO(6-5) line, that lies at the edge of the filter (Israel et al. IsraelA&A1999 (1999)).
After the correction, the dust temperature of the central region is T=346 K, where the large quoted error comes from the calibration uncertainties. Here and in the following, dust temperature and masses are computed using the emissivity law derived by Bianchi, Davies & Alton (1999a ) from observation of diffuse FIR emission and estimates of optical extinction in the Galaxy. For a wavelength dependence of the emissivity , changing smoothly from to at 200 m (Reach et al. ReachApJ1995 (1995)) they obtain , where is the extinction efficiency in the V-band (1.5; Casey CaseyApJ1991 (1991)). Lacking information outside of the centre, a mean temperature for a larger aperture can be derived from the lower resolution IRAS and ISO images at 100 m and 200 m (Alton et al. 1998a ). The total flux inside the B-band half light aperture (5 in diameter) is 24040 Jy at 100 m and 28040 Jy at 200 m (Bianchi, Davies & Alton 1999b ). The temperature from IRAS and ISO fluxes is T=242 K.
We derived a point-to-point correlation between the 850 m flux and the 12CO(2-1) line, resampling the sub-mm image to the same pixel size as the line emission map (10, roughly equivalent to both beam sizes) and using all positions with signals larger than 3- in both observations. A linear correlation is found (Fig. 2). Assuming a mean dust grain radius 0.1m and mass density =3 g cm-3 (Hildebrand HildebrandQJRAS1983 (1983)), the emissivity of Bianchi et al. (1999a )111 Using the Bianchi et al. emissivity for at any wavelength, results in dust column densities smaller by only 15%. and T=24K, the dust column density and hence the mass along the line of sight can be easily computed. The molecular gas column density has been derived from the 12CO(2-1) emission using a conversion factor appropriate for the 12CO(1-0) emission in the general ISM in the Galaxy (X=1.8 1020 cm-2 K-1 km-1 s; Maloney MaloneyProc1990 (1990)) and a line ratio I(2-1)/I(1-0)=0.4 (Casoli et al. CasoliA&A1990 (1990)). The slope of the linear correlation can then be converted into a gas-to-dust mass ratio of 17020, a value very close to the local Galactic one (160; Sodroski et al. SodroskiApJ1994 (1994)). This confirms the association of dust with the local dominant phase of the galactic ISM.

The dust content of NGC 6946 has been studied carrying out an energy balance between the stellar emission in the optical and the FIR dust emission, through the help of radiative transfer models. If an exponential disk is used to model the dust distribution, a central face-on optical depth is needed to explain the FIR emission (Evans EvansThesis1992 (1992); Trewhella TrewhellaThesis1998 (1998); Bianchi et al. 1999b ). The 850 m image clearly show that the dust distribution is more complex, but still the column densities derived from the sub-mm flux support the idea of an optically thick dust distribution. Under the same assumption of the previous paragraph, the diffuse component of the north-east spiral arms at a 3- level corresponds to a V-band optical depth . The quite high optical depth corresponding to the sky noise () shows how difficult is to obtain sub-mm images of dust emission in the outskirts of face-on galaxies, even for a high sensitivity instrument like SCUBA. Thus, possible extended dust distributions (Alton et al. 1998a ) are better revealed through deep sub-mm imaging of edge-on galaxies, where the dust column density is maximized. However, the high inclination makes the interpretation of the dust emission along the line of sight more complex.
Acknowledgements.
It is a pleasure to thank Gerald Moriarty-Schieven and Tim Jenness, for their support during observations and data reduction, respectively. The paper has also benefited from the help of U. Klaas and R. Chini.References
- (1) Alton P. B., Trewhella M., Davies J. I., et al., 1998a, A&A, 335, 807
- (2) Alton P. B., Bianchi S., Rand R. J., et al., 1998b, ApJ, 507, L125
- (3) Alton P. B., Xilouris E. M., Bianchi S., et al., 1999, A&A, submitted
- (4) Bianchi S., Alton P. B., Davies J. I., Trewhella M., 1998, MNRAS, 298, L49
- (5) Bianchi S., Davies J. I., Alton P. B., 1999a, A&A, 344, L1
- (6) Bianchi S., Davies J. I., Alton P. B., 1999b, in preparation
- (7) Braine J., Krügel E., Sievers A., Wielebinski R., 1995, A&A, 295, L55
- (8) Casey S. C., 1991, ApJ, 371, 183
- (9) Casoli F., Clausset F., Combes F., Viallefond F., Boulanger F., 1990, A&A, 233, 357
- (10) De Vaucouleurs G., De Vaucouleurs A., Corwin, H. G. Jr., et al., 1991. Third Reference Catalogue of Bright Galaxies. Cambridge University Press, Berlin
- (11) Evans R., 1992. PhD thesis, University of Wales Cardiff
- (12) Hildebrand R. H., 1983, QJRAS, 24, 267
- (13) Holland W. S., Robson E. I., Gear W. K., et al., 1999, MNRAS, 303, 659
- (14) Ishizuki S., Kawabe R., Ishiguro M., et al., 1990, ApJ, 355, 436
- (15) Israel F. P., Van Der Werf P. P, Tilanus R. P. J., 1999, A&A, 344, L83
- (16) Jenness T., Lightfoot J. F., 1999. Starlink User Note 216.5
- (17) Jenness T., Lightfoot J. F., Holland W. S., 1998. In Phillips T. G., ed., Advanced Technology MMW, Radio, and Terahertz Telescopes, vol. 3357 of Proc. SPIE. pp. 548–558
- (18) Maloney P., 1990. In Thronson H., Shull H., eds., The Interstellar Medium in Galaxies. Kluwer Academic Publishers, Dordrecth
- (19) Matthews H. E., 1999. The James Clerk Maxwell Telescope: a guide for the prospective user. Joint Astronomy Center, Hilo, Hawaii
- (20) Mauersberger R., Henkel C., Walsh W., Schulz A., 1999, A&A, 341, 256.
- (21) Privett G., Jenness T., Matthews H., 1998. Starlink User Note 213.2
- (22) Reach W. T., Dwek E., Fixsen, D. J., et al., 1995, ApJ, 451, 188
- (23) Regan M. W., Vogel S. N., 1995, ApJL, 452, L21
- (24) Sauty S., Gerin M., Casoli F., 1998, A&A, 339, 19
- (25) Sodroski T. J., Bennett C., Boggess N., et al., 1994, ApJ, 428, 638
- (26) Tacconi L. J., Young J. S., 1986, ApJ, 308, 600
- (27) Tacconi L. J., Young J. S., 1990, ApJ, 352, 595
- (28) Trewhella M., 1998. PhD thesis, University of Wales Cardiff
- (29) Tully R. B., 1988. Nearby galaxies catalog. Cambridge University Press, Cambridge
- (30) Whittet D. C. B., 1992. Dust in the Galactic Environment. Institute of Physics Publishing, Bristol