Testing the Surface Brightness Fluctuations Method for Dwarf Elliptical Galaxies in the Centaurus A Group
Abstract
We have obtained deep and -band CCD photometry for five dwarf elliptical galaxies that were previously identified on Schmidt films covering the region of the Centaurus A (Cen A) group. From a Fourier analysis of the -band CCD images we determined the surface brightness fluctuation (SBF) magnitude for each stellar system. All magnitudes are similar and, given the small colour spread, suggest that these low surface brightness galaxies lie approximately at the same distance, regardless of the assumed SBF zero point. Long-slit spectra have been acquired to derive redshifts for two of the dwarfs, ESO269-066 and ESO384-016. The velocities, km s-1 and km s-1 , respectively, identify them unambiguously as Cen A group members. An age (H) – metallicity (C4668) analysis of the spectra reveals an underlying old and metal-poor stellar population in both cases. Combining photometric and spectroscopic results we find strong evidence that indeed all dwarf galaxies are Cen A group members.
Based on Cepheid, TRGB, and PNLF distances published for the two main Cen A group galaxies NGC5128 and NGC5253, we adopted a mean group distance of 3.96 Mpc to calibrate the apparent fluctuation magnitudes. The resulting absolute SBF magnitudes of the dEs correlate with the dereddened colours as predicted by Worthey’s stellar synthesis models using the theoretical isochrones of Bertelli and collaborators. This good agreement allows a calibration of the SBF method for dwarf ellipticals in the colour range . However, two branches of stellar populations appear in the -colour plane, and care has to be taken to decide which branch applies to a given observed dwarf. For dwarfs with there is very little colour dependence (), in accord with our previous SBF analysis of faint, blue Sculptor group dEs. For red dwarfs, , the -colour relation is steep, and accurate colours are needed to achieve SBF distances with an uncertainty of only 10%. One of the dwarfs, ESO219-010, is located slightly behind the core of the Cen A group at 4.8 Mpc, while the remaining four recover the mean group distance of 3.96 Mpc that was put into the calibration. The depth of the group is only 0.5 Mpc which identifies the Cen A group as a spatially well isolated galaxy aggregate, in contrast to the nearby Sculptor group.
1 INTRODUCTION
Dwarf elliptical (dE) galaxies are the most numerous type of galaxies in the nearby universe. Their existence is tightly correlated with the effective galaxy density of the environment, i.e. dEs reside predominantly in cluster cores (Binggeli et al. 1985; Ferguson 1989; Ferguson & Sandage 1990; Jerjen & Dressler 1997) or accompany giant galaxies as satellites in the field (Binggeli, Tarenghi & Sandage 1990). This naturally renders dEs as ideal objects to estimate distances to all sorts of galaxy aggregates. However, little advantage could be taken of the dE clustering properties to date, mainly because accurate distance measurements to dEs still rely on the resolution of the galaxy light into stars, such as any method based on the colour-magnitude diagram (CMD, e.g. Smecker-Hane et al. 1994; Da Costa et al. 1996; Stetson 1997), or the tip of the red giant branch (TRGB, Harris et al. 1998; Grebel & Guhathakurta 1999). This requirement makes observations expensive, restricting the practicability essentially to local systems.
An alternative, very promising distance estimator for dEs is based on “surface brightness fluctuations” (SBF). The theoretical framework of the SBF method was introduced and discussed by Tonry & Schneider (1988). The idea is to quantify the pixel-to-pixel brightness variation on a CCD image of a gas-free stellar system due to the varying numbers of stars within each pixel. At a constant surface brightness (star density) this variation is then inversely proportional to the distance of the galaxy. In practice, one has to measure the so-called apparent fluctuation magnitude in the photometric passband . This quantity is the ratio of the second and first moments of the underlying stellar luminosity function. If sufficient information is known about the stellar content of a galaxy type, the absolute fluctuation magnitude can be predicted from stellar synthesis models or empirically determined from calibrators, thus yielding a distance modulus of the galaxy.
So far SBF applications concentrated on high-surface brightness giant ellipticals (Tonry, Ajhar & Luppino 1989, 1990; Tonry & Schechter 1990; Pahre & Mould 1994; Thomson et al. 1997; Tonry et al. 1997), bulges of spiral galaxies (Tonry 1991; Luppino & Tonry 1993), and globular clusters (Ajhar & Tonry 1994). The first attempt to obtain SBF distances for dwarf ellipticals was made by Bothun et al. (1991), followed only recently by our study of nearby dEs (Jerjen, Freeman, & Binggeli 1998, hereafter JFB98) located in the outskirts of the Local Group (LG). In the latter study, the -band SBF distances for five dEs in the Sculptor group were measured to an internal accuracy of 5–10%. The difficulty with the SBF method for dwarfs is the inherent difference in the stellar populations of giant and dwarf ellipticals, preventing the adoption of existing calibration values from previous work on giants. To bypass the lack of empirical results, we based the SBF distances on the zero point predictions of stellar synthesis models (Worthey 1994). As it turned out, the calibrating is fairly insensitive to the star formation history for these very faint and blue Sculptor dEs. The resulting distances showed that the dwarf galaxies closely follow the spatial distribution of the main Sculptor group galaxies, which are spread over a distance range between 1.7 Mpc and 4.4 Mpc.
However, this large line-of-sight extension of the Sculptor group is clearly not ideal for the empirical calibration of the SBF method. To improve this situation, we continue our SBF project here with a study of five dE galaxies identified in Centaurus A (Cen A) group region. There are two major advantages of working in the Cen A group rather than the Sculptor group. Firstly, the Cen A group is physically and spatially much better defined than the Sculptor group. The Sculptor aggregate is, in fact, an unbound and almost freely expanding “cloud” of galaxies (see JFB98), while Cen A is certainly a rich and well concentrated group with a small distance dispersion of the member galaxies. Secondly, the Cen A group’s mean distance is well established via Cepheids and tip of the red giant branch magnitudes measured for the two main group galaxies, NGC5128 (= Centaurus A) and NGC5253.
Owing to their greater mean distances, the Cen A group dwarf Es are also intrinsically brighter on average than the Sculptor dwarfs. Thus in this paper we also extend the calibration of the SBF method to brighter magnitudes. As it turns out, for brighter dEs the calibration is somewhat more difficult. Brighter dwarfs are on average also redder than faint ones, and for red objects, according to the stellar synthesis models, the calibrating depends rather strongly on the colour. Moreover, in a certain colour range the calibration is not unique. However, we show that by a proper treatment of the - colour relation(s) and with reliable colour data, accurate SBF distances can be derived also for brighter dEs.
The paper is organized as follows. In §2 we describe the observations and data reduction procedures. This includes the spectroscopy of two of the five sample dEs, for which radial velocities as well as ages and metallicities are derived. §3 is the SBF analysis resulting in the apparent fluctuation magnitudes of the galaxies. In §4 these fluctuation magnitudes are then calibrated by means of stellar synthesis models which are critically discussed in terms of the - colour dependence. Summary and conclusions are given in §5.
2 OBSERVATIONS AND DATA REDUCTION
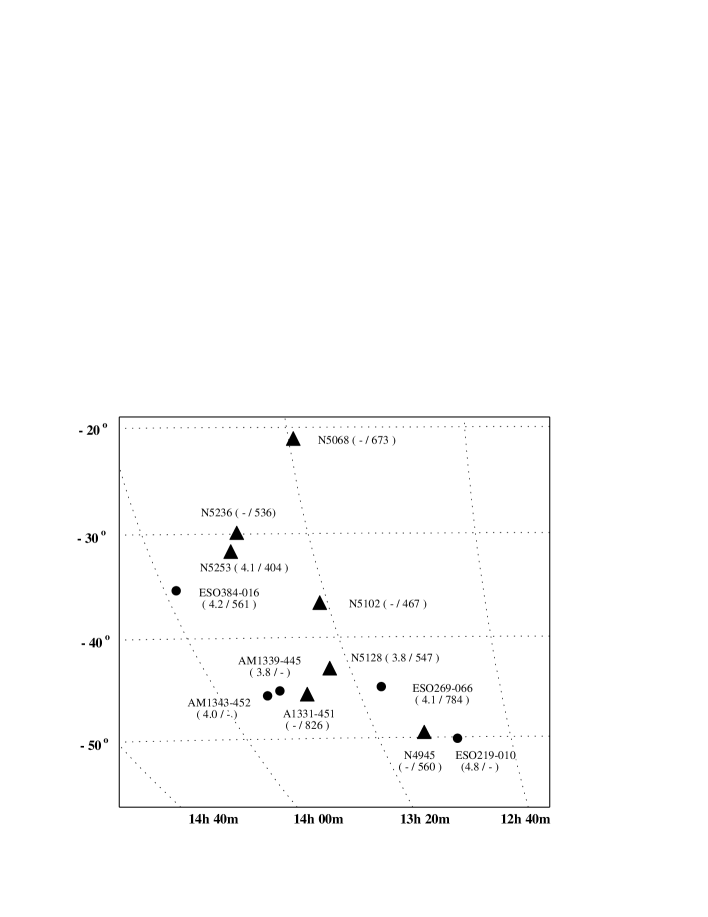
As reported elsewhere (Jerjen, Binggeli, & Freeman 2000, hereafter JBF00), 13 low surface brightness dwarf galaxies with dE morphology were identified in the region of the Cen A group. They have been detected as part of a visual inspection of fine-grain IIIa-J emulsion SRC Schmidt films covering the group’s area: . For the present SBF study we selected a subsample of five dEs. These galaxies have sufficiently large isophotal diameters providing enough independent measure points for the SBF analysis and their profiles are mostly unaffected by the disturbing light of bright nearby stars. In Figure 9 we show the distribution of the sample dEs on the sky.
2.1 Imaging
The photometric data for the five dwarf galaxies were taken with the 2.3m ANU telescope at Siding Spring Observatory in the dark time period 1997 April 9–11. The CCD camera was mounted at the Nasmyth focus B. On the first night the detector was a 2k1k EEV thick CCD with 22m pixels and a pixel scale of 0.55′′. On the remaining two nights we used a 2k800 SITe thinned CCD, AR coated, 15m pixels, and a pixel scale of 0.375′′. The CCD gain was set to 1 ADU-1 for all exposures. The field of view is mechanically restricted to a diameter circle.
All three nights were photometric and seeing ranged from 1.1 to 1.4′′ FWHM. A series of 4–5 -band images of 600–720 sec duration were taken for each galaxy yielding a total exposure time of 2400–3600 sec per object. Such long integration times are required to allow the SBF signal from a low-surface brightness galaxy to grow and surpass the high level of sky shot noise present in the power spectrum. This noise level continuously increases when working with redder photometric passbands and is rather high in and , the favourite filters for SBF studies on giant ellipticals. Even though the fluctuation signal also gets stronger this only partially compensates for the brighter sky, thus the Cousins -band appears to be the best compromise for the work on dwarf ellipticals. Furthermore, with -band images we avoid fringing effects which occur with thinned CCDs beyond 7000Å and which can severely affect the weak fluctuation signal.
The -band observations of a galaxy were supplemented with a series of 600sec band images to get colour information. Besides the science images we took high signal-to-noise twilight flats every dusk and dawn period and photometric standards in the E regions (Graham 1982) throughout the nights.
The CCD data were reduced with standard IRAF procedures. The bias was subtracted from all of the images, and we used the combined twilight flats to flatten the science images. On each frame we determined the sky level from 10–15 selected star-free regions well away from the galaxies. The rms scatter showed that all images were flat to % over the full frame. Each set of sky-subtracted images of a galaxy was registered and median combined to generate a composite image. The calibration of these master images was carried out with aperture photometry of the standard stars. Uncertainty in the photometric zero point was measured at 0.02 mag.
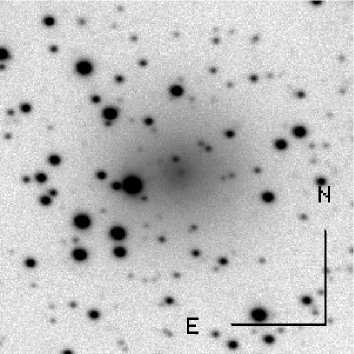
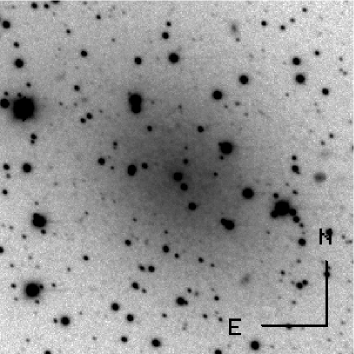
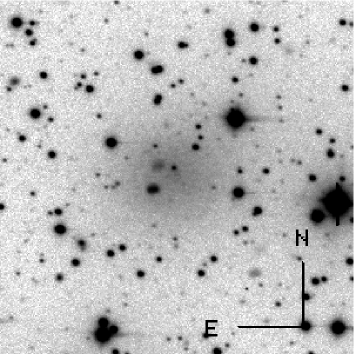
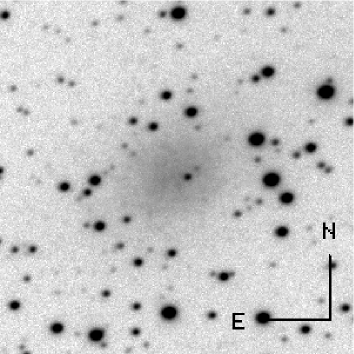
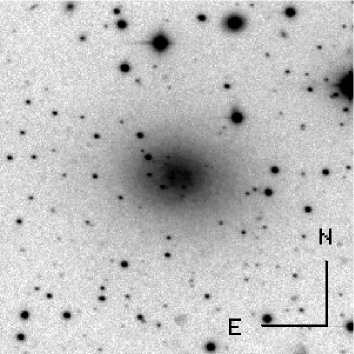
Figures 1 and 2 show the -band images of the five dEs. Among early-type dwarf galaxies there is some morphological variety (see Sandage & Binggeli 1984). At the bright end of the dE luminosity function, there is a variant that was named dS0, because it is often distinguished by a S0-like, two-component structure (see also Binggeli & Cameron 1991). ESO384-016 is clearly of this type, ESO269-066 arguably so. Bright dwarf ellipticals also host quite often an unresolved, centrally located star-like object, which is possibly a massive globular cluster formed in or fallen into the core region of the galaxy. ESO219-010 and ESO269-066 are the galaxies that show qualitative evidence for such a nucleus. However, a star projected onto the galaxy centre by chance cannot be ruled out in either case; thus a “:” goes with the classifications.
In Table 1 we list the fundamental parameters of the dwarf galaxies: the morphological type (col. [2]), coordinates (cols.[3-4]), the total and magnitudes (cols. [5-6]), the effective radius containing half of the total light (col. [7]), and the mean effective surface brightness (col. [8]). A full account of the observations including a discussion of the radial surface brightness profiles, colour gradients, and structure parameters of the galaxies is given in JBF00. The dereddened overall colours (col. [10]) were derived from cols.[5-6] and corrected for foreground extinction using the IRAS/DIRBE maps of dust IR emission (Schlegel et al. 1998) and the ratio . According to these authors the extinction estimates (col. [9]) have an accuracy of %. The observed colour range (col. [10]) covered by our Cen A group candidates is redder than for the Sculptor dEs (JFB98) and again is typical for dEs whose values range from 0.5 to 2.3 (Evans et al. 1990).
2.2 Spectroscopy
The two sample galaxies with the highest surface brightness were selected for a spectroscopic follow-up to estimate their ages and metal abundances and to measure their redshifts. We obtained two spectra of ESO269-066, on April 19, 1996 and two spectra of ESO384-016 on February 2, 1997, at the Nasmyth A focus of the 2.3m ANU telescope using a 600 line grating at the blue side of the double-beam spectrograph. Each exposure was of 2000 sec duration. The detector was a SITe 1752532 thinned CCD with an across dispersion of pixel-1 and a spectral resolution of 1.1Å pixel-1. The grating angle was set to cover the wavelength range ÅÅ. We acquired the data using a long slit () under good seeing conditions. The slit was positioned at the galaxy centre and aligned along the major axis.
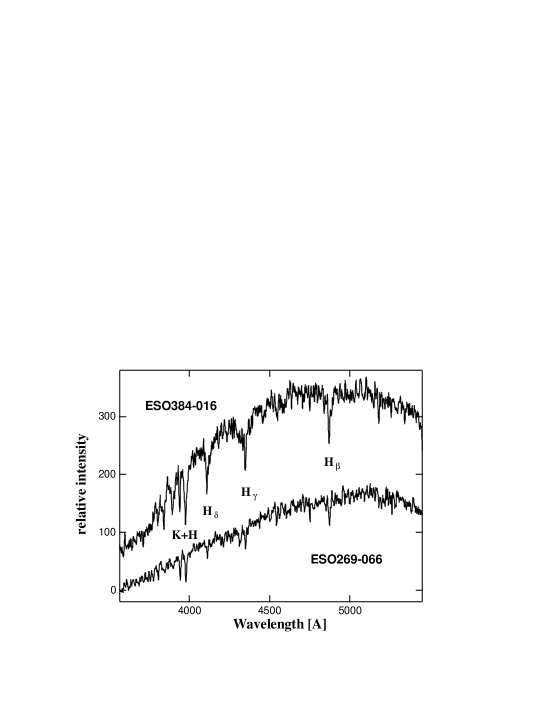
We reduced the CCD data in a straightforward manner with standard IRAF procedures. After the bias level was removed, each image was flatfielded and sky line subtracted. Wavelength calibration was performed using emission line spectra of a Ne-Ar lamp observed immediately after each galaxy spectrum. The combined galaxy spectra are plotted in Figure 3. Both dwarfs are pure absorption line systems with prominent Balmer lines (Hβ , Hγ , Hδ ) and a Ca II H and K doublet (, ). All lines are slightly stronger in the spectrum of ESO384-016.
The age and metallicity of the dwarf galaxies were estimated (L. A. Jones 1999, private communication) by comparing the observed index strengths of the lines C4668 (Worthey 1994) and H at (Jones & Worthey 1995) with the index strengths computed from single-burst population models. The C4668 line is a blend from C2, Mg, Fe, and other elements and is considered as a very good metallicity indicator with a 2–3 times better orthogonal separation of age and metallicity than the most commonly used Mg2 index (Jones & Worthey 1995). On the other hand, H is relatively metallicity-insensitive, thus useful in determining age. Furthermore, H is less affected by emission from ionised hydrogen than for instance H and less diluted by light from giant stars.
In Figure 4 we show the location of the dwarf elliptical galaxies in the H versus C24668 (age–metallicity) diagram. Both galaxies appear in the old, metal-poor part of the diagram where crowding in the parameter space leads to poor resolution. ESO384-016 seems to be slightly more metal-rich and younger relative to ESO269-066. However, a quantification is impossible due to large uncertainties. Also, it has to be borne in mind that the assumed single-burst model need not be correct.
To determine the redshifts of the dwarfs, their spectra were continuum-subtracted and cross-correlated with the spectrum of the velocity standard HD176047, a K1III giant. A heliocentric velocity of v km s-1 was measured for ESO384-016, which is in good agreement with velocities observed for well-known Cen A group galaxies such as NGC5128 (v⊙=562 km s-1 ) or NGC5236 (v⊙=516 km s-1 ). For ESO269-066 we measured v⊙=784(31) which lies at the high end of the velocity distribution of the Cen A group. The most complete catalogues of Cen A group galaxies (Côté et al. 1997, hereafter C97; Banks et al. 1999) list three galaxies with comparable velocities: SGC1259.6-1659 (v⊙=732 km s-1 ), DDO161 (v⊙=747 km s-1 ), and AM1331-451 (v⊙=831 km s-1 ). A fourth galaxy, AM1318-444 ( , J2000.0) with v⊙=741 km s-1 , was reported just recently (JBF00). Assuming D=4 Mpc, the small distance and velocity differences between ESO269-066 and AM1331-451 ( kpc, v=47 km s-1 ) or AM1318-444 ( kpc, v= km s-1 ) may indicate a small subclump within the group (see Figure 9).
Overall, the observed redshifts provide clear evidence that ESO269-066 and ESO384-016 are indeed Cen A group members. This picture is further qualitatively supported by the facts that (i) the Cen A group is well isolated in velocity space (Tully & Fisher 1987; C97) i.e. has no overlap in velocity space with a nearby background galaxy aggregate, and that (ii) dwarf ellipticals found in low density regions are almost exclusively close companions of massive galaxies (Binggeli, Tarenghi & Sandage 1990; Ferguson & Binggeli 1994; JFB98). A quantitative confirmation of these kinematic distance estimates is of course provided by the following SBF analysis.
3 SBF ANALYSIS
The deep -band CCD master images of our galaxies were prepared according to the procedure described in TS88 and JFB98. Point sources were identified with the DAOPHOT routines (Stetson 1987) and the affected CCD areas were replaced by nearby uncontaminated patches of the galaxy from the same surface brightness range. The isophotes of the cleaned galaxy were modelled with the ISOPHOT package within STSDAS by fitting ellipses with variable radius, ellipticity, and position angle. The mean galaxy brightness distribution was subtracted from the master image. The residual image was then divided by the square root of the mean profile to produce the fluctuation image. This last step normalizes the strength of the pixel-to-pixel variation over the galaxy’s surface due to differences in surface brightness (stellar density).
On each fluctuation image, two subimages (F1 and F2) were selected within the 25.5 mag arcsec-2 isophote of the galaxy for the SBF analysis. The only exception was ESO219-010 where superimposed foreground stars and the relative small size of the galaxy allowed us to work with only one subimage. The size of a subframe was between and pixels. Under the given seeing conditions this area corresponds to 900–4000 independent points carrying the SBF fluctuation signal. The overlap of subimages was kept minimal (%) to get two independent distance measurements for a galaxy. Objects previously identified with DAOPHOT on a subimage were replaced by a randomly selected area from the region outside of the subimage but in the same isophotal range. The fraction of pixels patched in this way was less than 5% of the total subimage area. All cleaned fluctuation images were Fourier-transformed and the azimuthally averaged power spectrum calculated (Figures 5 and 6). From well isolated bright stars on the master images we derived the power spectrum of the PSF. We then fitted a linear combination of the power spectrum of the PSF and a constant to the the galaxy power spectrum,
| (1) |
Low spatial frequencies () which can be affected by the galaxy subtraction were excluded from the fit. The results are listed in Table 2. From the amplitude (col. [7]) we calculated the apparent fluctuation magnitude (col. [9]) with the formula . Thereby, the quantity (col. [2]) is the magnitude of a star yielding 1 ADU per second on the CCD and (col. [3]) is the integration time of a single exposure. (col. [8]) is the scale-free (white-noise) component in the power spectrum which is proportional to the ratio of the sky (col. [6]) and the galaxy surface brightness (col. [5]) averaged over the subimage. To keep the white-noise level low it is thus crucial to restrict the SBF analysis to the high-surface brightness parts of the galaxy. The combination of exposures reduced the white-noise level by a factor of .
The overall error of the apparent fluctuation magnitude is dominated by the power spectrum fitting error which contributes 3–10%. Applying the SBF method to subimages of relatively high surface brightness (, col. [5]) helped to keep the error which is due to the uncertainty in the sky determination (col. [6]) small, i.e. 3% or less. Errors from PSF normalisation and the shape variation of the stellar PSF over the CCD area are equally small (1–3%). In Column 7 of Table 2 we list the values with the combined error from all these sources. Assuming a photometric accuracy of mag (col. [2]) and adopting a 16% error for foreground extinction (Schlegel et al. 1997), the formal internal uncertainty in is between 0.05 to 0.14 mag (col. [11]). We like to stress that the two narrow but distinct magnitude ranges covered by are due to the use of two different CCD detectors with different zero points (see section 2.1).
4 CALIBRATION OF FLUCTUATION MAGNITUDES AND DISTANCES
4.1 Theoretical stellar populations
First let us recall that most faint dEs are not single-burst populations like globular clusters (Da Costa 1997). A rather diverse and complex set of star formation histories (SFH) is observed among the local dwarf spheroidals. Their stellar populations range from old (Ursa Minor) and mainly old (e.g. Tucana, Leo II) through intermediate-age episodic SFH (e.g. Carina, Leo I) to intermediate-age continuous SFH (e.g. Fornax). Phoenix and LSG3 are classified as dE/Im, because they show similarities to both dwarf spheroidals and dwarf irregulars. These systems are dominated by an old metal-poor population with no evidence for major star formation activities after the initial episode 8-10 Gyr ago. However, both systems have a minor population of young stars, with ages of about 150 Myr, which makes these galaxies resemble dwarf irregulars.
To explore the age- and metallicity-dependency of for dE-like stellar populations we employed Worthey’s on-line model interpolation engine 111http://199.120.161.183:80/worthey/dial/dial_a_model.html. We considered separately the two offered sets of isochrones: (1) the amalgamation of the stellar evolutionary isochrones of VandenBerg and collaborators and the Revised Yale Isochrones (Green et al. 1987; hereafter RYI) as described in Worthey (1994), and (2) the Padova isochrone library (Bertelli et al. 1994; hereafter PI).
We computed and values for the following 2-component stellar populations. The age of the main population was set to 17, 12, or 8 Gyr and its metallicity set in the range 222The model limits for the Bertelli isochrones are for 17 Gyr and for 12 and 8 Gyrs, , …,, , , . The second population, 5 Gyr old and of solar metallicity, contributed in weight to the whole population at the 0 ( pure case), 10, 20 or 30% level. In all cases we assumed a Salpeter IMF. The results of the models are illustrated in Figure 7 where we have plotted versus . The models are separated according to the underlying isochrone library. In each case, two distinct branches are visible. However, only one branch is well defined, while the other, though recognisable, is only sparsely populated. We will call the steep linear and shallow quadratic component the red and blue branch, respectively, for reasons given below.
In order to understand the significant differences between the predictions of the two sets of isochrones for one has to recall that corresponds to the luminosity-weighted luminosity of the underlying stellar population. This quantity is roughly the luminosity of a giant star, thus critically depends on the post red giant branch (RGB) evolution. While the theoretical isochrones of Bertelli et al. (1994) are the most complete set available with a full RGB evolution implemented, this part of the stellar evolution is missing in the RYI. Worthey assumed in his RYI-based models the horizontal branch to remain in a red clump near the giant branch, which is incorrect for metal-poor populations. Because of these limitations we will focus in the following on the results of the PI based models.
A few words on the interpretation of the PI colour-fluctuation magnitude diagram. Da Costa (1997) pointed out that (i) the colour of the red giant branch is largely independent of age, but is strongly dependent on metallicity (his Figure 1) and (ii) that for a fixed metallicity the colour of the horizontal branch has a discontinuity from blue for the oldest populations ( Gyr) to red at younger ages ( Gyr, his Figure 4). The latter effect is more marked for lower metallicities. These two trends describe very accurately the behaviour of above and below (or [Fe/H]) as we illustrate in Figure 8. In the models, only the very old (17 Gyr) and metal-poor ([Fe/H]) populations are located on the blue branch. With an increasing fraction of younger stars the total population gets redder and the model values reach quickly the red branch.
To quantify the location of the two branches, we deduced two analytical expressions for the locus of theoretical values by least-squares fitting to the model data: for the red, and for the blue branch, respectively.
4.2 Observed stellar populations
The observed magnitudes (col. [11], Table 2) occupy a small range with mag which, given the small colour range, implies roughly the same distance for our sample galaxies independently from any assumption on the zero point of the SBF distance estimator. Furthermore, we found quantitative evidence in §2.2 that two of the dEs are Cen A group members according to their redshifts. This immediately suggests that indeed all sample dEs are Cen A group galaxies. Based on this assumption we can investigate the empirical calibration of the SBF method for dEs.
In Table 4 we compiled accurate distances of two main Cen A group galaxies from the literature. Three distances are published for NGC5128: Harris et al. (1999) measured Mpc based on the tip of the red giant branch (TRGB) magnitude. A distance from the planetary nebulae luminosity function (PNLF) of Mpc was given by Hui et al. (1993), and Mpc was obtained by Tonry & Schechter (1990) with the SBF method for giant ellipticals. The two latter values have been adjusted to the presently favoured LG distance scale set by (M31) = 24.5 (van den Bergh 1995; Fernley et al. 1998; Harris 1999). A mean value of Mpc [(m–M)=] is taken as the true distance of NGC5128. The second galaxy is NGC5253. Saha et al. (1995) reported a distance modulus of (m–M) derived from Cepheids. NGC5128 and NGC5253 are the only Cen A group galaxies with accurate distances to date, which makes the estimation of the group distance difficult in principal. However, their redshifts (col. [2], Table 4) are close to the mean group velocity at v⊙=551 km s-1 (C97) and we adopt their average distance modulus (m–M), or = 3.96 Mpc, for the whole Cen A group.
We note that more distance determinations are available for these two galaxies (e.g. Della Valle & Melnick 1992; Shopbell, Bland-Hawthorn & Malin 1993; Soria et al. 1996) as well as for other group members (e.g. De Vaucouleurs 1979). However, these results have been superseded by newer data, or are less secure.
Using the independent Cen A group distance we converted the fluctuation magnitude of each SBF field (col. [4], Table 3) into an absolute magnitude. The results are shown in Figure 7 whereby the colour (col. [3], Table 3) was determined for each SBF field individually because integrated colours as listed in col. [10] of Table 1 are not reliable due to observed colour gradients (see JBF00). The estimated error in the local is composed of the sky uncertainty in the and -band images, the photometric error, and an extinction error of 16% (Schlegel et al. 1998).
4.3 Theory vs. observations and the final calibration
A comparison between observations and theoretical models based on PI (Figure 7, right panel) reveals a remarkable agreement. All dEs (except ESO219-010 which will be discussed separately below) are close to the locus of theoretical values. Each branch exhibited by the models is populated with the data of at least one sample galaxy. This confirms the previous assumption that the dEs are Cen A group members, and that the value of the adopted Cen A group distance modulus of 27.99 is approximately correct for the dwarfs. It is important to note that the assignment of an individual galaxy to one of the two model branches may be less problematic than it first appears. As we have data for two (ideally more) SBF fields per galaxy with a significant colour difference, we can decide on the basis of colour slope. For instance, between the two fields of ESO384-016, we measured mag and mag. This clearly indicates that ESO384-016 belongs on the blue branch. Due to smaller differences in colour the situation for ESO269-066, AM1339-445, and AM1343-452 is less clear. One could argue for each of them that it is actually a member of the blue branch and that the offset from the model values reflects the relative distance from the assumed group centre. However, this explanation appears highly unlikely as all three galaxies would by chance have to fall at the right place on the red branch.
We prefer to interpret the results in Figure 7 right panel as a convincing demonstration how well theoretical models of mainly old, metal-poor stellar populations can predict the colour dependence of . The systematic offset between the dE data and the analytical expressions that describe the two branches (see above) is mag with a scatter of mag. This scatter accounts for genuine differences between models and observations as well as for the depth effect among the four dEs. Taking into account the zero point from the empirical data and the shape of the relation from the models we can formulate a semi-empirical calibration of the SBF method as distance indicator for dEs:
| (2) |
for the red, steeply rising branch in the colour range , and
| (3) |
for the blue branch in the range . The decision which of the formulas is appropriate for a galaxy remains subject to the observed trend of as a function of colour.
We note that for fairly blue old galaxies, say with , there is almost no colour dependence of . For = 1.0 and 0.8, equation (3) gives = and , respectively. This is in accord with adopted in our previous paper (JFB98) for the blueish Sculptor group dwarf spheroidals.
4.4 Resulting distances
We are now in a position to derive individual distances for the dwarfs. First, by using formulas (2) and (3) we have calculated the calibration constant for each SBF field, as listed in col. [6] of Table 3. In col. [5] of that table we also give the “observed” based on = 27.99, as plotted in Figure 7. The errors in the calibrating are simply the propagated colour errors given in col. [3] of Table 3. ESO219-010 and 384-016 have been assigned to the blue branch (equation 3); the three other dwarfs to the main, red branch (equation 2). The errors in are accordingly much smaller for the former than the latter, as the red branch is quite steep. Assuming no error in the models and in the assignment to them, we now take any difference between (obs) and (calib) as a real difference in the distance between the object and the adopted mean group distance of = 27.99. The individual distance moduli for the dwarf fields, listed in col. [7] of Table 3, follow then simply by combining (col. [4]) and (calib) (col. [6]). Finally, the corresponding distances for the fields are averaged for each galaxy (where two fields are available), giving the error-weighted mean distances in Mpc listed in col. [8] of Table 3. The distance errors vary between 3 and 9% for the two blue branch dwarfs, and 13 to 19% for the three red branch dwarfs.
The distance of ESO219-010, of 4.79 Mpc, is significantly larger than the distances of the remaining four dwarfs (if assigned to the red branch in Figure 7, the distance would even be 7.3 Mpc). While its Cen A group membership is not questioned, this galaxy is likely lying outside the core region of the group, and it should be excluded for a calculation of the mean group distance. The four remaing dEs have a mean distance of 4.00 Mpc (mM = 28.01), which by chance exactly coincides with the pre-assumed group distance inferred from the well-determined distances of NGC 5128 and NGC 5253. The small 1 distance dispersion of 0.20 Mpc [or = 0.10 mag] is not only a confirmation of the previous assumption that the Cen A group is well defined and concentrated, but again shows that the SBF method for dwarf ellipticals works quite well in this case.
In Figure 9 we show the sky distribution of the Cen A group main members and the positions of the five dEs. We note that ESO219-010 lies near the edge of this distribution, again suggesting that this is an outer member of the group. It is tempting to associate ESO384-016 with the galaxy pair NGC5253/5236, and to see ESO269-066 as a companion of AM1331-451. However, more distance and velocity information for the remaing galaxies is needed to unambiguously identify any subclumps, if present, in the Cen A group.
5 SUMMARY AND CONCLUSIONS
This is the second study on the surface brightness fluctuation method as useful distance indicator for low surface brightness dwarf elliptical galaxies. In a first paper (JFB98) we have applied the SBF method to dwarf spheroidal members of the nearby Sculptor group. The Sculptor dwarfs (with one exception) are very faint () and blue []. As with LG dwarf spheroidals (da Costa et al. 1996), many of them show signs of recent star formation. This forced us to look, by means of stellar synthesis models provided by Worthey (1994), for any variation of the calibrating with age and metallicity of the underlying stellar population. Very fortunately, for the faint, blue, and metal-poor Sculptor dwarfs this variation turned out to be minimal, and a preliminary calibration constant of was adopted.
The present paper was intended to improve the SBF calibration and to extend it to brighter magnitudes. We have carried out and CCD photometry of five dE galaxies, AM1339-445, AM1343-452, ESO219-010, ESO269-066, and ESO384-016, suspected members of the Centaurus A group. The SBF analysis of their -band images revealed similar fluctuation magnitudes suggesting the same approximate distance to the Local Group (given their similar colour). The missing link for their association to the Cen A group is provided by the spectroscopic redshifts we measured for ESO269-066 and ESO384-016. Both dwarfs have heliocentric velocities in good agreement with velocities found for main Cen A group members.
For the calibration of the measured apparent fluctuation magnitudes we employed a mean distance modulus for the Cen A group of 3.96 Mpc ( = 27.99 mag) based on reliable (Cepheid, TRGB, PNLF) distances to NGC5128 and NGC5253. Again we had to study the dependence of the resulting absolute fluctuation magnitudes on age and metallicity, i.e. in practice on the colour of the underlying stellar population, by drawing on the on-line tool provided by Worthey (see footnote 1).
Here now comes the difference from the Sculptor dwarfs in our first paper. The Cen A group dwarfs are more distant and hence on average brighter than the Sculptor dwarfs. As a result, owing to a general colour-luminosity relation (e.g., Ferguson 1994, Secker et al. 1997), the Cen A dEs are also significantly redder, lying in the colour range . For these red colours the stellar population synthesis models show a strong dependence of on . Moreover, two branches are populated by the models in the -colour plane. One branch is more populated by models based on Revised Yale Isochrones, the other by models based on Padova Isochrones (Bertelli et al. 1994). We have argued that the Revised Yale Isochrones are unreliable for the purpose of predicting magnitudes for old, metal-poor, and sufficiently red stellar populations due to the lack of a full post red giant evolution. That the present dEs are dominated by old, metal-poor stars is indeed confirmed by the absorption line spectra of ESO269-066 and ESO384-016.
Aside from theoretical considerations, it was found that the fluctuation magnitudes, when forced to a mean distance of 3.96 Mpc, are surprisingly well matched by the model curves. An exception is ESO219-010 which seems to be slightly more distant than the core of the Cen A group. We also found that the assignment of a particular galaxy to one of the two branches is fairly unambigous, especially if more than one subfield per galaxy is analysed. In this way, by assuming that the scatter around the model curves, given by equations (2) and (3) is entirely due to a dispersion in the individual distances (depth effect), we achieved SBF distances with an accuray of 3 to 9% for the two dwarfs belonging to the “blue” branch, and 13 to 19% for the three dwarfs belonging to the “red” branch. The distance dispersion of the dwarfs (again excepting ESO219-010) is quite small, with a depth of ca. 0.5 Mpc, confirming the isolation and compactness of the Cen A group.
As regards the application of the SBF method to dEs in general, the situation for red dwarfs [] is certainly much less favourable than for blue ones. As future applications will tend to reach greater distances, the objects will be brighter and hence redder. The slope of the -colour relation in the -band is very steep (the slope is 6.09, see equation 2), such that accurate colours are prerequisite for a proper SBF analysis. In different photometric bands the -colour relation is somewhat less, but still considerably steep (e.g. in and , see Tonry et al. 1997). Given the easy access and convenience of optical -band imaging and the avoidance of fringing problems (as compared to the -band) it is probably no great gain to change the photometric band. As we have shown in this paper, by working with several subfields per galaxy it should be feasible to achieve accurate SBF distances in the -band (with an error of less than, or of the order of 10%) also for bright and red dwarf ellipticals.
References
- (1)
- (2) Ajhar E.A. & Tonry, J.L. 1994, ApJ, 429, 557
- (3)
- (4) Banks, G., et al. 1999, ApJ, 524, 612
- (5)
- (6) Bertelli, G., Bressan, A., Chiosi, C., Fagotto, F.. & Nasi, E. 1994, A&AS, 106, 275
- (7)
- (8) Binggeli, B., & Cameron, L.M. 1991, A&A, 252, 27
- (9)
- (10) Binggeli, B., Sandage, A., & Tammann, G.A. 1985, AJ, 90, 1681
- (11)
- (12) Binggeli, B., Tarenghi, M., & Sandage, A. 1990, A&A, 228, 42
- (13)
- (14) Bothun, G.D., Impey, C.D., & Malin, D.F. 1991, ApJ, 376, 404
- (15)
- (16) Côté, S., Freeman, K.C., Carignan, C., & Quinn, P.J. 1997, AJ, 114, 1313 (C97)
- (17)
- (18) Da Costa, G.S., 1997, in ASP Conf. Ser.116, The Second Stromlo Symposium: The Nature of Elliptical Galaxies, ed. M. Arnaboldi, G.S. Da Costa, P. Saha, (San Francisco: ASP), 270
- (19)
- (20) Da Costa, G.S., Armandroff, T.E., Caldwell, N., & Seitzer, P. 1996, AJ, 112, 2576
- (21)
- (22) Della Valle, M., & Melnick, J. 1992, A&A, 257, 1
- (23)
- (24) de Vaucouleurs, G. 1979, ApJ, 227, 380
- (25)
- (26) Evans, Rh., Davies, J.I. & Phillipps, S. 1990, MNRAS, 245, 164
- (27)
- (28) Ferguson, H.C. 1989, AJ, 98, 367
- (29)
- (30) Ferguson, H.C. 1994, in Dwarf Galaxies, ESO/OHP Conference, ed. Ph. Prugniel & G. Meylan, ESO Publications, Garching, p.475
- (31)
- (32) Ferguson, H.C., & Binggeli, B. 1994, Astron. Astrophys. Rev., 6, 67
- (33)
- (34) Ferguson, H.C., & Sandage, .A 1990, AJ, 100, 1
- (35)
- (36) Fernley, J., Barnes, T.G., Skillen, I., Hawley, S.L., Hanley, C.J., Evans, D.W., Solano, E., & Garrido, R. 1998, A&A, 330, 515
- (37)
- (38) Graham, J.A. 1982, PASP, 94, 244
- (39)
- (40) Grebel, E.K., & Guhathakurta, P. 1999, ApJ, 511, L101
- (41)
- (42) Green, E.M., Demarque, P., & King, C.R. 1987, The Revised Yale Isochrones and Luminosity Functions (New Haven: Yale University Observatory)
- (43)
- (44) Harris, W. E. 1999, in Star Clusters, ed. L. Labhardt & B. Binggeli (28th Saas-Fee Advanced Course) (Berlin: Springer), in press
- (45)
- (46) Harris, G.L.H., Harris, W.E., & Poole, G.E. 1999, AJ, 117, 855
- (47)
- (48) Harris, W.E., Durrell, P.R., Pierce, M.J., & Secker, J. 1998, Nature, 395, 45
- (49)
- (50) Hui, X, Ford H.C., Ciardullo R., & Jacoby G.H. 1993, ApJ, 414, 463
- (51)
- (52) Jerjen, H., & Dressler, A. 1997, A&AS, 124, 1
- (53)
- (54) Jerjen, H., Freeman, K.C., & Binggeli, B. 1998, AJ, 116, 2873 (JFB98)
- (55)
- (56) Jerjen, H., Binggeli B., & Freeman K.C. 2000, AJ, February issue (JBF00)
- (57)
- (58) Jones, L.A., & Worthey, G. 1995, ApJ, 446, L31
- (59)
- (60) Luppino, G.A., & Tonry, J.L. 1993, ApJ, 410, 81
- (61)
- (62) Pahre, M., & Mould, J.R. 1994, ApJ, 433, 567
- (63)
- (64) Sandage, A., & Binggeli, B. 1984, AJ, 89, 919
- (65)
- (66) Saha, A., Sandage, A., Labhardt, L., Schwengeler, H., Tammann, G.A., Panagia, N., & Macchetto, F.D. 1995, ApJ, 438, 8
- (67)
- (68) Schlegel, D., Finkbeiner, D., & Davis, M. ApJ, 1998, ApJ, 500, 525
- (69)
- (70) Secker, J., Harris, W.E., Plummer, J.D. 1997, PASP, 109, 1377
- (71)
- (72) Shopbell, P.L., Bland-Hawthorn, J., & Malin, D.F. 1993, AJ, 106, 1344
- (73)
- (74) Smecker-Hane, T.A., Stetson P.B., Hesser J.E., & Lehnert, M.D. 1994, AJ, 108, 507
- (75)
- (76) Soria, R., et al. 1996, ApJ, 465, 79
- (77)
- (78) Stetson, P.B. 1987, PASP, 99, 191
- (79)
- (80) Stetson, P.B. 1997, Baltic Astron., 6, 3
- (81)
- (82) Thomson, B., Baum, W.A., Hammergren, M., & Worthey, G. 1997, ApJ, 483, L37
- (83)
- (84) Tonry, J.L. 1991, ApJ, 373, L1
- (85)
- (86) Tonry, J.L., & Schechter, P.L. 1990, AJ, 100, 1794
- (87)
- (88) Tonry, J.L., & Schneider, D.P. 1988, AJ, 96, 807
- (89)
- (90) Tonry, J.L., Ajhar, E.A, & Luppino, G.A. 1989, ApJ, 346, L57
- (91)
- (92) Tonry, J.L., Ajhar, E.A, & Luppino, G.A. 1990, AJ, 100, 1416
- (93)
- (94) Tonry, J.L., Blakeslee, J.P., Ajhar, E.A., & Dressler, A. 1997, ApJ, 475, 399
- (95)
- (96) Tully, R.B., & Fisher, J.R. 1987, Nearby Galaxy Atlas (Cambridge: Cambridge Univ. Press)
- (97)
- (98) van den Bergh, S. 1995, ApJ, 446, 39
- (99)
- (100) Worthey, G. 1994, ApJS, 95, 107
- (101)


| R.A. | Decl. | AB | |||||||
|---|---|---|---|---|---|---|---|---|---|
| Name | Type | (J2000.0) | (J2000.0) | (mag) | (mag) | (arcsec) | (mag arcsec-2) | (mag) | (mag) |
| (1) | (2) | (3) | (4) | (5) | (6) | (7) | (8) | (9) | (10) |
| ESO219-010 | dE,N | 12h56m09.6s | 50d08m38s | 16.42 | 14.73 | 17.4 | 22.92 | 0.96 | 1.32 |
| ESO269-066 | dE,N: | 13h13m09.5s | 44d52m56s | 14.59 | 12.96 | 39.7 | 22.95 | 0.40 | 1.48 |
| AM1339-445 | dE | 13h42m05.8s | 45d12m21s | 16.32 | 14.76 | 23.8 | 23.63 | 0.48 | 1.38 |
| AM1343-452 | dE | 13h46m17.8s | 45d41m05s | 17.57 | 16.02 | 14.7 | 23.85 | 0.52 | 1.35 |
| ESO384-016 | dS0/Im | 13h57m01.2s | 35d19m59s | 15.11 | 13.90 | 19.2 | 22.31 | 0.32 | 1.09 |
| Exp. Time | FWHM | AA | ||||||||
|---|---|---|---|---|---|---|---|---|---|---|
| Name | (mag) | (s) | (arcsec) | (ADU) | (ADU) | (ADU) | (ADU) | (mag) | (mag) | (mag) |
| (1) | (2) | (3) | (4) | (5) | (6) | (7) | (8) | (9) | (10) | (11) |
| ESO219-010 | 24.58 | 5 600 | 1.4 | 242 | 2572(3) | 26.3(2.7) | 4.5(0.05) | 27.98(0.10) | 0.59(0.09) | 27.39(0.14) |
| ESO269-066 F1 | 24.56 | 5 600 | 1.3 | 473 | 2120(2) | 59.4(3.3) | 1.8(0.08) | 27.07(0.06) | 0.25(0.04) | 26.82(0.07) |
| F2 | 447 | 56.9(3.8) | 2.0(0.08) | 27.11(0.07) | 26.86(0.08) | |||||
| AM1339-445 F1 | 24.03 | 4 600 | 1.2 | 223 | 3566(7) | 39.4(2.4) | 7.9(0.10) | 26.99(0.06) | 0.30(0.05) | 26.69(0.08) |
| F2 | 204 | 45.4(2.9) | 7.8(0.14) | 26.83(0.07) | 26.53(0.09) | |||||
| AM1343-452 F1 | 24.58 | 5 720 | 1.4 | 162 | 2896(4) | 60.2(5.0) | 6.8(0.13) | 27.27(0.09) | 0.32(0.05) | 26.95(0.10) |
| F2 | 226 | 57.6(3.3) | 4.3(0.09) | 27.32(0.06) | 27.00(0.08) | |||||
| ESO384-016 F1 | 24.03 | 5 600 | 1.1 | 428 | 3290(6) | 31.5(1.0) | 4.9(0.07) | 27.23(0.04) | 0.20(0.03) | 27.03(0.05) |
| F2 | 205 | 29.4(1.2) | 6.2(0.08) | 27.31(0.05) | 27.11(0.06) |
| (obs) | (calib) | (m-M)0 | D | ||||
|---|---|---|---|---|---|---|---|
| Name | Field | (mag) | (mag) | (mag) | (mag) | (mag) | (Mpc) |
| (1) | (2) | (3) | (4) | (5) | (6) | (7) | (8) |
| ESO219-010 | F1 | 1.13(0.08) | 27.39(0.14) | 0.60 | 1.01(0.11) | 28.40(0.18) | 4.79(0.43) |
| F1 | 1.24(0.06) | 26.82(0.07) | 1.17 | 1.26(0.36) | 28.08(0.37) | ||
| ESO269-066 | F2 | 1.26(0.06) | 26.86(0.08) | 1.13 | 1.14(0.36) | 28.00(0.37) | 4.05(0.53) |
| F1 | 1.28(0.06) | 26.69(0.08) | 1.30 | 1.01(0.36) | 27.70(0.37) | ||
| AM1339-445 | F2 | 1.19(0.06) | 26.53(0.09) | 1.46 | 1.56(0.36) | 28.09(0.37) | 3.75(0.49) |
| F1 | 1.31(0.12) | 26.95(0.10) | 1.04 | 0.83(0.73) | 27.78(0.74) | ||
| AM1343-452 | F2 | 1.27(0.07) | 27.00(0.08) | 0.99 | 1.08(0.42) | 28.08(0.43) | 3.97(0.74) |
| F1 | 1.01(0.04) | 27.03(0.05) | 0.96 | 1.15(0.04) | 28.18(0.06) | ||
| ESO384-016 | F2 | 1.21(0.05) | 27.11(0.06) | 0.88 | 0.89(0.08) | 28.00(0.10) | 4.23(0.11) |
| (m-M)0 | ||||
|---|---|---|---|---|
| Name | (km s-1) | (mag) | EstimatoraaTRGB: Tip of the Red Giant Branch magnitude, PNLF: Planetary Nebulae Luminosity Function, SBF: Surface Brightness Fluctuations. | ref |
| (1) | (2) | (3) | (4) | (5) |
| NGC5128 | 562 | 27.98() | TRGB | Harris et al. 1999 |
| 27.97() | PNLF | Hui et al. 1993 bbAdjusted to a Local Group distance scale set by (m – M)0(M31) = 24.5. | ||
| 27.78() | SBF | Tonry & Schechter 1990 bbAdjusted to a Local Group distance scale set by (m – M)0(M31) = 24.5. | ||
| NGC5253 | 404 | 28.08() | Cepheids | Saha et al. 1995 |