CO (J=1-0) Observation of the cD Galaxy of AWM7: Constraints on the Evaporation of Molecular Gas††thanks: OU-TAP 107
Abstract
We have searched for molecular gas in the cD galaxy of a poor cluster of galaxies AWM7 using Nobeyama 45 m telescope. We do not detect CO emission in the galaxy. Our limit of molecular gas in the inner kpc is . We estimate the total mass of molecular gas left in the cD galaxy when the gas deposited by a cooling flow once becomes molecular gas and the molecular gas is continuously evaporated by the ambient hot gas. The observational limit of molecular gas requires , where is the ratio of the heat conduction rate to that of Spitzer. However, this contradicts recent X-ray observations showing . Thus, the non-detection of CO cannot be explained by the evaporation, and most of the cooled gas predicted by a cooling flow model may not change into molecular gas in the cD galaxy. Moreover, we estimate the evaporation time of molecular clouds brought to a cD galaxy through the capture of gas-rich galaxies and find that these clouds should not be evaporated if . Therefore, the non-detection of CO in a cD galaxy could constrain the total mass of the molecular clouds brought into it.
1 Introduction
The centers of galaxy clusters are usually dominated by very massive () galaxies. These galaxies are often called D or cD galaxies. The observations of cold gas ( K) give us the clues of the formation and evolution of the cD galaxies.
Cold gas in cD galaxies has been investigated from the viewpoint of cooling flows. The cooling time of intracluster medium (ICM) exceeds the Hubble time ( yr) in the most region of clusters (Sarazin 1986). However, around cD galaxies, the density of ICM increases and the cooling time decreases to yr. In the absence of heating, the gas is inferred to be cooling at a rate of (Fabian 1994). We will refer to as a mass deposition rate from now on. Thus, the total mass accumulated around the cD galaxies would result in if the cooling occurred steadily at the rate over the Hubble time. Although many observers have tried to detect the cooled gas mainly in massive cooling flow clusters , most of them could not detect such a large amount of cold gas. Using recombination line luminosities, Heckman et al. (1989) estimate that the total mass of K ionized hydrogen is less than . Observations of the atomic hydrogen 21 cm line limit the total mass of optically thin H I to less than (Burns et al. 1981; Valentijn, Giovanelli 1982; McNamara et al. 1990). CO observations limit the mass in clouds similar to Galactic molecular clouds to less than (McNamara, Jaffe 1994; O’Dea et al. 1994; Braine, Dupraz 1994). Among the cD galaxies observed so far (), only one exception is NGC 1275, the cD galaxy in the Perseus cluster. The molecular gas of has been detected (e.g. Lazareff et al. 1989; Mirabel et al. 1989; Inoue et al. 1996), although it is smaller than the prediction of the cooling flow model. These observations may imply that most of the cooled gas becomes something other than molecular gas such as low mass stars, or the actual mass deposition rate, , may be reduced by some heating sources.
Before we move to investigate these possibilities, we should consider another scenario, that is, cooling flows actually exist but the molecular gas deposited by the cooling flows is continuously evaporated by the ambient hot ICM. The evaporation time of a molecular cloud is given by
| (1) |
where and are the density and radius of a molecular cloud, respectively, and is the temperature of hot ICM (Cowie, McKee 1977). In relation (1), the saturation of heat flux is ignored although the following result does not change significantly even in the saturated case (see §4). White et al. (1997) investigate the data of Einstein Observatory and find the relations and , where is the cooling radius. Thus, we obtain the relation:
| (2) |
On the other hand, if the molecular gas is accumulated by cooling flows and the age of cooling flows is much larger than , the mass of molecular gas per unit volume is given by
| (3) |
Therefore, if and do not depend on too much, clusters with small should have large . In these clusters, we could find molecular gas.
Since CO has been searched mainly in massive cooling flow clusters (), the observation of clusters with small is important because of the above reason. Moreover, we note here another importance of searching CO in small clusters. Even if the actual mass deposition rate is reduced by some heating sources, molecular gas may be brought to cD galaxies. For example, the capture of gas-rich galaxies is another possible supply route of molecular gas into cD galaxies. In this case, the detection of the molecular gas would be easier for clusters with small . This is because the X-ray emissions of these clusters are weaker than those of clusters with large , which means that the heating should be less effective in these clusters and that the cold gas would be less affected by the heating.
We search CO in the cD galaxy NGC1129 at the center of a poor cluster AWM7 with relatively small mass deposition rate (; Peres et al. 1998). Note that AWM7 is one of the most closely studied clusters in X-ray. Ezawa et al. (1997) and Xu et al. (1997) find the metal abundance excess of the ICM at the center of the cluster. This suggests that the ICM is not well mixed and the cluster has not experienced violent cluster mergers at least recently. Thus, the molecular gas in NGC 1129, if exist, would keep intact. Moreover, the abundance excess, especially in the cD galaxy (Xu et al. 1997), implies that there has been star formation activity at the cluster center. The excess iron mass in the central region ( kpc) is . Assuming the 1 iron is ejected into ICM per 100 of stars formed, the observation shows that of stars have been formed in the region. On the other hand, the present star formation rate of NGC 1129 is within 1.57 kpc form the center (McNamara, O’Connell 1989). If the distribution of stars in the galaxy is , the star formation rate for kpc is . Thus, the present star formation rate in the region is smaller than that the average through the Hubble time (), and the star formation in the past must be larger than that at present. If the ‘starburst’ occurred recently, molecular gas used for it would be left until present. In this paper, we assume throughout.
2 Observations
The 12CO ( = 1-0) line was observed toward the center of NGC 1129 (, ) with the 45-m telescope at Nobeyama Radio Observatory in 1999 March and May. The half-power beam width (HPBW) was , which corresponds to 7.5 kpc at the distance of NGC 1129 (). The aperture and main beam efficiencies were = 0.40 and = 0.48, respectively.
We used two SIS receivers that can observe two orthogonal linear polarizations simultaneously. Martin-Puplett type SSB filters were used for image sideband rejection. The system noise temperature (SSB) including the atmospheric effect and the antenna ohmic loss was 400-600 K. As receiver backends 2048-channel wide-band acousto-optical spectrometers (AOS) were used. The frequency resolution and channel spacing are 250 kHz and 125 kHz, respectively. Total bandwidth is 250 MHz. Calibration of the line intensity was made by the chopper-wheel method, yielding the antenna temperature () corrected for both atmospheric and antenna ohmic losses. We used the main beam brightness temperature (/) in this paper. The telescope pointing was checked and corrected every hour by observing the 43GHz SiO maser emission in a late type star S-Per or W-And. The absolute pointing accuracy was better than (peak value) throughout the observations.
3 Results
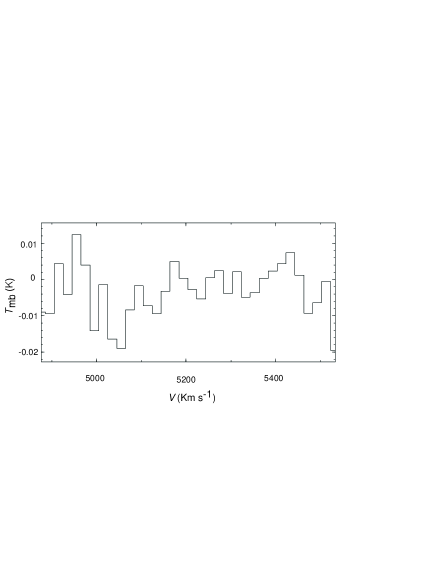
In figure 1, we present the CO(1-0) spectrum which has been binned by and has had baseline removed. The spectrum shows no significant CO(1-0) features either in emission or in absorption. The upper limit to the flux integral is given by
| (4) |
where is the channel-to-channel rms noise, is the smoothed velocity channel spacing, and is the width of line. From figure 1, we obtain K.
We assume that the column density of molecular hydrogen is
| (5) |
(O’Dea et al. 1994). The total mass of molecular hydrogen is given by
| (6) |
where is the beam size at the distance of the source and is the mass of the hydrogen molecule (O’Dea et al. 1994). We assume that for a rectangular line feature. This is the same as McNamara and Jaffe (1994) and nearly corresponds to the internal velocity dispersion of NGC 1129 (McElroy 1995). From equation (6), we obtain within 7.5 kpc from the center. This is one of the most sensitive limits for cD galaxies.
4 Discussion
Although of AWM7 is relatively small, the non-detection of molecular gas conflicts with a cooling flow model if the cooled gas becomes molecular gas and if we ignore the effect of the evaporation. Peres et al. (1998) estimate that the mass deposition rate and cooling radius of AWM7 are and kpc, respectively. The analysis based on a cooling flow model shows that the mass deposited within is (Fabian 1994). Thus, the mass deposition rate within the beam of Nobeyama 45m is , considering the projection effect. Thus, molecular gas of would be detected if the cooling flow occurred steadily at the rate over the Hubble time.
As mentioned in §1, when the molecular gas deposited by a cooling flow is continuously evaporated by the ambient hot ICM, the detection of molecular gas would be relatively easy in clusters with small . Although we cannot detect CO, it constrains the evaporation rate of molecular gas and the heat conduction rate of the ICM. Using the results, we could investigate whether the non-detection of CO is consistent with the evaporation model.
The accumulation time of molecular gas is
| (7) |
Although the properties of the molecular clouds deposited by cooling flows are not well-known, we could calculate the evaporation time of the clouds as follows. In disk galaxies, molecular gas is considered to be produced through disk instabilities (e.g. Larson 1987). In elliptical galaxies like cDs, we expect that the mechanism is ineffective. Instead, we expect that the molecular gas is produced through the thermal instability of ICM. One possible seed of the instability is supernova remnants (Fujita et al. 1996, 1997). Thus, we assume that a supernova remnant is the seed of a molecular cloud and that only thermal evaporation affects the cloud after the formation, although these may oversimplify the evolution of molecular clouds (refer to Loewenstein and Fabian [1990] for more realistic discussion about the issue). Note that the results in the following can be applied to other formation mechanisms of cloud if the resultant mass is nearly the same. If we can ignore the fragmentation and coalescence of molecular clouds, the mass of a molecular cloud is equal to that of a supernova remnant. Since the radius of a supernova remnant is given by
| (8) |
(Fujita et al. 1997), the mass of a molecular cloud is
| (10) | |||||
where and are the pressure and the density of ICM, respectively, is the energy released by a supernova, and is the hydrogen mass.
If molecular clouds are in pressure equilibrium with the ambient ICM, the density of the molecular gas is
| (11) |
where is the temperature of the molecular gas. Since , the radius of a molecular cloud is
| (12) | |||||
We assume that heat is supplied to molecular clouds from the isothermal X-ray gas component prevailing even in the central region of clusters (e.g. Ikebe et al. 1999). Moreover, we assume that the isothermality of the component is retained by adiabatic heating or magnetic loops connected to the overall thermal reservoir of the cluster (e.g. Norman, Meiksin 1996) or the large heat conduction rate of the gas constituting the component. The evaporation time of a molecular cloud embedded in ICM is given by
| (14) | |||||
(Cowie, McKee 1977). Equation (14) shows that if is larger than that given in equation (10), should be larger. The parameter is the ratio of the heat conduction rate to that of Spitzer (1962) and (Cowie and McKee [1977] assume ). When , the heat conduction rate and the mean free path of an electron are considered to be regulated by plasma instabilities around the cloud (Pistinner et al. 1996; Hattori, Umetsu 1999). If the mean free path of an electron is comparable or even greater than the radius of a cloud, the thermal evaporation is saturated. Defining the saturation parameter,
| (15) | |||||
the saturation occurs when (Cowie and McKee 1977). In the saturated case, the evaporation time is given by
| (17) | |||||
(Cowie, McKee 1977).
We will adopt and ; the temperature of a molecular cloud is the typical one in the Galaxy (Scoville, Sanders 1987). If we adopt the observed values and keV (Mohr et al. 1999; Ezawa et al. 1997), equation (8) and (12) yield pc and equation (15) shows that the saturation occurs when . If the age of a cooling flow ( yr; Fabian 1994) is much larger than the evaporation time of a molecular cloud, the evaporation of molecular gas should be balanced with the accumulation. In this case, the evaporation time should be equal to the accumulation time. From equations (7), (14), (15), and (17), this requires . However, recent observations of ASCA show that ICM is inhomogeneous in temperature at least in some clusters (e.g. Ikebe et al. 1999). In order to explain this inhomogeneity by the cooling flow model, must be less than at least around cooler X-ray gas (Pistinner et al. 1996; Hattori, Umetsu 1999) if the cooler gas component is not isolated by something like a magnetic field. Therefore, as long as , the evaporation cannot account for the non-detection of CO and most of the cooled gas may become something other than molecular gas such as dust (Fabian et al. 1994; Voit, Donahue 1995; Edge et al. 1999) or low mass stars (Sarazin, O’Connell 1983), or there may be something wrong in the cooling flow model, that is, the actual mass deposition rate is much less than the one estimated by X-ray observations.
So far, we have not considered the molecular gas brought by gas-rich galaxies merged into cD galaxies including NGC1129. Finally, we examine the evaporation of this kind of molecular gas. The mass of a molecular cloud brought through the capture would be larger in comparison with the case of cooling flows (; equation [10]). If molecular clouds in captured galaxies are similar to those in our Galaxy, the masses are typically (Binney, Tremaine 1987). Thus, if we adopt equation (11) and the normalizations therein, pc. From equations (15) and (14), we expect yr for . Moreover, even if , we obtain yr. Thus, the evaporation can be ignored. This means that if molecular gas is brought into a cD galaxy through galaxy captures and , the gas should be left there. (It is to be noted that when keV, equation [14] shows that the condition requires .) Hence, the non-detection of molecular gas strongly constrains the amount of molecular gas brought into the cD galaxy through galaxy captures. Using a theoretical model based on a hierarchical clustering scenario, Fujita et al. (1999) predict the amount of the molecular gas and compare it with the observations.
5 Conclusions
We have searched for CO emission from the cD galaxy NGC 1129 in AWM7. We have obtained the upper limit of molecular hydrogen mass (). This is one of the most sensitive limits for cD galaxies. We predict the total mass of molecular gas left in the cD galaxy on the assumption that while the gas deposited by a cooling flow once becomes molecular gas, the molecular gas is continuously evaporated by the ambient hot gas. We find that the upper limit of molecular hydrogen mass shows , where is the ratio of the heat conduction rate to that of Spitzer (1962). However, this is inconsistent with recent X-ray observations showing . Thus, most of the cooled gas predicted by a cooling flow model does not seem to become molecular gas in the cD galaxy. Therefore, if as is suggested by the X-ray observations, the ultimate fate of most of the cooled gas may be something other than molecular gas such as dust or low mass stars. Alternatively, the actual mass deposition rate may be much less than the one predicted by a cooling flow model.
We find that molecular clouds brought to a cD galaxy by the gas-rich galaxies captured by the cD should not be evaporated when . This implies that if we obtain the upper limit of the mass of molecular gas in a cD galaxy, we could constrain the supply of molecular gas brought into through the galaxy captures.
We thank an anonymous referee for invaluable advice and suggestions. This work was supported in part by the JSPS Research Fellowship for Young Scientists.
References
Binney J., Tremaine S. 1987, Galactic Dinamics (Princeton; New Jersey)
Braine J., Dupraz C. 1994, A&A 283, 407
Burns J.O., White R.A., Haynes M.P. 1981, AJ 86, 1120
Cowie L.L., McKee C.F. 1977, ApJ 211, 135
Edge A.C., Ivison R.J., Smail I., Blain A.W.,Kneib J.-P. 1999, MNRAS 306, 599
Ezawa H., Fukazawa Y., Makishima K., Ohashi T., Takahara F., Xu H., Yamasaki N.Y. 1997, ApJL, 490, 33
Fabian A.C. 1994, ARA&A 32, 77
Fabian A.C., Johnstone R.M., Daines S.J. 1994, MNRAS 271, 737
Fujita Y., Fukumoto J., Okoshi, K. 1996, ApJ 470, 762
Fujita Y., Fukumoto J., Okoshi, K. 1997, ApJ 488, 585
Fujita Y., Nagashima M., Gouda N. 1999, PASJ submitted
Heckman T.M., Baum S.A., van Breugel W.J.M., McCarthy P.J. 1989, ApJ 338, 48
Hattori M, Umetsu K. 1999, ApJ in press
Ikebe Y., Makishima K., Fukazawa Y., Tamura T., Xu H., Ohashi T., Matsushita K. 1999, ApJ 525, 58
Inoue M.Y., Kamono S., Kawabe R., Inoue M., Hasegawa T., Tanaka M. 1996, AJ 1111, 1852
Larson R.B. 1987, in Starbursts and Galaxy Formation, ed. Trinh Xuan Thuan, T. Montmerle, and J. Tran Thanh Van (Editions Frontieres; France)
Lazareff B., Castets A., Kim D.W., Jura M. 1989, ApJL 336 13
Loewenstein M., Fabian A.C. 1990, MNRAS, 242, 120
Mirabel I.F., Sanders D.B., Kazes I. 1989, ApJL 340, 9
McElroy D.B. 1995, ApJS 100, 105
McNamara B.R., Bregman J.N., O’Connell R.W. 1990, ApJ 360, 20
McNamara B.R., Jaffe W. 1994, A&A 281, 673
McNamara B.R., O’Connell R.W. 1989, AJ 98, 2018
Norman C., Meiksin A. 1996, ApJ 468, 97
Mohr J.J., Mathiesen B., Evrard A.E. 1999, ApJ 517, 627
O’Dea C.P., Baum S.T., Maloney P.R., Tacconi L.J., Sparks W.B. 1994, ApJ 422, 467
Pistinner S., Levinson A., Eichler D. 1996, ApJ 467, 162
Peres C.B., Fabian A.C., Edge A.C., Allen S.W., Johnstone R.M., White D.A. 1998, MNRAS 298, 416
Sarazin C.L. 1986, Phys. Mod. Rev. 58, 1.
Sarazin C.L., O’Connell R.W. 1983, ApJ 268, 552
Scoville N.Z., Sanders D.B. 1987, Interstellar Processes, p21 (Tokyo:Dordrecht)
Spitzer L. 1962, Physics of Fully Ionized Gases (New York: Interscience)
Valentjin E.A., Giovanelli R. 1982, A&A, 114, 208
Voit G.M., Donahue M. 1995, ApJ, 452, 164
White D.A., Jones C., Forman W. MNRAS 292, 419
Xu H., Ezawa H., Fukazawa Y., Kikuchi K., Makishima K., Ohashi T., Tamura T. 1997, PASJ 49, 9