Gravo-thermal properties and formation of elliptical galaxies. ††thanks: Based on observations collected at the Canada France Hawaii Telescope and at the European Southern Observatory, La Silla, Chile
Abstract
We have analyzed a sample of galaxies belonging to three clusters: Coma, Abell 85, and Abell 496 (real galaxies) and a sample of simulated elliptical galaxies formed in a hierarchical merging scheme (virtual galaxies). We use the Sérsic law to describe their light profile. The specific entropy (Boltzmann-Gibbs definition) is then calculated supposing that the galaxies behave as spherical, isotropic, one-component systems. We find that, to a good approximation (%), both real and virtual galaxies have an almost unique specific entropy. Within this approximation the galaxies are distributed in a thin plane in the space defined by the three Sérsic law parameters, which we call the Entropic Plane. A further analysis shows that both real and virtual galaxies are in fact located on a thin line, therefore indicating the existence of another – and yet unknown – physical property, besides the uniqueness of the specific entropy.
A more careful examination of the virtual galaxies sample indicates a very small increase of their specific entropy with merging generation. In a hierarchical scenario, this implies a correlation between the specific entropy and the total mass, which is indeed seen in our data. The scatter and tilt of the Entropic Line, defined by Lima Neto et al. (1999a), are reduced when this correlation is taken into account. Although one cannot distinguish between various generations for real galaxies, the distribution of their specific entropy is similar to that in the virtual sample, suggesting that hierarchical merging processes could be an important mechanism in the building of elliptical galaxies.
Key Words.:
Gravitation; Methods: N-body simulations; Galaxies: clusters: individual: Coma, Abell 85, Abell 496; Galaxies: elliptical and lenticular, cD; Galaxies: evolution; Galaxies: formation; Galaxies: fundamental parameters; Galaxies: structure1 Introduction
Elliptical galaxies present a striking regularity in their global luminosity distributions. Within a wide range of sizes, the light profile of elliptical galaxies can be described by a non-homologous generalization of the de Vaucouleurs profile, the Sérsic law (e.g. Caon et al. 1993; Graham & Colless 1997; Prugniel & Simien 1997).
This regularity may be understood in terms of a relaxation process: elliptical galaxies seem to be in a quasi-equilibrium state, implying that they should obey the virial theorem. From the second law of thermodynamics, a dynamical system in equilibrium is in a maximum entropy state. Due to their peculiar properties (long range unshielded interactions, equivalence of inertial and gravitational mass, etc.) the thermodynamics of gravitational systems present some difficulties, as well explained in academic books (e.g. Saslaw 1985).
For these systems an equilibrium state is never really reached. Various dynamical time scales can be defined: the natural dynamical time (where is the mean density of the system), the violent relaxation time scale, , with , related to the phase mixing process which leads to a quasi-equilibrium state, and a large secular time scale , which is related to the slow effects of two-body gravitational interactions. It is essentially on this scale that one can assert that the equilibrium of a self-gravitating system is never established.
For elliptical galaxies, we have with (where is the number of particles). Therefore even if the entropy of a galaxy is ever growing on the secular time scale, after violent relaxation we have . Stating that the system is in a quasi-equilibrium stage is equivalent to saying that the entropy is quasi-constant.
However, maximizing the entropy results in an isothermal sphere (Lynden-Bell 1967) which is not valuable either from the point of view of physics (divergent total mass) or from observations (observed density profiles are steeper than the isothermal profile; see also White & Narayan 1987).
It is important to note that although there are no exact stationary entropy states for self-gravitating systems (that is, no absolute maximum entropy states), lowest energy states may exist, as suggested by Wiechen et al. (1988). In order to reach such equilibrium states, the system must necessarily undergo a violent relaxation phase, be it through a collapse or a merger. However the final configuration reached depends, in principle, on how strong the violent relaxation phase was. This raises the interesting question of how these equilibria, based on minimum energy, would relate to the final entropy of the system.
Numerous works have been devoted to the entropy problem (see for instance Merritt 1999). In a previous paper (Lima Neto et al. 1999a, hereafter LGM), a different approach has been adopted: instead of trying to obtain the final expected configuration by maximizing the entropy, LGM admit the existence of a state of quasi-constant entropy and calculate this entropy by deriving it from the observed light (mass) distribution. In order to compare objects of different masses, LGM introduced the specific entropy , that is the entropy normalized by the mass. The specific entropy was then calculated by assuming that the stars obey the equations of state of an ideal gas and using the standard thermodynamical definition of the entropy. LGM showed that the galaxies of two clusters and a group had the same value of and, therefore, that one could derive relative distances between these clusters using the Sérsic profile to model the light distribution. LGM suggested that the galaxies having an unique could explain distance indicators based on the shape of the brightness profile of galaxies, like those proposed by Young & Currie (1994, 1995).
As in LGM, we will describe the light distribution of an elliptical galaxy using a Sérsic profile:
| (1) |
characterized by three primary parameters: , the shape parameter (independent of cluster distance), , the scale parameter (distance dependent, in arcsec), and , the intensity parameter (in erg s-1 arcsec-2).
In contrast with LGM, who used the thermodynamical definition of the entropy, we will adopt here the microscopic Boltzmann-Gibbs definition, therefore eliminating the assumption based on the equations of state of an ideal gas. Assuming that elliptical galaxies are well described by the Sérsic law, we have derived the specific entropy (see details in Appendix I):
| (2) |
with:
| (3) |
Should the specific entropy of galaxies, , be a constant or, at least, display a small dispersion around its mean value, then Equation (2) would define a thin surface in the parameter space [], or a plane in the space []. The results presented in LGM suggest that this is indeed the case.
In the next section we describe the data used in this paper, i.e. the surface brightness of cluster galaxies as well as that of simulated galaxies. We also discuss the fitting techniques used to derive the Sérsic profile parameters appearing in Equation (2); in Sections 3.1 and 3.2 we look for correlations between these parameters; in Section 3.3 we show that besides the uniqueness of the specific entropy of galaxies, another relation is also observed. This question is revisited in the context of the cosmological scenario of hierarchical merging galaxy formation in Section 4. We argue that the observed variations of the specific entropy of galaxies are correlated with their total luminosity (or mass). We then show in Section 5, how this correlation helps to understand the tilt of the Entropic Line defined in LGM and therefore to further refine the profile-shape distance indicator of galaxies based on the shape parameter. We discuss our results in the last section.
2 The data and fitting methods
Our goal is to fit the surface brightness of elliptical galaxies with two or three parameters, to search for correlations between these parameters and to look for underlying physical properties.
2.1 The data
2.1.1 Real galaxies
We have used data on galaxies belonging to three clusters: Coma, Abell 85 and Abell 496. These galaxies were selected: 1) visually as having an elliptical shape on our CCD images, and 2) spectroscopically as having a redshift within the corresponding cluster range. The photometric data are described in Lobo et al. (1997), Slezak et al. (1998) and Slezak et al. (1999), and the spectroscopic data in Biviano et al. (1995), Durret et al. (1998) and Durret et al. (1999) for these three clusters respectively. We have determined the growth curve of each galaxy using the ellipse task of iraf111iraf is the Image Analysis and Reduction Facility made available to the astronomical community by the National Optical Astronomy Observatories, which are operated by the Association of Universities for Research in Astronomy (AURA), Inc., under contract with the U.S. National Science Foundation.. The growth curves were determined with and without background subtraction.
The first two of these clusters have already been analyzed for the same purpose in a previous paper (LGM), but with circular apertures. We present here a new analysis of these two clusters, together with a third cluster (Abell 496), based on elliptical fits adapted to the geometry of each galaxy.
2.1.2 Simulated (virtual) galaxies
We have used the merger remnants described in Capelato et al. (1995, 1997). There are three merger generations: (1) the end-products of merging King spheres (with varying impact parameter, relative energy and angular momentum), (2) mergers between first-generation mergers, and (3) mergers between second-generation and between first and second-generation mergers.
2.2 The fitting method
2.2.1 Real galaxies
For each galaxy in our cluster sample, we have obtained the growth curve (integrated luminosity within elliptical regions of area , where and are the semi-major and semi-minor axes).
The background contribution was determined individually for each galaxy by fitting the last four points of the growth curve as a function of the surface by a straight line. We checked the robustness of this result by also fitting the last 5, 3 and 2 points of the growth curve.
After determining the background contribution, we have subtracted it from the growth curve. Then we determined the total luminosity, , using the last points of the growth curve, the half-luminosity (or effective) radius, , and the radius containing 99% of the total luminosity, .
We have then fit the growth curves (corrected for the sky) using the integrated form of the Sérsic law:
| (4) |
where the value of is not a radius but an equivalent radius, , and is the standard incomplete Gamma function. The luminosity growth curve fits were done with a standard least square minimization method, using the ‘minuit’ programme from the CERN software library.
In order to avoid effects due to the seeing, we have used only data points from 2.0 arcsec outwards (the seeing was FWHM arcsec for Coma and 1.2 arcsec for A85 and A496). The fits were done using data points up to so that for all galaxies the same amount of light was used for the fits. The results of these fits are given in Tables 3, 4, and 5.
2.2.2 Simulated galaxies
For simulated galaxies we have computed a mean radial mass growth curve (that is, integrated mass instead of integrated luminosity), as follows. Each galaxy was randomly projected in a plane and a growth curve was computed for each projection by simply counting the particles inside iso-density ellipses. These projected growth curves (500 for each galaxy) were then used to compute a mean one. Having determined a growth curve for each simulated galaxy, we have proceeded in the same way as for real galaxies, fitting it to the integrated Sérsic profile.
The effective radius (i.e. the projected radius containing half of the total light) is given by LGM:
| (5) |
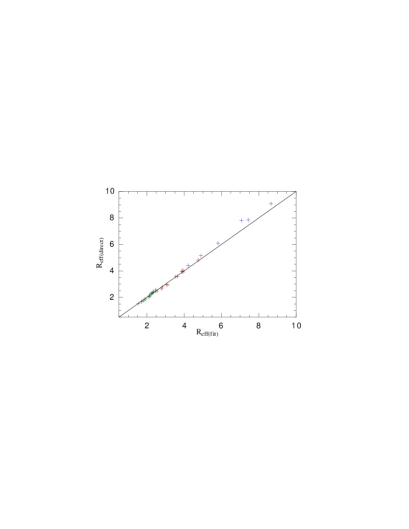
We notice that the simulated galaxy profiles we obtained were extremely close to Sérsic profiles. This agrees with the results obtained by Capelato et al. (1995) using a different fitting technique. In Fig. 1 we compare the effective radius of simulated galaxies as estimated from relation (5) with that directly measured on the simulations. As it can be seen there is a good agreement between these two quantities.
3 Relations and correlations
The last columns of Tables 3, 4, and 5 give the values of the specific entropy, , for the galaxies of our cluster sample. Notice that we cannot compare directly the values of since they depend on , which is distance dependent (we use the apparent given in arcsec). Neither can we compare the values of for a real cluster and for the simulation, since they have different units for and . However, we can compare different generations of mergers, as well as the relative dispersion around the mean value of for all real and simulated galaxies.
Table 1 gives the mean values and dispersions of the specific entropy for the whole sample of galaxies. As expected, the mean specific entropy varies from cluster to cluster, reflecting the different distance of each cluster (cf. LGM). For each real cluster, the dispersion is about 10% around the mean value.
For virtual galaxies, the specific entropy seems to increase with the hierarchy, but with a much smaller dispersion, around 5% of their mean values within each generation. This small dispersion is reminiscent of the results discussed by Capelato et al. (1997), which show that the scatter of the Fundamental Plane defined by virtual galaxies is smaller than for the observed ones by a factor of about 2. The increasing of with the hierarchy of the merger will be addressed in Section 4.
| Real galaxies | Virtual galaxies | ||||||
|---|---|---|---|---|---|---|---|
| Coma | A85 | A496 | 1st gen | 2nd gen | 3rd gen | All | |
| Npts | 69 | 30 | 34 | 17 | 13 | 5 | 35 |
| Mean | -7.7 | -8.9 | -8.7 | 3.59 | 4.31 | 4.96 | 4.05 |
| Median | -7.8 | -9.2 | -8.9 | 3.61 | 4.34 | 4.91 | 4.07 |
| 0.7 | 0.8 | 0.8 | 0.09 | 0.15 | 0.29 | 0.53 | |
It is the relatively small scatter of the specific entropy of galaxies around their mean values which justifies the results discussed in LGM, leading to the definition of a mean specific entropy plane, defined through Equation (2). We will call it the Entropic Plane. However, as we will see in the following, there is another relation linking the observed quantities of galaxies.
3.1 Correlations with real galaxies
The correlations of the Sérsic profile parameters taken two by two are displayed in Figures 2, 3 and 4. Notice that we used the “astronomical like” quantity instead of .
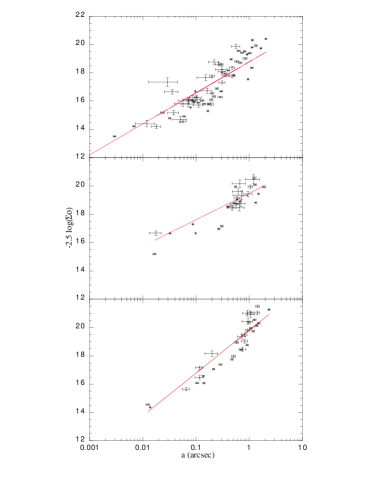
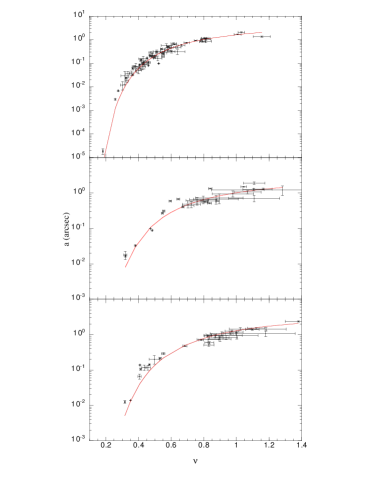
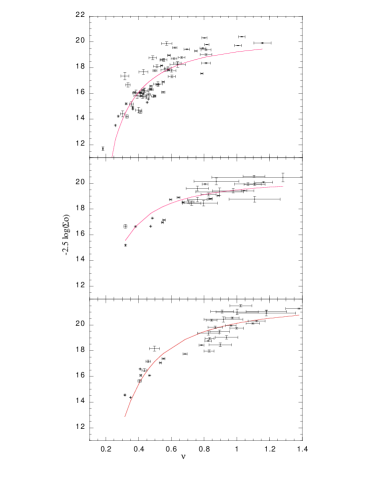
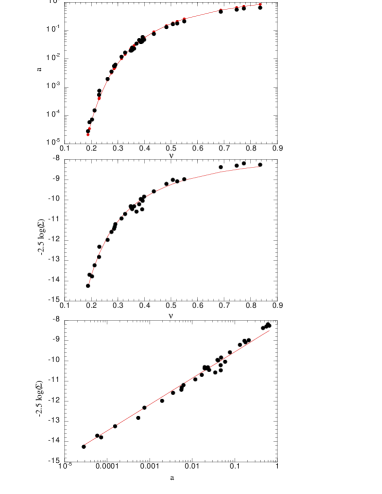
These correlations all have the same general aspect as those presented in LGM: the three parameters appear well correlated two by two. This strongly suggests that galaxies are not distributed randomly around their mean Entropic Plane but, instead, are distributed along a thin curve in this plane.
3.2 Correlations with virtual galaxies
A similar analysis applied to virtual galaxies is shown in Figure 5. The correlations of the Sérsic parameters taken two by two are similar to those found for real galaxies. However, the scatter for virtual galaxies is much smaller.
3.3 Another relation?
The results discussed above suggest that we may go one step further: since the projections of the galaxies belonging to the Entropic Plane are simultaneously three thin curves, the galaxies must in fact be located on a thin curve in the Entropic Plane.
In order to check this hypothesis, we will look at the Entropic Plane edge-on and face-on. This requires a rotation to a new coordinate system [], defined by:
| (6) |

We apply this rotation to each galaxy and show the result in Fig. 6 for virtual galaxies. This figure suggests several comments:
-
•
The value of the specific entropy depends only on , . Indeed, as a first approximation, virtual galaxies all have the same specific entropy, its numerical value depending on the choice of units. Deviations from this constant value will be addressed in the next section.
-
•
The galaxies are all effectively located on a curve (in fact very nearly a straight line):
Applying the same rotation to the real galaxies data gives quite similar results as for the virtual ones, as seen in Fig. 7. However:
-
•
The scatter is much larger;
-
•
It is not clear whether the relation found for virtual galaxies can be approximated by a straight line as before.

The curves displayed in Figs. 2–5 were obtained by assuming that the relation may be approximated by a straight line. Their derivations are given in Apppendix II.
At present we do not know of any physical explanation for this relation. In order to have a curve in a three-dimensional space, we need two surfaces to intersect. If one of them is the Entropic Plane, then the other one must be derived from an independent relation, for instance, a scaling law relating the gravitational potential energy to the total mass, or the depth of the potential well to the mean potential (as also suggested by Lima Neto et al. 1999b). Such an intersection of surfaces is actually a geometrical interpretation of the scaling relations that govern the physics of a given system. This kind of problem is similar, for example, to the one encountered when dealing with the origin of the Tully-Fisher relation (e.g. Mo et al. 1998) or of the luminosity–temperature relation for X-ray clusters of galaxies (e.g. Markevitch 1998).
4 Is the specific entropy really unique?
4.1 The merging scenario
As explained above, the virtual elliptical galaxies we are using come from the merging of successive generations. In such merging processes the energies and masses of the progenitors will be redistributed in order to generate another elliptical. In this section we analyze the effect of merging on the value of the specific entropy.
When viewing a movie displaying the simulation of a galaxy merger as compared to one displaying a cold self-gravitational collisionless collapse, one is struck by the much more violent matter motions (which are actually the engine for the violent relaxation process) occurring in the collapse simulation. Furthermore, what one observes in such movies is, in a sense, quite similar to an observation of the real universe, that is, a macroscopic observation. This is in contrast with the microscopic description one may obtain from the knowledge of detailed evolution of the phase space positions of each particle provided by the simulation. In other words, the relevant description of the system is done with a coarse-grained distribution function.
In any case, the mixing in phase-space that occurs during violent relaxation is responsible for the increase of the coarse-grained entropy of a dynamical system (Tremaine et al. 1986, Merritt 1999). However, it is not clear how much the entropy or, perhaps more important, the specific entropy, increases during the violent relaxation phase. Does the entropy increase depend on the amplitude of the time-varying potential induced by the violent matter motions occurring during this phase? It could be that the increase of entropy is small compared to the total mass of the system (note that defining the entropy as in Eq. (10), has the unit of a mass). In this case, the specific entropy increment could be insignificant when compared with the change of other quantities like, e.g., the total gravitational energy or the total mass of the system (as indeed will be shown below).
4.2 Shift of the specific entropy
A careful inspection of the specific entropy (which is given by ) both for virtual and real galaxies indeed shows that it does vary, although slightly. We have zoomed the left panel of Fig. 6 and show the result in Fig. 8: an overall increase of the specific entropy is observed ( is not exactly a constant). Three vertical lines have been drawn, corresponding to the mean entropy of the three successive generations of galaxies. The specific entropy is actually different for each generation of galaxies, and seems to increase by quanta of specific entropy from one generation to the next, although the jump of specific entropy is quite small (between 10 and 20 %, see also Table 1).

One obvious difference between galaxies of different generations is the increase of their total mass. In fact, even in a given generation there are galaxies with different masses because of slightly different initial orbital parameters of the progenitors. Therefore, we have plotted the specific entropy as a function of the total light (mass), i.e., the integrated luminosity (mass) given by relation (4) extrapolated to infinity:
| (7) |
The corresponding Fig. 9 shows that the total mass allows to discriminate clearly the entropy of the three generations of galaxies. Notice that it is not the mass by itself which is really responsible for the shift of the specific entropy, but rather the merging process.
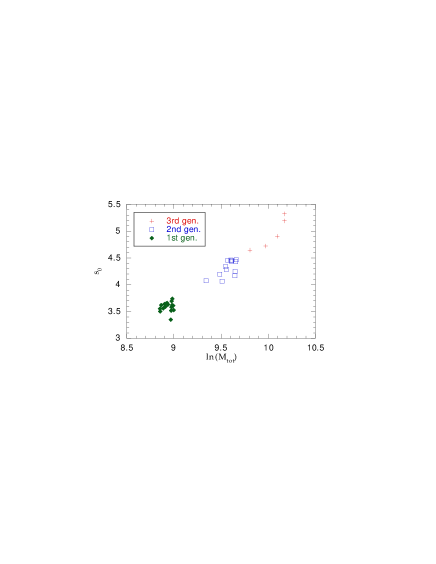
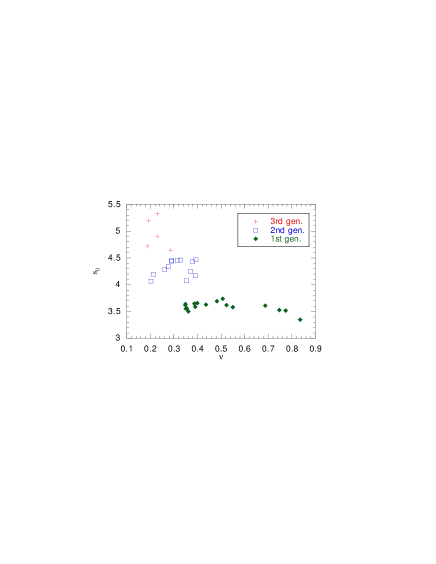
Other parameters do not allow such a clear discrimination between generations. For instance we have plotted the specific entropy as a function of the parameter for virtual galaxies (Fig. 10). For a given value of , several values of the specific entropy are possible, implying that the parameter is not a good discriminant between generations.


In Fig. 11 we show a plot similar to Fig. 8, but now using the real galaxies data; the same overall trend of an increase of the specific entropy () with seems to occur with real galaxies. The striking similarities of these two figures further reinforces the hypothesis that elliptical galaxies have been formed by mergers.
Although we do not know to which generation each real galaxy belongs, we may push the analogy between real and virtual galaxies a little further by searching for correlations between the entropy and luminosity. The corresponding plots are shown in Fig. 12. Again, there is a correlation between and for real galaxies, although with lower signal-to-noise ratio. We now investigate the implications of such a correlation in the context of the Entropic Line defined by LGM.
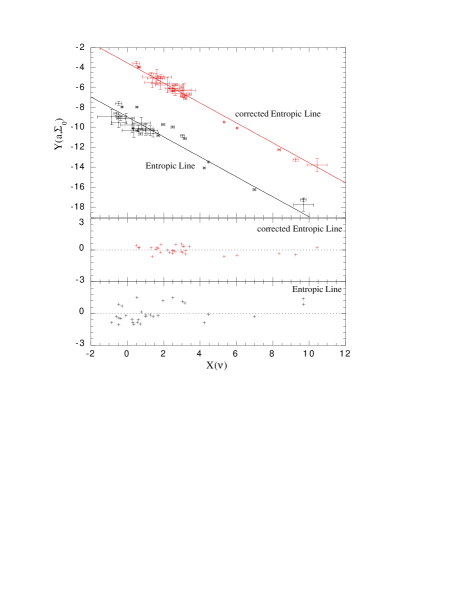
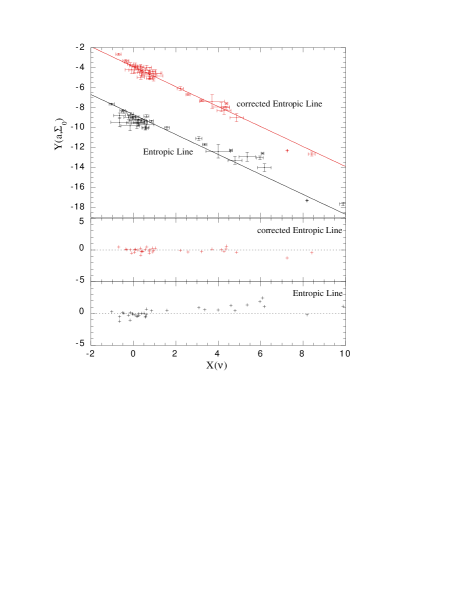
5 The Entropic Line revisited
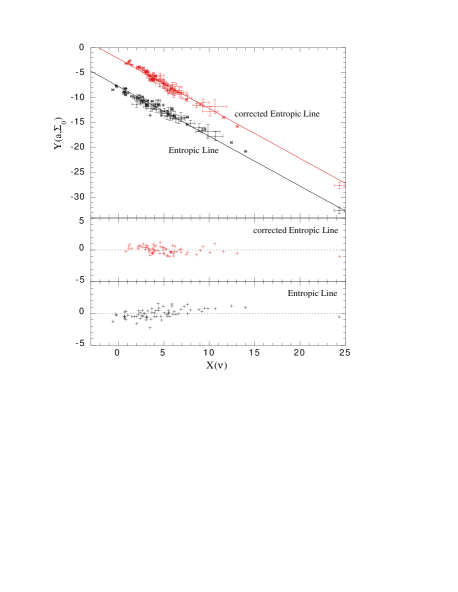
LGM have proposed to rewrite Equation (2) as:
| (8) |
Equation (8), relating as a function of , is the equation of a straight line with a slope , called the Entropic Line in LGM, which is, in fact, the Entropic Plane seen edge-on; in this equation is the mean value of the specific entropy of galaxies in a given cluster (as in Table 1). Remember that is a distance dependent quantity and thus that values for different clusters are not directly comparable.
In their paper, LGM compared the observed data to the predictions of Eq. (8), showing that there is a small difference between the corresponding slopes (see Table 2, col. 3). The fact that the Entropic Line obtained with the observed data had a slope different from was referred to as the tilt of the Entropic Line. However, as we have seen in the last Section, the specific entropy varies with total mass (or light) and, as we will see below, this may be at the origin of the tilt.
| Cluster | slope1 | slope2 | (residual) | (residual) | |
|---|---|---|---|---|---|
| Coma | -7.7 | -0.93 | -1.06 | 0.74 | 0.51 |
| Abell 85 | -8.9 | -0.88 | -1.05 | 0.82 | 0.34 |
| Abell 496 | -8.7 | -0.81 | -1.05 | 0.78 | 0.37 |
We assume the specific entropy to be a function of the total luminosity, , as given by Eq. 7:
the slope being obtained through an ordinary least square mean fitting of the data (shown as lines in Fig. 12). The intercept may be understood as a corrected specific entropy, that is, taking into account the correlation with .
A “corrected” equation can then be written in place of equation (8) as:
| (9) |
In Figs. 13, 14 and 15 we display both the original LGM Entropic Line and the corrected Entropic Line, together with their corresponding residuals, for the clusters of our sample. Notice that the slope of the corrected Entropic Line is close to , indicating that the tilt between the data and the predictions based on an unique specific entropy for galaxies, has diminished (See Table 2, col. 4). Moreover, the dispersion around the corrected Entropic Line is improved compared to the dispersion around the uncorrected one (compare cols. 5 and 6 in Table 2).
6 Discussion and conclusions
We have shown in this paper that the observational data for galaxies belonging to clusters confirm the hypothesis that their specific entropy is, to first order, unique. As a consequence, the galaxies tend to stay in a thin plane (the Entropic Plane) in the space of the Sérsic light profile parameters. Moreover, we have also shown that the slight observed variations of the specific entropy of galaxies are correlated to their total luminosities. Henceforth, by taking this correlation into account, we were able to apply a correction which resulted in decreasing the scatter of the Entropic Plane.
We have also shown that, besides the Entropic Plane, another relation must exist between the Sérsic profile parameters of galaxies. The intersection of this relationship with the Entropic Plane defines a curve in the 3D Sérsic parameter space which appears very well defined in our data. The physical origin of this new relation is unknown, although it may be related to the gravitational energy of galaxies, as suggested by Lima Neto et al. (1999b).
The existence of this curve explains the tight correlations between the Sérsic parameters, as noted in LGM. It constitutes the theoretical background for the photometrical distance indicator proposed by various authors (Young & Currie 1994, 1995; Binggeli & Jerjen 1998).
Our study is solely based on quantities extracted from photometric data. The dynamics are in fact hidden in the shape parameter of the fitting Sérsic profiles. Usually, both photometric and spectroscopic studies are performed on galaxies, leading for instance to the “Fundamental Plane”. It is interesting to notice that some authors have shown that globular clusters (Bellazzini 1998), galaxies (Guzmán et al. 1993) or even galaxy clusters (Fujita & Takahara 1999) are located on a line in that plane instead of populating the whole area a priori permitted by the natural range of variation of the parameters. The question of how to derive the “Fundamental Plane” (photometry plus spectroscopy) from the Entropic Plane (photometry alone) will be addressed in a forthcoming paper.
Elliptical galaxies are well described by a three parameter profile; since two constraints are acting, only one parameter is free. Because the total luminosity of galaxies correlates with the shape parameter (Prugniel & Simien 1997, Binggeli & Jerjen 1998), their light profile should be completely defined by their total luminosity. Shape and luminosity are probably correlated as a consequence of the relaxation process; this is consistent with the fact that high luminosity galaxies have flat profiles while those of dwarfs are peaked.
We must stress that the calculation of the specific entropy requires a good choice for the density profile. Indeed, besides an intensity and a length scale, which are the basic parameters of all the laws used (for instance the de Vaucouleurs law), structural parameters are also necessary in order to account for the shapes, which reflect the dynamical properties of the galaxies.
In this context, we found that the choice of the Sérsic law is particularly suitable not only for the sake of simplicity, but also because it is the bulk of the light which is affected by the variations of the shape factor, as pointed by Graham & Colless (1997). One can find in the literature other profiles depending on a shape factor, for instance the -model. However, due to the asymptotic behaviour of this model, the entropy and mass calculated in this case are essentially located at large radial distances. Besides, the values of these two quantities are very sensitive to any computational cut-off, and, moreover, the observational data in the outskirts of clusters are generally too poor to guide the calculation. Therefore, the -model is not suitable for such calculations.
We do not claim that the Sérsic profile is the ultimate profile of relaxed systems, any more than for instance the de Vaucouleurs profile. However, while the precise analytical expression for a profile may not be fundamental, we understand that taking into account the shape parameters is indeed important. It would then be interesting to see if “Universal” profiles – as for instance the NFW (Navarro et al. 1995) or the Hernquist (1990) profiles – also have shape parameters, allowing the calculation of the specific entropy.
Acknowledgements.
This work was partially supported by FAPESP, CNPq, PRONEX-246, USP/COFECUB, CNPq/CNRS Bilateral Cooperation Agreements, and DGCyT grant PB93-0139. We also acknowledge financial support from the French Programme National de Cosmologie, CNRS.References
- (1) Bellazzini M., 1998, New Astronomy 4, 219
- (2) Binggeli B., Jerjen H., 1998, A&A 333, 17
- (3) Binney J., Tremaine S., 1987, “Galactic Dynamics”, Princeton Series in Astrophysics, Princeton, New Jersey
- (4) Biviano A., Durret F., Gerbal D., et al., 1995, A&AS 111, 265
- (5) Caon N., Capaccioli M., D’Onofrio M., 1993, MNRAS 265, 1013
- (6) Capelato H. V., de Carvalho R.R., Carlberg R.G., 1995, ApJ 451, 525
- (7) Capelato H. V., de Carvalho R.R., Carlberg R.G., 1997, in: ‘Galaxy scaling relations: Origins, evolution and application’, p. 331, L.N. da Costa, A. Renzini Editors, Spring-Verlag
- (8) Durret F., Felenbok P., Lobo C., Slezak E., 1998, A&AS 129, 281
- (9) Durret F., Felenbok P., Lobo C., Slezak E., 1999, A&AS in press, astro-ph/9908045
- (10) Fujita Y., Takahara F., 1999, ApJ Letters in press, astro-ph/9905082
- (11) Godwin J., Metcalfe N., Peach J.V., 1983, MNRAS 202, 113
- (12) Graham A., Colless M., 1997, MNRAS 287, 221
- (13) Guzmán R., Lucey J.R., Bower R.G.R.A.S., 1993, MNRAS 265, 731
- (14) Hernquist L., 1990, ApJ 356, 359
- (15) Lima Neto G.B., Gerbal D., Márquez I., 1999a, MNRAS 309, 481
- (16) Lima Neto G.B., Gerbal D., Márquez I., 1999b, Proceedings of the XIV Moriond Meeting, in press
- (17) Lobo C., Biviano A., Durret F., et al., 1997, A&AS 122, 409
- (18) Lynden-Bell D., 1967, MNRAS 136, 101
- (19) Markevitch M., 1998, ApJ 504, 27
- (20) Merritt D., 1999, PASP 111,129
- (21) Mo H.J., Mao S., White S.D.M., 1998, MNRAS 295, 319
- (22) Navarro J.F., Frenk C.S., White S.D.M., 1995, MNRAS 275, 720
- (23) Prugniel P., Simien F., 1997, A&A 321, 111
- (24) Saslaw W.C., 1985, ‘Gravitational Physics of Stellar and Galactic Systems’, Cambridge Univ. Press
- (25) Slezak E., Durret F., Guibert J., Lobo C., 1998, A&AS 128, 67
- (26) Slezak E., Durret F., Guibert J., Lobo C., 1998, A&AS in press, astro-ph/9908068
- (27) Tormen G., Bouchet F.R., White S.D.M., 1997, MNRAS 286, 865
- (28) Tremaine S., Hénon M., Lynden-Bell D., 1986, MNRAS 219, 285
- (29) Wiechen H, Ziegler H.J., Schindler K, 1988, MNRAS 232, 623
- (30) White S.D.M., Narayan, R., 1987, MNRAS 229, 103
- (31) Young C. K., Currie M. J., 1994, MNRAS 268, L11
- (32) Young C. K., Currie M. J., 1995, MNRAS 273, 1141
Appendix I: Entropy and the Sérsic profile
We use the microscopic Boltzmann-Gibbs definition of the specific entropy,
| (10) |
where is the total mass and we assume that the function (the coarse-grained distribution function) depends only on the energy . Then, can be determined by the Abel inversion of the density profile (cf. Binney & Tremaine 1987) and the specific entropy may be computed (see formulae below).
In order to compute we have adopted the following hypotheses:
-
•
Spherical symmetry;
-
•
Isotropy of the velocity distribution;
-
•
constant.
From the 2D mass distribution given by the Sérsic profile (using the hypothesis of constant ratio), we have derived a semi-analytical approximation for the 3D mass distribution obtained by deprojecting the Sérsic profile (see LGM):
From the 3D mass distribution we can compute the distribution function and thus the specific entropy. The computation can be done numerically but it is cumbersome. We have therefore found analytical approximations for the specific entropy (see also LGM):
If constant, then the above equations define a surface, the Specific “Entropy Plane” (in the appropriate variables).
Finally, we give for completeness an analytical approximation for the corresponding magnitude for a given set of Sérsic parameters :
Appendix II: Analytical formulae for the correlations
The projection of the relation , introduced in Section 3.3, leads to one dimensional curves in the planes [], [] and []. We give below semi-theoretical formulæ for these relations:
Combining (6) and (11) allows us to recover analytical formulae, which are displayed below. We have superimposed these calculated curves on each of the corresponding data in Figs. 2, 3 and 4, for the real galaxies and in Fig. 5 for the simulated ones.
We obtain for the virtual galaxies the formula:
and successively for Coma:
| (13) | |||||
Abell 85:
and Abell 496:
Appendix III: Growth curve fitting results
| GMP | Name | ||||||||
|---|---|---|---|---|---|---|---|---|---|
| (arcsec) | (mag/) | (mag) | (arcsec) | (mag/) | |||||
| 2727 | IC4026 | 0.32 0.01 | -1.62 0.04 | 15.19 0.06 | 14.56 0.24 | 5.57 0.16 | 20.28 0.09 | 9.46 0.18 | -6.88 |
| 2736 | 0.55 0.01 | -0.53 0.04 | 18.59 0.07 | 17.07 0.26 | 2.71 0.08 | 21.22 0.11 | 3.18 0.21 | -8.42 | |
| 2753 | 0.82 0.01 | 0.06 0.01 | 19.78 0.03 | 17.02 0.09 | 2.86 0.03 | 21.29 0.05 | 0.66 0.08 | -8.13 | |
| 2777 | 0.52 0.00 | -1.01 0.01 | 16.69 0.01 | 17.35 0.03 | 1.05 0.00 | 19.46 0.01 | 3.51 0.02 | -10.00 | |
| 2787 | 0.80 0.02 | 0.06 0.02 | 20.30 0.03 | 17.46 0.11 | 3.01 0.04 | 21.85 0.06 | 0.74 0.10 | -8.26 | |
| 2805 | 0.42 0.02 | -1.15 0.11 | 15.78 0.18 | 15.57 0.72 | 2.37 0.20 | 19.44 0.29 | 5.67 0.56 | -8.19 | |
| 2839 | IC4021 | 0.37 0.01 | -1.49 0.02 | 14.78 0.03 | 14.90 0.11 | 2.88 0.04 | 19.19 0.04 | 7.60 0.08 | -7.81 |
| 2879 | 0.69 0.02 | -0.13 0.03 | 19.42 0.05 | 17.06 0.17 | 2.82 0.05 | 21.31 0.08 | 1.49 0.14 | -8.22 | |
| 2897 | 0.62 0.02 | -0.17 0.03 | 18.69 0.06 | 16.00 0.22 | 3.86 0.10 | 20.93 0.10 | 2.26 0.19 | -7.32 | |
| 2910 | 0.81 0.03 | 0.05 0.03 | 18.35 0.05 | 15.59 0.18 | 2.86 0.06 | 19.87 0.09 | 0.69 0.15 | -7.47 | |
| 2910 | 0.47 0.01 | -0.70 0.04 | 16.55 0.06 | 15.00 0.23 | 3.49 0.09 | 19.71 0.09 | 4.43 0.17 | -7.22 | |
| 2921 | NGC4889 | 0.32 0.01 | -1.03 0.01 | 15.41 0.01 | 11.61 0.04 | 25.12 0.12 | 20.60 0.02 | 9.72 0.03 | -3.29 |
| 2922 | IC4012 | 0.50 0.01 | -0.76 0.03 | 15.79 0.05 | 14.86 0.16 | 2.39 0.05 | 18.75 0.07 | 3.97 0.12 | -7.67 |
| 2940 | IC4011 | 0.41 0.01 | -1.07 0.02 | 16.03 0.04 | 15.10 0.14 | 3.60 0.06 | 19.88 0.05 | 6.15 0.10 | -7.40 |
| 2960 | 0.54 0.01 | -0.39 0.02 | 18.16 0.03 | 15.89 0.10 | 3.86 0.04 | 20.82 0.04 | 3.24 0.08 | -7.35 | |
| 2975 | NGC4886 | 0.28 0.01 | -2.16 0.02 | 14.22 0.03 | 14.02 0.15 | 7.46 0.13 | 20.38 0.05 | 12.45 0.11 | -6.56 |
| 3058 | 1.03 0.02 | 0.31 0.01 | 20.39 0.03 | 16.88 0.07 | 3.29 0.03 | 21.46 0.04 | -0.25 0.06 | -7.83 | |
| 3073 | NGC4883 | 0.41 0.01 | -0.88 0.03 | 16.03 0.05 | 14.33 0.19 | 4.91 0.11 | 19.78 0.08 | 5.90 0.15 | -6.55 |
| 3084 | 0.43 0.01 | -0.99 0.03 | 16.26 0.06 | 15.36 0.21 | 3.19 0.08 | 19.87 0.08 | 5.57 0.16 | -7.64 | |
| 3113 | 0.59 0.01 | -0.34 0.02 | 18.95 0.04 | 16.86 0.13 | 3.13 0.05 | 21.34 0.06 | 2.61 0.10 | -8.06 | |
| 3126 | 1.01 0.02 | 0.22 0.01 | 19.71 0.03 | 16.63 0.09 | 2.75 0.03 | 20.82 0.05 | -0.17 0.07 | -7.98 | |
| 3133 | 0.58 0.02 | -0.47 0.05 | 17.96 0.09 | 16.46 0.33 | 2.44 0.09 | 20.39 0.15 | 2.71 0.26 | -8.26 | |
| 3170 | IC3998 | 0.38 0.02 | -1.14 0.16 | 16.03 0.23 | 14.89 1.02 | 4.53 0.52 | 20.16 0.39 | 6.90 0.81 | -7.04 |
| 3170 | IC3998 | 0.37 0.01 | -1.13 0.05 | 16.07 0.07 | 14.64 0.31 | 5.52 0.19 | 20.34 0.12 | 7.26 0.24 | -6.67 |
| 3201 | NGC4876 | 0.51 0.01 | -0.53 0.03 | 16.68 0.05 | 14.76 0.17 | 3.61 0.07 | 19.54 0.07 | 3.72 0.13 | -6.99 |
| 3205 | 0.81 0.03 | 0.01 0.03 | 19.38 0.06 | 16.82 0.19 | 2.61 0.06 | 20.90 0.10 | 0.68 0.17 | -8.18 | |
| 3206 | 0.60 0.03 | -0.32 0.06 | 17.76 0.11 | 15.71 0.38 | 2.97 0.13 | 20.07 0.17 | 2.43 0.32 | -7.59 | |
| 3213 | 0.43 0.01 | -1.04 0.01 | 15.97 0.01 | 15.31 0.04 | 2.84 0.01 | 19.57 0.02 | 5.54 0.03 | -7.78 | |
| 3222 | 0.46 0.01 | -1.10 0.01 | 15.55 0.01 | 15.78 0.03 | 1.63 0.00 | 18.84 0.01 | 4.76 0.02 | -8.75 | |
| 3269 | 0.43 0.03 | -1.06 0.15 | 16.11 0.25 | 15.67 0.97 | 2.49 0.28 | 19.65 0.39 | 5.38 0.76 | -8.13 | |
| 3291 | 0.81 0.04 | -0.07 0.04 | 19.01 0.07 | 16.87 0.23 | 2.16 0.06 | 20.54 0.12 | 0.68 0.20 | -8.48 | |
| 3291 | 0.43 0.03 | -0.82 0.13 | 17.66 0.19 | 15.90 0.88 | 4.69 0.46 | 21.25 0.35 | 5.52 0.74 | -7.31 | |
| 3292 | 1.16 0.05 | 0.13 0.03 | 19.91 0.07 | 17.52 0.16 | 1.81 0.04 | 20.80 0.09 | -0.60 0.12 | -9.02 | |
| 3296 | NGC4875 | 0.45 0.02 | -0.95 0.09 | 15.71 0.15 | 14.96 0.58 | 2.71 0.18 | 19.12 0.23 | 5.05 0.44 | -7.64 |
| 3302 | 0.50 0.01 | -0.70 0.05 | 17.76 0.08 | 16.54 0.30 | 2.73 0.09 | 20.72 0.12 | 3.95 0.23 | -8.24 | |
| 3329 | NGC4874 | 0.38 0.01 | -0.47 0.01 | 16.79 0.01 | 12.32 0.05 | 20.86 0.12 | 20.91 0.02 | 6.86 0.04 | -3.57 |
| 3340 | 1.75 0.12 | 0.23 0.02 | 21.08 0.05 | 18.61 0.11 | 1.53 0.03 | 21.53 0.07 | -1.44 0.10 | -9.82 | |
| 3352 | NGC4872 | 0.33 0.01 | -1.74 0.08 | 14.19 0.12 | 14.36 0.52 | 3.69 0.22 | 19.19 0.19 | 9.19 0.40 | -7.38 |
| 3367 | NGC4873 | 0.47 0.01 | -0.66 0.03 | 16.33 0.05 | 14.57 0.20 | 3.84 0.09 | 19.49 0.08 | 4.44 0.15 | -6.87 |
| 3367 | NGC4873 | 0.79 0.01 | -0.02 0.01 | 17.54 0.02 | 15.04 0.06 | 2.63 0.02 | 19.14 0.03 | 0.84 0.04 | -7.36 |
| 3383 | 0.55 0.02 | -0.56 0.06 | 18.60 0.11 | 17.34 0.38 | 2.35 0.10 | 21.19 0.17 | 3.07 0.29 | -8.75 | |
| 3400 | IC3973 | 0.41 0.01 | -1.24 0.06 | 14.55 0.10 | 14.57 0.37 | 2.27 0.10 | 18.35 0.15 | 6.03 0.27 | -7.83 |
| 3414 | NGC4871 | 0.30 0.01 | -1.92 0.17 | 14.40 0.23 | 14.34 1.08 | 5.26 0.64 | 19.94 0.38 | 10.69 0.84 | -7.01 |
| 3423 | IC3976 | 0.40 0.02 | -1.29 0.13 | 14.69 0.22 | 14.73 0.82 | 2.39 0.22 | 18.61 0.32 | 6.35 0.61 | -7.87 |
| 3439 | 0.34 0.01 | -1.45 0.13 | 16.65 0.17 | 15.54 0.82 | 6.31 0.57 | 21.54 0.30 | 8.90 0.66 | -7.08 | |
| 3484 | 0.39 0.02 | -1.24 0.14 | 15.81 0.21 | 15.38 0.87 | 3.13 0.31 | 19.85 0.33 | 6.64 0.68 | -7.79 | |
| 3486 | 0.64 0.05 | -0.51 0.10 | 18.23 0.21 | 17.43 0.65 | 1.54 0.12 | 20.36 0.30 | 2.01 0.48 | -9.33 | |
| 3487 | 0.18 0.01 | -4.73 0.12 | 11.69 0.14 | 15.09 0.76 | 8.48 0.72 | 21.73 0.23 | 24.33 0.59 | -8.27 | |
| 3510 | NGC4869 | 0.42 0.01 | -0.85 0.03 | 15.79 0.04 | 13.92 0.19 | 5.28 0.11 | 19.53 0.07 | 5.89 0.15 | -6.25 |
| 3522 | 0.46 0.01 | -0.97 0.05 | 15.90 0.09 | 15.51 0.33 | 2.15 0.08 | 19.17 0.14 | 4.70 0.25 | -8.20 | |
| 3534 | 0.51 0.02 | -0.51 0.07 | 18.10 0.11 | 16.11 0.46 | 3.74 0.19 | 20.96 0.19 | 3.72 0.38 | -7.55 | |
| 3554 | 0.64 0.02 | -0.32 0.05 | 18.34 0.10 | 16.55 0.32 | 2.43 0.09 | 20.48 0.15 | 2.03 0.25 | -8.25 | |
| 3557 | 0.58 0.01 | -0.29 0.02 | 17.82 0.03 | 15.45 0.11 | 3.62 0.05 | 20.24 0.05 | 2.66 0.09 | -7.20 | |
| 3561 | NGC4865 | 0.45 0.01 | -0.78 0.01 | 15.30 0.02 | 13.76 0.06 | 3.81 0.03 | 18.66 0.03 | 4.95 0.05 | -6.57 |
Table 3. Continued.
| GMP | Name | ||||||||
|---|---|---|---|---|---|---|---|---|---|
| (arcsec) | (mag/) | (mag) | (arcsec) | (mag/) | |||||
| 3564 | 0.20 0.02 | -3.14 0.68 | 16.71 0.64 | 14.75 4.63 | 62.56 30.82 | 25.73 1.40 | 21.06 3.94 | -4.73 | |
| 3565 | 0.57 0.03 | -0.25 0.08 | 19.86 0.13 | 17.19 0.51 | 4.27 0.25 | 22.34 0.23 | 2.81 0.42 | -7.77 | |
| 3639 | NGC4867 | 0.49 0.01 | -0.72 0.05 | 15.78 0.10 | 14.56 0.34 | 2.81 0.11 | 18.80 0.14 | 4.10 0.25 | -7.30 |
| 3656 | 0.19 0.01 | -3.97 0.05 | 13.32 0.06 | 14.03 0.33 | 24.10 0.87 | 22.93 0.10 | 22.96 0.26 | -6.06 | |
| 3664 | NGC4864 | 0.48 0.01 | -0.54 0.04 | 16.28 0.06 | 13.97 0.30 | 4.91 0.16 | 19.42 0.13 | 4.39 0.28 | -6.23 |
| 3681 | 0.32 0.02 | -1.54 0.24 | 17.34 0.30 | 15.97 1.60 | 8.37 1.47 | 22.58 0.57 | 9.86 1.33 | -6.97 | |
| 3707 | 0.66 0.02 | -0.23 0.04 | 18.79 0.07 | 16.74 0.25 | 2.61 0.07 | 20.81 0.11 | 1.78 0.20 | -8.21 | |
| 3719 | 0.49 0.02 | -0.66 0.09 | 18.75 0.15 | 17.17 0.58 | 3.38 0.22 | 21.81 0.24 | 4.19 0.46 | -8.24 | |
| 3733 | IC3960 | 0.36 0.01 | -1.42 0.10 | 15.17 0.16 | 14.63 0.64 | 4.12 0.30 | 19.70 0.24 | 7.95 0.49 | -7.19 |
| 3782 | 0.44 0.02 | -0.99 0.11 | 16.23 0.18 | 15.50 0.68 | 2.83 0.22 | 19.75 0.27 | 5.34 0.52 | -7.86 | |
| 3792 | NGC4860 | 0.36 0.01 | -1.22 0.02 | 14.92 0.04 | 13.65 0.15 | 5.45 0.09 | 19.33 0.06 | 7.62 0.12 | -6.28 |
| 3794 | 0.52 0.03 | -0.79 0.10 | 16.72 0.18 | 16.19 0.62 | 1.86 0.13 | 19.53 0.26 | 3.61 0.46 | -8.62 | |
| 3794 | 0.60 0.02 | -0.51 0.06 | 17.31 0.11 | 16.21 0.35 | 1.91 0.08 | 19.61 0.16 | 2.41 0.26 | -8.49 | |
| 3851 | 0.56 0.03 | -0.43 0.07 | 17.81 0.12 | 15.97 0.44 | 2.99 0.15 | 20.35 0.19 | 2.95 0.35 | -7.75 | |
| 3855 | 0.62 0.01 | -0.20 0.03 | 19.54 0.05 | 17.04 0.18 | 3.50 0.07 | 21.75 0.08 | 2.20 0.14 | -7.94 | |
| 3914 | 0.55 0.01 | -0.71 0.03 | 16.09 0.06 | 15.52 0.20 | 1.72 0.04 | 18.69 0.09 | 3.11 0.15 | -8.39 | |
| 4103 | 0.75 0.01 | -0.04 0.01 | 19.29 0.02 | 16.72 0.07 | 2.85 0.02 | 20.99 0.03 | 1.08 0.06 | -8.02 | |
| 4129 | 0.79 0.02 | -0.08 0.02 | 19.51 0.05 | 17.35 0.14 | 2.23 0.04 | 21.09 0.07 | 0.80 0.11 | -8.66 | |
| 4200 | 0.55 0.01 | -0.61 0.03 | 16.88 0.05 | 15.81 0.17 | 2.17 0.04 | 19.49 0.07 | 3.11 0.13 | -8.17 | |
| 4230 | 0.26 0.01 | -2.53 0.03 | 13.50 0.04 | 13.94 0.17 | 7.15 0.14 | 20.21 0.06 | 14.01 0.13 | -6.77 |
| Id. | ||||||||
|---|---|---|---|---|---|---|---|---|
| (arcsec) | (mag/) | (mag) | (arcsec) | (mag/) | ||||
| 152 | 1.11 0.16 | -0.15 0.09 | 18.77 0.22 | 17.72 0.54 | 1.01 0.09 | 19.72 0.30 | -0.48 0.41 | -9.99 |
| 156 | 0.76 0.07 | -0.21 0.09 | 19.60 0.19 | 17.93 0.58 | 1.87 0.15 | 21.28 0.28 | 1.01 0.46 | -9.21 |
| 175 | 0.72 0.06 | -0.32 0.09 | 18.45 0.17 | 17.18 0.54 | 1.64 0.12 | 20.24 0.26 | 1.26 0.42 | -9.07 |
| 179 | 0.89 0.15 | -0.14 0.13 | 19.34 0.29 | 17.82 0.82 | 1.48 0.18 | 20.67 0.43 | 0.26 0.65 | -9.47 |
| 182 | 0.84 0.01 | 0.12 0.01 | 18.82 0.02 | 15.79 0.06 | 3.14 0.02 | 20.27 0.03 | 0.53 0.05 | -7.42 |
| 197 | 0.56 0.01 | -0.51 0.02 | 17.15 0.04 | 15.64 0.15 | 2.61 0.05 | 19.72 0.06 | 3.03 0.12 | -7.81 |
| 202 | 0.80 0.08 | -0.18 0.10 | 18.46 0.22 | 16.81 0.64 | 1.75 0.16 | 20.02 0.32 | 0.77 0.50 | -8.78 |
| 208 | 0.32 0.01 | -1.75 0.11 | 16.66 0.15 | 16.49 0.70 | 4.69 0.45 | 21.84 0.25 | 9.69 0.55 | -8.06 |
| 209 | 1.04 0.02 | 0.18 0.01 | 19.44 0.02 | 16.64 0.06 | 2.34 0.02 | 20.49 0.03 | -0.29 0.05 | -8.23 |
| 212 | 0.89 0.01 | -0.23 0.01 | 19.03 0.02 | 17.91 0.04 | 1.24 0.01 | 20.38 0.02 | 0.30 0.03 | -9.77 |
| 214 | 0.60 0.01 | -0.23 0.02 | 18.74 0.03 | 16.18 0.11 | 3.80 0.06 | 21.08 0.05 | 2.50 0.09 | -7.45 |
| 215 | 0.84 0.01 | -0.29 0.01 | 18.78 0.03 | 17.81 0.08 | 1.22 0.01 | 20.24 0.04 | 0.55 0.07 | -9.76 |
| 218 | 1.11 0.07 | 0.10 0.03 | 20.55 0.08 | 18.24 0.20 | 1.80 0.05 | 21.51 0.12 | -0.47 0.17 | -9.36 |
| 221 | 0.28 0.01 | -1.92 0.04 | 15.74 0.05 | 14.32 0.27 | 13.18 0.48 | 21.91 0.09 | 12.47 0.22 | -5.84 |
| 222 | 0.83 0.05 | -0.23 0.05 | 19.14 0.11 | 17.82 0.32 | 1.45 0.07 | 20.62 0.16 | 0.60 0.25 | -9.52 |
| 225 | 0.67 0.01 | -0.40 0.01 | 18.52 0.03 | 17.34 0.07 | 1.71 0.02 | 20.51 0.04 | 1.70 0.06 | -9.11 |
| 228 | 1.28 0.44 | 0.09 0.13 | 20.47 0.33 | 18.44 0.84 | 1.44 0.43 | 21.23 0.53 | -0.86 0.80 | -9.79 |
| 229 | 0.88 0.14 | -0.18 0.12 | 20.16 0.26 | 18.74 0.78 | 1.44 0.16 | 21.53 0.41 | 0.36 0.65 | -9.94 |
| 235 | 0.98 0.13 | -0.02 0.08 | 19.42 0.18 | 17.49 0.53 | 1.66 0.13 | 20.58 0.29 | -0.07 0.46 | -9.14 |
| 236 | 0.55 0.01 | -0.57 0.02 | 16.97 0.04 | 15.67 0.12 | 2.43 0.04 | 19.59 0.06 | 3.16 0.09 | -7.94 |
| 238 | 0.38 0.01 | -1.49 0.01 | 16.64 0.02 | 17.17 0.09 | 2.13 0.03 | 20.81 0.04 | 6.99 0.07 | -9.24 |
| 242 | 0.98 0.01 | 0.89 0.00 | 20.23 0.00 | 13.75 0.01 | 13.41 0.01 | 21.38 0.00 | -0.08 0.01 | -4.28 |
| 243 | 0.32 0.01 | -1.78 0.03 | 15.19 0.04 | 15.17 0.19 | 4.37 0.12 | 20.37 0.07 | 9.68 0.15 | -7.55 |
| 246 | 1.75 0.62 | 0.29 0.05 | 22.77 0.18 | 20.02 0.40 | 1.74 0.76 | 23.22 0.33 | -1.44 0.51 | -10.28 |
| 253 | 0.76 0.06 | -0.25 0.08 | 18.75 0.17 | 17.29 0.51 | 1.68 0.12 | 20.42 0.25 | 1.01 0.40 | -9.07 |
| 263 | 0.48 0.01 | -1.06 0.01 | 17.29 0.02 | 17.67 0.05 | 1.38 0.01 | 20.37 0.02 | 4.23 0.04 | -9.82 |
| 283 | 0.64 0.01 | -0.17 0.02 | 18.90 0.03 | 16.43 0.11 | 3.29 0.05 | 21.01 0.05 | 1.96 0.09 | -7.73 |
| 305 | 1.16 0.06 | 0.11 0.02 | 20.09 0.06 | 17.80 0.15 | 1.72 0.04 | 20.98 0.09 | -0.61 0.13 | -9.23 |
| 316 | 1.11 0.07 | 0.28 0.03 | 19.92 0.08 | 16.73 0.21 | 2.70 0.08 | 20.88 0.12 | -0.48 0.17 | -8.05 |
| 324 | 0.34 0.01 | -1.43 0.01 | 17.92 0.02 | 16.93 0.07 | 5.72 0.05 | 22.71 0.03 | 8.64 0.06 | -7.84 |
| 326 | 0.70 0.04 | -0.36 0.06 | 18.56 0.11 | 17.38 0.36 | 1.62 0.08 | 20.42 0.17 | 1.42 0.28 | -9.19 |
| 329 | 0.81 0.02 | -0.25 0.02 | 19.94 0.04 | 18.69 0.12 | 1.44 0.02 | 21.48 0.06 | 0.72 0.10 | -9.93 |
| 413 | 1.07 0.08 | 0.02 0.04 | 19.94 0.10 | 17.96 0.28 | 1.59 0.06 | 20.96 0.16 | -0.36 0.24 | -9.41 |
| 447 | 0.47 0.01 | -1.00 0.01 | 16.66 0.01 | 16.61 0.03 | 1.76 0.01 | 19.83 0.01 | 4.47 0.03 | -8.98 |
| Id. | ||||||||
|---|---|---|---|---|---|---|---|---|
| (arcsec) | (mag/) | (mag) | (arcsec) | (mag/) | ||||
| 207 | 1.18 0.18 | 0.03 0.08 | 20.92 0.19 | 19.06 0.49 | 1.40 0.12 | 21.78 0.28 | -0.65 0.41 | -10.12 |
| 216 | 1.38 0.08 | 0.37 0.02 | 21.27 0.04 | 17.89 0.11 | 2.59 0.04 | 21.95 0.08 | -1.02 0.12 | -8.67 |
| 237 | 0.35 0.00 | -1.86 0.00 | 14.36 0.01 | 15.87 0.02 | 1.68 0.00 | 18.99 0.01 | 8.19 0.01 | -9.13 |
| 243 | 1.18 0.12 | 0.15 0.05 | 21.04 0.11 | 18.56 0.30 | 1.86 0.09 | 21.91 0.18 | -0.65 0.28 | -9.46 |
| 243 | 0.92 0.12 | -0.02 0.09 | 20.43 0.21 | 18.37 0.60 | 1.86 0.16 | 21.71 0.32 | 0.16 0.50 | -9.38 |
| 247 | 1.02 0.07 | 0.16 0.04 | 21.50 0.08 | 18.75 0.24 | 2.33 0.08 | 22.58 0.13 | -0.23 0.22 | -9.20 |
| 254 | 0.41 0.01 | -1.18 0.07 | 15.65 0.11 | 15.25 0.42 | 2.83 0.16 | 19.51 0.17 | 6.18 0.32 | -7.84 |
| 257 | 1.12 0.05 | 0.18 0.02 | 20.31 0.05 | 17.60 0.14 | 2.14 0.04 | 21.25 0.09 | -0.51 0.14 | -8.81 |
| 258 | 1.10 0.04 | 0.14 0.02 | 20.13 0.05 | 17.58 0.13 | 2.02 0.03 | 21.10 0.07 | -0.45 0.11 | -8.89 |
| 259 | 0.32 0.00 | -1.90 0.03 | 14.55 0.05 | 15.00 0.21 | 3.64 0.11 | 19.80 0.08 | 9.89 0.16 | -7.78 |
| 260 | 0.89 0.06 | -0.09 0.05 | 19.48 0.12 | 17.67 0.33 | 1.68 0.08 | 20.80 0.17 | 0.26 0.27 | -9.21 |
| 261 | 0.94 0.07 | -0.08 0.06 | 19.03 0.13 | 17.32 0.35 | 1.55 0.08 | 20.27 0.19 | 0.08 0.28 | -9.16 |
| 262 | 0.83 0.07 | -0.14 0.07 | 19.36 0.16 | 17.59 0.46 | 1.79 0.12 | 20.85 0.23 | 0.60 0.36 | -9.10 |
| 264 | 0.53 0.01 | -0.67 0.02 | 17.06 0.04 | 16.11 0.13 | 2.16 0.04 | 19.77 0.06 | 3.36 0.10 | -8.34 |
| 266 | 0.83 0.03 | -0.29 0.04 | 17.97 0.08 | 17.00 0.23 | 1.23 0.04 | 19.44 0.12 | 0.58 0.17 | -9.39 |
| 267 | 0.90 0.07 | -0.12 0.06 | 18.46 0.15 | 16.84 0.40 | 1.54 0.09 | 19.77 0.21 | 0.24 0.31 | -8.97 |
| 268 | 0.83 0.03 | -0.23 0.03 | 18.95 0.07 | 17.67 0.20 | 1.41 0.04 | 20.41 0.10 | 0.56 0.15 | -9.49 |
| 272 | 0.91 0.07 | 0.03 0.06 | 21.05 0.12 | 18.71 0.36 | 2.12 0.11 | 22.34 0.19 | 0.20 0.30 | -9.34 |
| 287 | 0.55 0.01 | -0.54 0.03 | 17.38 0.05 | 15.97 0.19 | 2.52 0.06 | 19.98 0.08 | 3.08 0.15 | -8.02 |
| 288 | 0.68 0.01 | -0.32 0.02 | 17.75 0.04 | 16.27 0.14 | 1.92 0.04 | 19.69 0.07 | 1.58 0.11 | -8.44 |
| 291 | 0.41 0.01 | -0.98 0.03 | 16.08 0.05 | 14.81 0.20 | 4.07 0.11 | 19.85 0.08 | 5.97 0.16 | -7.06 |
| 293 | 0.96 0.03 | 0.03 0.02 | 19.95 0.05 | 17.74 0.14 | 1.91 0.04 | 21.13 0.08 | -0.02 0.12 | -9.05 |
| 294 | 0.47 0.00 | -0.85 0.02 | 16.07 0.03 | 15.15 0.10 | 2.70 0.04 | 19.30 0.04 | 4.60 0.08 | -7.69 |
| 295 | 0.87 0.04 | -0.03 0.04 | 19.82 0.09 | 17.64 0.26 | 2.05 0.07 | 21.20 0.14 | 0.39 0.22 | -8.91 |
| 304 | 1.00 0.04 | 0.08 0.03 | 19.75 0.06 | 17.37 0.17 | 2.00 0.05 | 20.87 0.09 | -0.14 0.15 | -8.80 |
| 306 | 0.78 0.01 | -0.15 0.02 | 18.43 0.04 | 16.58 0.12 | 1.96 0.03 | 20.03 0.06 | 0.85 0.09 | -8.51 |
| 309 | 0.44 0.01 | -0.93 0.08 | 16.48 0.12 | 15.41 0.49 | 3.33 0.22 | 20.01 0.19 | 5.37 0.39 | -7.57 |
| 311 | 0.85 0.03 | 0.00 0.03 | 20.37 0.06 | 18.00 0.20 | 2.30 0.06 | 21.81 0.10 | 0.50 0.17 | -8.90 |
| 313 | 0.97 0.04 | 0.10 0.03 | 20.55 0.06 | 17.99 0.18 | 2.22 0.05 | 21.72 0.10 | -0.05 0.16 | -8.93 |
| 319 | 1.00 0.13 | -0.03 0.09 | 21.01 0.20 | 19.15 0.54 | 1.57 0.13 | 22.13 0.29 | -0.16 0.44 | -9.98 |
| 322 | 0.50 0.03 | -0.70 0.12 | 18.16 0.19 | 16.91 0.74 | 2.80 0.28 | 21.14 0.31 | 4.00 0.58 | -8.38 |
| 326 | 0.46 0.01 | -0.93 0.07 | 17.17 0.11 | 16.54 0.42 | 2.44 0.14 | 20.48 0.17 | 4.79 0.33 | -8.50 |
| 331 | 0.82 0.02 | -0.04 0.02 | 18.76 0.04 | 16.49 0.14 | 2.26 0.04 | 20.25 0.07 | 0.61 0.12 | -8.24 |
| 333 | 0.41 0.00 | -0.86 0.01 | 16.58 0.02 | 14.63 0.07 | 5.66 0.06 | 20.40 0.03 | 6.09 0.06 | -6.50 |