Mapping the CMB sky: THE BOOMERANG experiment
Abstract
We describe the BOOMERanG experiment, a stratospheric balloon telescope intended to measure the Cosmic Microwave Background anisotropy at angular scales between a few degrees and ten arcminutes. The experiment has been optimized for a long duration (7 to 14 days) flight circumnavigating Antarctica at the end of 1998. A test flight was performed on Aug.30, 1997 in Texas. The level of performance achieved in the test flight was satisfactory and compatible with the requirements for the long duration flight.
1 Introduction
The anisotropy of the CMB at angular scales between a few arcminutes and a few degrees is expected to provide invaluable information on the structure and evolution of our Universe (see e.g. Hu et al. 1996, 1998, Lineweaver et al. 1998, Tegmark 1998). Two major satellite experiments are planned, MAP in 2001 (NASA) and Planck Surveyor in 2006 (ESA), each with full sky and wide frequency coverage. For optimal design of these missions smaller experiments are required, which cover smaller sky areas with comparable sensitivity and similar observation strategy, using the critical technologies presently under development for satellite missions. Several balloon-borne experiments are currently being developed (see de Bernardis and Masi, 1998 for a review). Here we describe the BOOMERANG (Balloon Observations Of Millimetric Extragalactic Radiation ANisotropy and Geophysics) experiment, which was flown for the first time on Aug.30, 1997. The experiment is expected to measure the CMB anisotropy with unprecedented accuracy, probing the theory of evolution of structures in the Universe. In addition, it will test detector and scan technologies critical to Planck HFI. The system has an angular resolution of 12 arcmin FWHM and is a scanning telescope, making wide (up to 70o peak to peak) fast (2o/s) azimuth scans while the sky drifts, thus achieving significant sky coverage. It has been designed to be launched on a long duration balloon flight, circumnavigating the Antarctic continent in Dec.1998. The sky region opposed to the sun during the Antarctic summer is a dust-free zone, in the Horologium costellation. The diffuse dust emission in this region ranges between 0.2 and a few MJy/sr in the IRAS maps at 100 (Schlegel et al. 1997) with degree-scale gradients of the order of 0.1 MJy/sr. The brightness extrapolated at 150 GHz assuming a single temperature dust model (, ) is equivalent to temperature fluctuations of the CMB smaller than a few at 150 GHz, making this region a very appealing target for cosmological observations. The significant advantage of these antarctic balloon flights is the flight duration, which can exceed 10 days. Taking advantage of this, we can map a wide region (45 deg x 25 deg, corresponding to 30000 independent pixels at our resolution) with significant integration time per pixel (10 to 100 seconds) and deep repeated checks for systematic effects.
2 The Instrument
The BOOMERANG experiment is a millimeter wave telescope, with a bolometric receiver working in a long-duration cryostat at 0.3 K for 15 days. The instrument has been optimized for the peculiar requirements of Antarctic long duration ballooning (LDB). A diagram of the instrument is presented in fig.1.
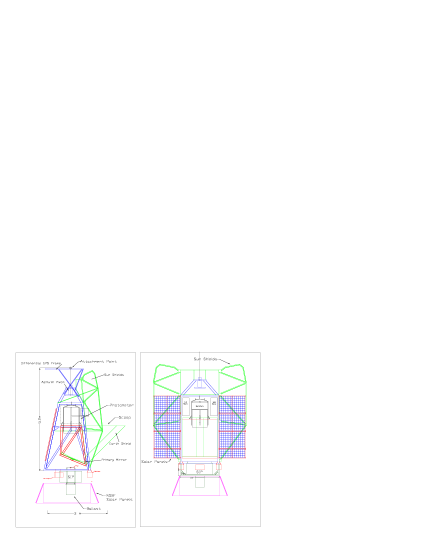
The primary mirror of the telescope (a 1.3 m diameter, 1.5 m focal length, off-axis paraboloid) is at ambient temperature. It is made out of 6061 aluminum, as is the entire telescope frame. At the focus of this telescope, the multiband receiver features beams ranging from 12 to 20 arcmin FWHM (depending on the channel and on the configuration). The telescope is protected by an earth shield and by two large sun shields (see fig.2), which allow operation of the system in the range from the anti-solar azimuth. Off axis radiation at 150 GHz is undetected at the -85dB level.
The secondary and tertiary mirrors are cooled to 2K inside the cryostat. Radiation enters the cryostat through a 50 thick polypropylene window, and goes through blocking filters at 77K and at 4.2K. The tertiary mirror is the cold Lyot stop of the instrument, sharply limiting the field of view of the photometers. Throat-to-throat concentrators with their entrance aperture placed in the telescope focal plane allow radiation to enter inside the RF-tight box containing the 3He refrigerator and the detectors. The detectors are based on parabolic and conical concentrators, metal mesh filters and Si3N4 spider web absorber bolometers. A photograph of the focal plane array for the Antarctic flight and of its ancillary hardware is shown in fig.3.
We have two different configurations for the focal plane. For the test flight we traded angular resolution for throughput in order to get significant sensitivity during the short flight from Texas (6 hours). The final configuration, used for the Antarctic flight, has higher angular resolution and improved detectors. The details are summarized in fig.4. The two configurations have been designed to allow several levels of signal confirmation and detector redundancy during the scan (see Masi et al. 1997 for details).

Low background bolometers are extremely sensitive to all forms of radiant energy. One big problem with standard bolometers is energy deposition from cosmic rays (CR) particles. Previous experiments carried out in temperate regions measured typical rates of an event every few seconds. The problem is enhanced in the polar stratosphere, where we expect a flux of cosmic rays about 6 times larger than in the temperate stratosphere. Bolometers with negligible cross sections for cosmic rays have been developed (Bock et al. 1995, Mauskopf et al. 1997) and tested in flight. The absorber is a thin web ( thickness) micromachined from Si3N4 and metalized. The grid constant is of the order of a few hundred microns, smaller than the in band wavelength so that photons are effectively absorbed while CR are not. Also the heat capacity of the bolometer is greatly reduced, and the mechanical resonant frequency is in kHz range. NEPs of the order of at 0.3K are achieved with time constants of the order of 10 ms for the 150GHz detectors. The other form of energy which contaminates signals from high sensitivity bolometers is radio frequency (RF) pickup, either through the optical path or through the readout circuit. This problem is very severe in the case of balloon borne payloads, which have powerful GHz telemetry transmitters on board. The BOOMERanG receiver has been carefully shielded: all the detectors work in a RF tight cavity. Millimeter-wave radiation enters the cavity through apertures much smaller than the RF wavelength (inside the throat to throat parabolic concentrators), and all the wires enter the cavity through cryogenic EMI filter feedthroughs. Similar care has been taken for the signal processing circuits.
The bolometers are differentially AC biased and read-out; the bolometer signals are demodulated by lock-ins synchronous with the bias voltages. A RC cut-off at a frequency (15 mHz) lower than the scan frequency was used to limit the dynamical range of the data and to remove 1/f noise from very low frequencies, unimportant for our measurements.
A long duration cryostat (Masi et al. 1998B) cooling the experimental insert to 2K, and a long duration fridge (Masi et al. 1998A), cooling the photometers to 280 mK, have been developed. The cryostat has a central 50 liter volume available for the 2K hardware, including blocking filters, secondary and tertiary mirrors, cryogenic preamplifiers, back to back concentrators, 3He fridge and photometers. The cryogens hold time exceeds 12 days under flight conditions.
The telescope and receiver hardware are mounted on a tiltable frame (the inner frame of the payload). The observed elevation can be selected by tilting the inner frame by means of a linear actuator. The outer frame of the payload is connected to the flight train through an azimuth pivot. The observed azimuth can be selected by rotating the full gondola around the pivot, by means of two torque motors. The first actuates a flywheel, while the second torques directly against the flight train. An oil damper fights against pendulations induced by stratospheric wind shear or other perturbations. The sensors for attitude control are different for night-time flights (like the test flight in 1997) than day-time flights (like the Antarctic flight in 1998). For the night-time flight in Texas we had a set of 3 vibrating gyroscopes and a flux-gate magnetometer in the feedback loop driving the sky scan. A CCD camera with real-time star position measurement provides attitude reconstruction to 1 arcmin. For the day-time flight in Antarctica we have a coarse and a fine sun sensor, a differential GPS, and a set of 3 laser gyroscopes. Again, we expect to be able to reconstruct the attitude better than 1 arcmin.
3 Observations
The system was flown for 6 hours on Aug 30, 1997, from the National Scientific Balloon Facility in Palestine, Texas. All the subsystems performed well during the flight: the He vent valve was opened at float and was closed at termination, the Nitrogen bath was pressurized to 1000 mbar, the 3He fridge temperature (290mK) drifted with the 4He temperature by less than 6mK during the flight. Pendulations were not generated during CMB scans, at a level greater than 0.5 arcmin, and both azimuth scans at 2o/s and full azimuth rotations (at 2 and 3 rpm) of the payload were performed effectively. The loading on the bolometers was as expected, and the bolometers were effectively CR immune, with white noise ranging between 200 and 300 . During the flight, the system observed Jupiter to measure the beam pattern and responsivity. In fig.5 we plot an example of signal from scans on Jupiter.

We also performed 360o azimuth spins of the payload, to measure the Dipole anisotropy of the CMB for an independent estimate of the responsivity. In fig.6 we plot an example of real-time data during the spin, showing the CMB dipole signature.

A strip of sky at high galactic latitudes ( 4 deg high in declination, 6 hours wide in RA) in the constellations of Sagittarius, Capricornus, Aquarius and Sculptor, was scanned in search for CMB anisotropies. The gondola performed 40o peak to peak azimuth scans, centerd on the south, with 50 s period, for 5 hours.
4 Analysis
The first step in telescope attitude reconstruction was the measurement of the offset between the microwave telescope beams and the CCD camera during Jupiter observations. Second, we used the data from the magnetometer and the elevation encoder as a zero order solution for the attitude, and found precise solutions for the pointing using the star positions measured by the CCD camera, and interpolationg between solutions using the gyroscope data. The temporal transfer function of all the channels was measured using Cosmic Rays Pulses (a total of 60 in 6 hours in the NA-B150B2 channel) and fast scans on Jupiter during the dipole rotations. The raw data were deconvolved for the temporal transfer function and deglithced. Time ordered data were spectrally analyzed searching for bias aliases and interference lines. Data sections contaminated were FT filtered to remove the lines. Data sectors contaminated by obvious spurious effects were removed (cosmic rays hits, calibration lamp spikes, microphonic events from nitrogen valve, Radar Hits, Jupiter scans). The resulting ”clean” time ordered data set is mainly noise, and is stationary: the rms changes less than 2 from hour to hour.
The photometer responsivities were measured using the scans on Jupiter and the spectral response measured before the flight by means of a fourier transform interferometer. Data were filtered through a flat-phase numeric filter to reduce white noise. Simulations were made to select the best parameters for the filter. Filtered data were binned on a grid centered on the optical position of Jupiter. The beam pattern, and FWHM were computed from the binned data (see table 1). The signal was estimated making fits to the scan data. The responsivity was derived using the measured quantitites and the spectral response measured pre-flight.
| channel | FWHM | |
|---|---|---|
| NA-B150A1 | ||
| NA-B150B1 | ||
| NA-B150B2 | ||
| NA-B150B2 | ||
| NA-B90A | ||
| NA-B90B |
An independent measurement of the photometer’s responsivity was done using the dipole signal, which has the same spectrum as smaller scale CMB anisotropies and is well known. On our scans (obtained spinning the gondola at 2 and 3 rpm) the expected dipole signal is between 2 mK and 4 mK peak to peak. We do see a dipole like signal both at 90 GHz and at 150 GHz. Atmospheric effects cannot produce the observed signal. Repeating the measurements four times at 1 hour intervals, we check that the observed dipole rotates with the sky, and has the expected pattern. From the amplitude of the observed signal we get a responsivity independent on the spectral response of the instrument. The responsivities measured at the same time during the flight with the two independent methods are consistent within the error bars () at one . An internal stimulator lamp, placed in the Lyot stop of the optical system and flashing every 15 minutes, is used to transfer the calibration to the subsequent parts of the flight.
The CMB data analysis is in progress, along two parallel paths. In the first one the data are binned in synthesized patterns as in Netterfield et al. (1996). The corresponding window functions are computed, and a likelihood analysis of the binned data is performed. Band-power estimates for the -s are computed. In the second approach, a map is created from the data (see e.g. Janssenet al. 1996, Wright 1996, Smoot 1997, Tegmark 1997). The BOOMERanG test flight data produce a 26000 pixels map ( pixels). The map is big, as a result of the only scan strategy compatible with our late flight (Aug.30). At the pixel level, the map is dominated by noise. The spherical harmonics analysis of the map is a significant computational problem, and is in progress. The analysis is done for all the channels and for the dark channel, in order to make correlation analysis and spectral checks. Both the data analysis processes are being iterated with different data selection rules, deconvolution parameters, noise estimates to check for systematic effects.
The observed region contains slightly dusty sections and very foreground-clean sections. Both are interesting. Cross correlations of the BOOMERanG map with the DIRBE/IRAS dust maps by Schlegel et al. (1997) will provide important insight on the topic of mm-wave emission of interstellar dust.
A careful analysis of the possible systematic effects is still in progress. At present we can say only that anisotropy is evident in the measured data, and is measured with good signal to noise ratio in the range .
5 Conclusions
The BOOMERanG experiment has been successfully flown from Texas in a short (6 hours) test flight. The flight has proven satisfactory performance of the instrument and significant science data. A 26000 pixel map, the largest ever produced in CMB experiments, has been produced at 90 GHz and 150 GHz. The data analysis is in progress. The payload has been upgraded with a 16 detectors focal plane, and the addition of the hardware necessary for a long duration flight (solar panels for power supply and satellite communications). The system is presently in Antarctica to be launched by NSBF for the first long duration flight.
6 Acknowledgments
The BOOMERanG experiment has been funded by Universita’ di Roma La Sapienza, Agenzia Spaziale Italiana (ASI) and Programma Nazionale di Ricerche in Antartide (PNRA) in Italy, NASA and Center for Particle Astrophysics in USA, PPARC in UK. PdB acknoledges support from the Consorzio Internazionale di Fisica Spaziale during his stay at the International School of Space Physics.
References
- [1] Tegmark M., 1998, astro-ph 9809201
- [2] Hu W., Eisenstein D.J., Tegmark M., White M., astro-ph 9806362
- [3] Hu W., Sugiyama N., Silk J., Nature 386 (1997) 37-43
- [4] Lineweaver C.H. 1998, astro-ph 9805326
- [5] P. de Bernardis P., Masi S., 1998, astroph/9804138
- [6] D.J. Schlegel, D.P. Finkbeiner, M. Davis, ApJ, 500, 525, 20
- [7] Bock J., Chen P., Mauskopf P., Lange A., A novel bolometer for infrared and millimeter-wave astrophysics, Space Sci. Rev., 74, 229-235, 1995
- [8] Masi et al. proceedings of the workshop Topological Defects in Cosmology, Rome, 1996, M. Signore and F. Melchiorri editors (World Scientific)
- [9] S. Masi, E. Aquilini, P. Cardoni, P. de Bernardis, L. Martinis, F. Scaramuzzi, D. Sforna, Cryogenics, 38, 319-324, 1998A
- [10] S. Masi, P. Cardoni, P. de Bernardis, F. Piacentini, A. Raccanelli, F. Scaramuzzi, ”A long duration cryostat suitable for balloon borne photometry” 1998B, submitted to Cryogenics
- [11] Mauskopf P., et al., Composite infrared bolometers with micromesh absorbers, Applied Optics, 36, 765-771, 1997.
- [12] Netterfield C.B., Ap.J. 474, 47, 1997
- [13] Janssen et al. Astro-ph 9602009
- [14] Wright N., IAS CMB Data Analysis Workshop in Princeton, 22 Nov 96, Astro-ph 9612006
- [15] Smoot G., astro-ph 9704193
- [16] Tegmark M., 9711076