An X-ray Mini-survey of Nearby Edge-on Starburst Galaxies
II.
The Question of Metal Abundance
Abstract
We have undertaken an X-ray survey of a far-infrared flux limited sample of seven nearby edge-on starburst galaxies. The data are presented in paper 1 of this series by Dahlem, Weaver, & Heckman. Here, we examine the two X-ray-brightest sample members NGC 253 and M 82 in a self-consistent manner, taking account of the spatial distribution of the X-ray emission in choosing our spectral models. Both galaxies require at least three components to model the 0.1 to 10.0 keV spectrum, but the modeling is by no means unique. There is significant X-ray absorption in the disk of NGC 253. When this is accounted for in spectral fits to the emission between and 2.0 keV, we find that multi-temperature thermal plasma models with significant underlying soft X-ray absorption are more consistent with the imaging data than single-temperature models with highly subsolar abundances or models with minimal absorption and non-equilibrium thermal ionization conditions, as have been proposed by others. Our three-component models do not require absolute abundances that are inconsistent with solar values or unusually supersolar ratios of the -burning elements with respect to Fe (as claimed previously). We conclude that with current data, the technique of measuring abundances in starburst galaxies via X-ray spectral modeling is highly uncertain. Much improved spatial/spectral resolution and increased sensitivity are required.
Based on the point-like nature of much of the X-ray emission in the PSPC hard-band image of NGC 253, we suggest that a significant fraction of the “extended” X-ray emission in the keV band seen along the disk of the galaxy with ASCA and BeppoSAX (Cappi et al.) is comprised of discrete sources in the disk, as opposed to purely diffuse, hot gas. If a significant amount of the hard X-ray emission were due to unresolved point sources with weak Fe K emission (e.g., X-ray binaries), this could explain the low Fe abundances of solar derived by Cappi et al. for pure thermal models.
keywords:
galaxies: individual (NGC 253; NGC 3034 = M 82) — galaxies: starburst — galaxies: intergalactic medium — galaxies: evolution — X-rays: galaxiesK. Weaver et al. \rightheadX-ray properties of NGC 253 and M 82
and and
1 Introduction
NGC 253 and M 82 are the best-studied starburst galaxies in the X-ray band. Their intricate nature has been revealed in observations with Rosat and Einstein. M 82 has a complex, central star-forming region that contains unresolved point sources, diffuse disk emission, and an X-ray “cone” pointed along the minor axis of the galaxy that is consistent with the outflow of gas in a partly confined jet (Bregman, Schulman, & Tomisaka 1995; Watson, Stanger & Griffiths 1984). NGC 253 has distinct components within its central region (Fabbiano & Trinchieri 1984) in the form of point sources in the disk, diffuse disk emission, unresolved nuclear emission, and an extension to the south of the nucleus associated with an outflow, visible e.g., in H emission (Watson, Stanger, & Griffiths 1984). Both M 82 and NGC 253 possess X-ray emission that extends to outside the plane of the galaxy (Schaaf et al. 1989; Fabbiano 1982) with properties consistent with a starburst-driven outflow (Dahlem, Weaver, and Heckman 1998; hereafter paper 1).
The marked complexity of these objects has resulted in contradictory results from instruments that cover different bandpasses and different spatial regions. For example, while the hard X-ray detectors onboard EXOSAT and Ginga measured thermal temperatures of k 6 to 9 keV (Ohashi et al. 1990, Schaaf et al. 1989), soft X-ray detectors such as Einstein, measured significantly lower temperatures (Fabbiano 1982). Recent experiments with a more complete energy coverage have at least partly resolved this duality. Observations with the Broad Band X-ray Telescope, the Advanced Satellite for Cosmology and Astrophysics (ASCA), and BeppoSAX show that multiple spectral components are necessary to model the data between 0.5 and 10 keV (Petre 1993, Ptak et al. 1997 [hereafter P97], Moran & Lehnert 1996 [hereafter ML96], Tsuru et al. 1997 [hereafter T97]). What is not yet clear is whether all of these components are required to be thermal in nature (Ohashi et al. 1990, P97, Cappi et al. 1999 [hereafter C99]).
A clear understanding of the X-ray properties of starburst galaxies requires observations with a large energy coverage and good spatial resolution. The best such dataset currently available is contained in the Rosat and ASCA archives. M 82 and NGC 253 have been the subject of at least six recent papers that focus on the archival data (ML96, P97, T97, Strickland et al. 1997, Vogler and Pietsch 1998 [hereafter VP98], paper 1). Results at higher energies are also becoming known from BeppoSAX (C99). Based on the innate complexity of M 82 and NGC 253, it is not surprising that the interpretations of these data by various authors differ. ML96 find a complex absorption structure in the core of M 82 and spectral data consistent with solar abundance ratios. On the other hand, P97 and T97 find subsolar abundances as well as an overabundance of the -burning elements (Mg, Si, S, Ne) with respect to Fe, which suggests that Type II supernova remnants dominate the chemical enrichment of the X-ray emitting plasma. Since superwinds provide a method for enriching the interstellar medium (ISM), these results have far-reaching implications for studies of supernova rates and outflow models of the enrichment of the ISM. It is thus critical to establish how reliable the current results are.
2 The Scope of This Investigation
The purpose of this paper, which is part of a larger study of a sample of seven edge-on starburst galaxies (paper 1), is to thoroughly examine the available X-ray data of NGC 253 and M 82 with the goal of finding a self-consistent spatial and spectral model description of the observed X-ray emission between 0.1 and 10 keV. Combining the ASCA and Rosat datasets is a powerful spectroscopy tool, because all emission components can be modeled at one time. The Rosat spectra, after excision of point sources, are best-suited to determine the spectral properties of the K gas emitting the softest X-rays, while the hard X-ray ( keV) components inferred from these spectra are subsequently constrained based on the ASCA fits. This paper addresses a very fundamental problem, namely the determination of the appropriate composite spectral model for starburst galaxies, despite, as we will show, an ambiguity in the minimum space. Once the most likely physical models are determined, similar models can be applied to starburst galaxies with poorer quality data (for example, fainter galaxies or those at high redshift).
3 Spectral Analysis
3.1 A Note on the Spectral Modeling
There is strong evidence that most of the soft X-ray emission in NGC 253 and M 82 arises from thermal processes. To model the soft X-ray emission ( keV) we consider Raymond-Smith plasma models (RS; Raymond & Smith 1991) and Mewe-Kaastra plasma models with Fe L calculations by Liedahl (MEKAL; Mewe, Gronenschild & van den Oord [1985], Mewe, Lemen & van den Oord [1986], Kaastra [1992]). Typical thermal temperatures might be similar to those found for diffuse gas in normal galaxies, which fall near a few tenths of a keV. The X-ray spectrum from such a plasma is rich in line emission near 1 keV (Figure 1). Current data are inconclusive as to whether the hard X-ray emission is of thermal origin (Ohashi et al. 1990, P97, T97, but see C99). The ASCA data are not particularly sensitive to the Fe K line emission expected for a thermal plasma (P97), and so for simplicity, we adopt bremsstrahlung or power law models to describe the 2–10 keV continuum.
Our results are tabulated in Tables 1 – 8. Each fit is assigned one or a combination of the following codes for the model used, together with the number of the fit if more than one fit is listed. The models consist of:
-
•
“P” – a power law,
-
•
“B” – a thermal Bremsstrahlung spectrum,
-
•
“M” – a MEKAL plasma model,
-
•
“R” – a RS plasma model.
All models include absorption due to our Galaxy and additional absorption where necessary.
3.2 The Definition of Different Emission Components
Our imaging analysis and techniques for spectral extraction are discussed in paper 1. The emission components within each galaxy are spatially identified in the Rosat HRI and PSPC images as follows:
-
1.
NGC 253:
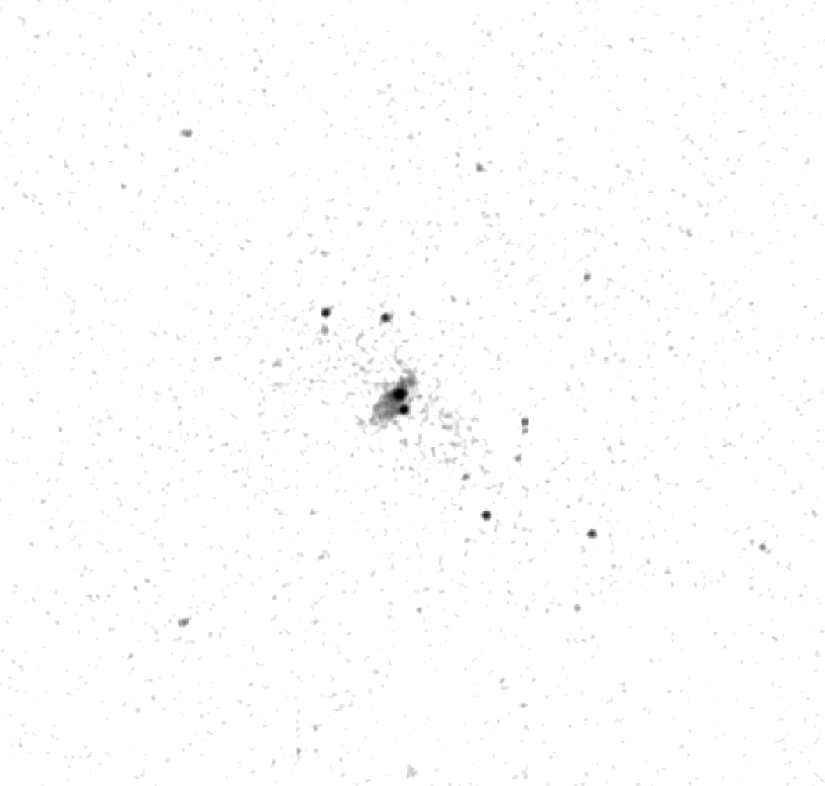
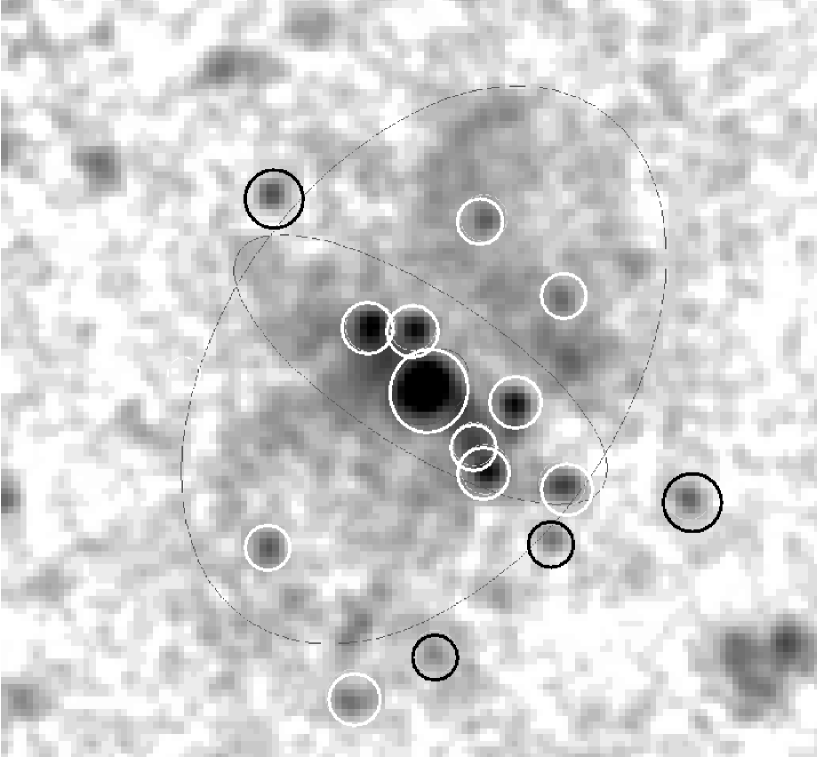
At a limiting flux level of ergs cm-2 s-1, we identify eighteen point sources in the HRI image (Figure 2) within a radius of the galaxy core. Based on the smoothed and point-source-subtracted PSPC images (paper 1), we divide the galaxy into “halo”, “disk”, and “core” regions (Figure 3). To examine the band of absorption apparent in the 0.25 keV PSPC image (paper 1, Figure 12), we also divide the elliptical region that delineates the disk equally into northern and southern regions (each 1/2 of the NE-SW ellipse in Figure 3). Compact sources are excised and classified as “hard” or “soft” by comparing counts in the 0.25, 0.75, and 1.5 keV bands. Their spectra are then co-added111The hard compact sources are NGC 253:DWH 1, 2, 4, 6, 9, 12, 13, 14, and 15 in the PSPC image; the soft sources are NGC 253:DWH 3, 16, and 17 (paper 1). (§ 4.1).
ASCA observed NGC 253 with the SIS operating in 4-CCD mode, which provides a field of view. NGC 253 is approximately in size and so the galaxy is contained almost entirely on two of the four SIS chips, with only about 15% of the halo flux lost off the edges of the chips. For our joint PSPC and ASCA analysis, spectra are extracted from rectangular regions in the SIS and 15′ diameter circular regions in the GIS. This technique includes as much of the halo flux as possible. For a direct comparison of our ASCA results with those of P97 (§ 4.2), we alternatively use circular regions identical to theirs (10′ in diameter). SIS background is accumulated from the non-source chips.
-
2.
M 82:
Based on the Rosat images, we divide the galaxy into halo and core regions. Of the 17 point-like sources identified in the PSPC image (paper 1, Figure 13), none are located within the galaxy. These sources are sorted by hardness ratio and co-added as above for spectral fits222The soft compact sources are M 82:DWH 1, 2, 8, 9, 10 and 15; all others have hard spectra (paper 1)..
4 Spectroscopic Results for NGC 253
4.1 Modeling the PSPC Spectra
From our PSPC imaging analysis (paper 1), we label the predominant spatial/spectral sources as (1) the diffuse gaseous halo, which we identify from the images with emission at low X-ray energies (0.25 keV band), (2) the galaxy disk, which we identify from the images primarily with emission at medium X-ray energies (0.75 keV band), and point sources (including the core), which we identify from the images with emission at high X-ray energies (1.5 keV band).
-
1.
The Diffuse Halo Emission:
To describe the halo emission we examine one- and two-temperature thermal models. The simplest case is a single-temperature MEKAL plasma model with Galactic absorption ( = 0.91020 cm-2) and solar abundances. Such a model provides a very poor fit to the data ( for 28 d.o.f., model M1, Table 1). When the abundance is a free parameter, the fit improves dramatically ( = 20.1 for 27 d.o.f., model M2), but the implied abundance of is extremely low. We cannot be sure that this model provides a correct physical description of the data. Indeed, when we consider the ASCA data, our fits suggest generally higher abundances for thermal models. Given the limited bandpass and poor energy resolution of the PSPC, it is possible that continuum flux from a warmer gas can contribute to mimic abundances that are less than predicted in the cooler gas.
When the data are fitted with a two-component thermal plasma model, the abundances can be as large as solar but with a fairly large uncertainty. If we assume an abundance of (Table 1, model MM) then k keV and k = 0.610.36 keV (=19.6 for 26 d.o.f.). The observed and absorption-corrected keV fluxes for this case are 1.24 and ergs cm-2 s-1, respectively, with relative contributions of 40% and 60% from the cool and warm components. This ratio is consistent with the ratio of extended halo emission in the 0.25 keV and 0.75 keV PSPC maps (paper 1), and so we are confident that our two-component model is appropriate even though there is a large uncertainty on the abundance.
-
2.
The Diffuse Disk Emission:
For the disk emission, a power-law (model P) or a MEKAL plasma (model M) provide reasonable fits.333When dealing with the inner regions of the galaxy, the choice of background is important. Poorer fits result when field background is subtracted, and even though we do not know the geometry of the system or how much of the diffuse halo emission is projected onto the disk a priori, the fits using local background are more reasonable and better match the imaging data. Thus we rely on the latter method. The large photon index of =3.68 for model P (a steep spectrum) implies a significant thermal plasma contribution, but model M again implies an unusually low abundance of = 0.003 . As for the halo fits, we argue that such a low apparent abundance can result from a model that is too simple. To find a more physically reasonable description of the data we examine more complex models choosing a priori values of = 1.0 and = 0.5 for the abundance. Both are consistent with the data.
For solar and one-half solar abundances, the data are well described with a model that consists of a power-law and MEKAL component (Model PM1, Table 1). For this model the best-fitting power-law index is ; however when the ASCA data are taken into consideration, if were really this small it would seriously overpredict the flux above 2 keV when extrapolated to higher energies (§ 4.2). Also, if the “flat” hard component were thermal, the required temperature would be much too high and also inconsistent with the ASCA data. Alternatively, we suggest that the small index is an artifact of the effect of absorption on an intrinsically steeper hard X-ray component. If we allow for some additional absorption and fix at the best-fitting ASCA value of 1.9 (Model PM2, Table 1), we derive a column density of cm-2. This model is more reasonable than the model with the unusually small power-law index and it is also consistent with the images since we see the absorption band due to the galaxy disk cutting in at around 0.7 keV.
To confirm the significant absorption in the galaxy disk we examine the northern disk (ND) and southern disk (SD) separately. Both spectra are plotted in Figure 4. Subtracting field background, the spectra have a similar shape even though there is a clear band of absorption in the image, which confirms our suspicion that diffuse halo emission is projected onto the band of underlying absorption in the disk. When the local (diffuse) background is subtracted (ND) is 2 to 3 times (SD), which is more in line with the image. Depending on the choice of models (power law or MEKAL), the intrinsic absorption for the hard component, i.e., due to the disk, can be as large as cm-2.
-
3.
The Core Emission:
Single-component power-law or MEKAL models provide poor fits to the core spectrum (models P and M, Table 1). On the other hand, a two-component MEKAL plasma ( ) plus power-law model provides an excellent fit with / = 27.6/24 (Table 1, model PM1). In this case, (PSPC) is smaller than (ASCA), a result similar to the hard model component of the disk emission. The small index again implies significant absorption. Fixing at the ASCA value of 1.9 (model PM2) yields = 5 cm-2. Constraining the hard component in this way also causes the fitted temperature of the thermal component in the PSPC to be equal to the temperature derived from ASCA. This provides a nice consistency check and allows us to identify the soft component in the core spectrum with the warm ASCA thermal component (P97). If the hard component is more absorbed than the thermal component (model PM3, our best fit), then (core) can be as high as 4 to cm-2. This confirms the amount of absorption intrinsic to the galaxy disk and is consistent with that inferred by VP98.
-
4.
Compact Sources:
The compact sources in NGC 253 are discussed at length by VP98, who perform a sensitive search for point sources in the disk, resulting in 27 detections in the HRI image. We do not perform a similarly detailed analysis because our intent is only to identify the major point-source contributions in the PSPC data (Fig. 3 and paper 1). Our integrated PSPC point-source luminosity is ergs s-1, which is comparable to that of VP98, so we are confident that we have identified the majority of the flux from the point sources. Anything else is not important for our investigation.
The “hard” X-ray point sources can be modeled with a power law having (model P, Table 1) or a bremsstrahlung spectrum with kT (model B). The index of the power law is similar to (ASCA) for the hard component and implies that the Rosat-identified point sources comprise a significant portion of the hard X-ray portion of the ASCA spectrum. Our result suggests that much of the hard X-ray emission is truly point-like, in contrast to the claim of C99 that the keV emission is primarily from hot, diffuse gas in the galaxy disk. From extrapolation, the compact sources, including the core, provide of the total keV emission seen with ASCA and so must make up a significant fraction of the keV “extent” seen with BeppoSAX (C99).
The “soft” X-ray sources that are point-like in the HRI and the PSPC are located exclusively in the halo and have spectral characteristics resembling the diffuse gas (Table 1). This suggests that the point-like regions in the halo are not distinct compact sources but might be areas of locally enhanced halo emission, as also suggested by VP98. For the same two-temperature plasma model applied to the halo emission (model MM), the cool and warm components contribute about 40% and 60% of the flux, respectively, similar to the ratio of these components in the halo.
We conclude from our analysis of the spatially-resolved PSPC spectra that there is significant absorption within the galaxy disk of NGC 253 on the order of 1 to a few cm-2 (in agreement with VP98). We find the PSPC point sources to be a significant source of X-rays at 2 keV and they are likely to contribute of the total flux in the keV band, i.e., in the ASCA and BeppoSAX spectra and the BeppoSAX image reported by C99.
4.2 Comparing PSPC and ASCA Spectral Modeling
Here we discuss the method of spatial-spectral iteration by which we derived a self-consistent modeling of the ASCA and PSPC spectra. In the above analysis, we used simple models to fit the spatially resolved PSPC spectra in our attempt to infer the spatial origins of the ASCA emission. The basic assumption is that if a PSPC spatial component is mostly hard or mostly soft, then this region can be associated with the corresponding hard or soft component in the ASCA spectrum. Conversely, if we do not find a PSPC spatial/spectral component that “matches” one of the ASCA spectral components, then we know that at least one of our model assumptions is wrong.
The ASCA spectrum clearly contains strong line emission from O, Ne, Fe, Mg, Si, S, and Ar (P97 and others). The integral spectrum can be well fitted with the sum of an absorbed hard X-ray component (power law or bremsstrahlung) and one or more thermal plasma components. But this is not necessarily the correct model. The data are ambiguous in that the amount of absorption for the various components and the abundance of the gas can differ by orders of magnitude depending on the input assumptions.
Figure 5 is a guide to show which component of the X-ray emission, hard or soft, dominates the spatial components in the PSPC and hence which ASCA and PSPC models yield consistent results. Since our goal is to match up ASCA and the PSPC, we choose the two most significant ASCA components from P97 and compare their spectral parameters with the PSPC. Figure 5a shows vs. for the power-law (hard X-ray) ASCA component compared with the power-law results for the spatially-resolved PSPC spectra. All PSPC points are derived for a single power-law model except for core(2), which represents the photon index for the best-fitting two-component core model (model PM3, Table 1). The hard X-ray point sources and the hard component in the PSPC core clearly have the spectra that are most similar to ASCA. This consistency provides independent support for our complex modeling of the core spectrum.
Figure 5b shows k vs. for a MEKAL fit to the ASCA soft component (P97) and single-component MEKAL fits to the PSPC, except for core(2) as above. The disk emission with k keV most closely corresponds to the soft ASCA thermal component found by P97; however, in this case, no spatially resolved PSPC component has exactly the same model parameters. In fact, much of the spatially resolved emission has a significantly lower temperature than measured with ASCA. These results strongly imply a three-component modeling of the PSPC and ASCA data, including a very soft thermal component that contributes in the ASCA band. For comparison we also plot the single-component model result for the integral PSPC spectrum, which illustrates the incorrect results we might infer if the data had poor enough statistics that a single-component model were statistically acceptable.
4.3 Modeling the ASCA Spectrum
We compare our results for two- and three-component models for ASCA in Table 2. To account for systematic differences between our fitting techniques and those of P97, we have re-extracted the ASCA spectrum using their region sizes. The abundances of individual elements are not well determined so we follow P97 and group the plasma abundances as follows: Ne and Fe (hereafter ), O, Mg, Si, and S (hereafter ), and N, Ar, Ca, and Ni (hereafter ). In reality, Ne should be tied to S, Si, and Mg, based on the physics of production in Type II supernovae; however, the fact that the Ne emission is blended with Fe L (Figure 1), combined with the poor energy resolution of the detectors, forces us to tie this parameter to Fe. This leaves 13 free parameters for the ASCA fits, which are the normalization of the cool component444We do not measure multiple abundances for the cool component because the line emission for the 0.2 keV plasma is dominated by Ne and Fe L and the lines at higher energies are swamped by the emission from the warmer gas., the temperature (k(w)), normalization, , , , and the absorbing column ((w)) of the warm component, the index (or temperature), normalization, and absorbing column ((h)) of the hard (or “hot”) component, and the relative normalizations of the instruments. The Galactic foreground column density of 0.91020 cm-2 is included in all cases. Based on joint PSPC and ASCA fits (§ 4.4) we choose , = 1.0 and fix the temperature and abundance of the cool gas at k(c) = 0.2 keV and , respectively.
We derive results similar to P97 for a two-component model (models PM or BM in Table 2) but find equally good or better fits for a three-component model (models PMM or BMM). We conclude that the three-component and two-component models are statistically equivalent (the intrinsic uncertainty in results from the choice of plasma models) and ambiguous. But when we account for the low-temperature component in the PSPC, the three-component model is much more consistent with the imaging data. The three-component model not only allows the metal abundances of the warm component to be (which is physically more meaningful for a galaxy with a very high star formation rate, cf. Zaritsky, Kennicutt and Huchra 1994), it also allows (h) to be smaller and more consistent with inferred from PSPC fits. Our best-fitting ASCA model (PMM, Table 2) is shown in Figure 6.
4.4 Joint Spectral Modeling
Having demonstrated the large uncertainty in deriving absolute abundances for thermal models, we fix at values of 0.5 or 1.0 for the joint ASCA and PSPC fits. With = 0.5 (Table 3), the best fit is obtained with two-temperature MEKAL plasma plus a power law ( = 538.5 for 499 d.o.f., model PMM1). For this model we derive = 0.8 and = 0.4. However, space is shallow in the region near due to , , (h), and (m) being strongly coupled. After thorough testing of the allowed parameter space, we conclude that there is no need for the Fe abundances to be less than solar. The joint data and best-fitting two-temperature MEKAL plasma plus power law model with = 0.5 are shown in Figure 7 (model PMM2).
In general, , k(c), k(w), and k(h) are well determined for the joint fits, while there are large uncertainties in (w), (h) and . tends to be larger than , but there are cases where the two are consistent to within the statistical errors.
The mean value for (w) is 5.81 1021 cm-2 and the mean value for (h) is 6.72 1021 cm-2. Both are consistent with (core) inferred from the PSPC, but this is slightly larger than we might expect for (w). If we add a third MEKAL plasma component with k = 0.14 keV to match the softest emission in the PSPC, then (w) can be lower and more consistent with the PSPC data. This also allows the abundance in the halo to be higher than 0.2 . An alternative explanation of an effectively large (w) is a more complex absorption structure. If the hard X-ray component is modeled as being partially covered, about 30% of the hard X-ray flux could be unabsorbed or absorbed by a very low column [model (PMM)pc, Table 3]. In other words, if some of the hard X-rays are passing through a patchy absorber, then it would add flux at low energies, another reason why we might measure low abundances below 1 keV for purely thermal models for the soft emission.
An independent estimate of (h) and (w) arises from comparing the PSPC and ASCA fluxes. The mean fluxes for the joint model, in units erg s-1 cm-2, are f(c) = 2.88 , f(w) = 1.03 , and f(h) = 1.13 . We can compare these with the PSPC fluxes of f(c) = , f(w) = 1.72 , and f(h) = 1.91 erg s-1 cm-2. The column density that produces the best agreement between the fluxes of the hard and warm components is 4 to 5 cm-2, which is reasonable for a highly-inclined spiral galaxy disk.
4.5 Summary
Our conclusions for NGC 253 are:
(1) There is a large amount of intrinsic absorption in the disk of the galaxy ( cm-2). This absorption complicates spectral fits.
(2) The abundance measurements from ASCA and PSPC spectra are highly uncertain but are statistically consistent with solar values. Also, the -burning elements are not required to be unusually overabundant relative to Fe.
(3) A three-component model that consists of a power law and two MEKAL plasma components with solar or near solar abundances provides a fit as good or better than a two-component model consisting of a power law and a MEKAL plasma having unusual abundances. To maintain consistency with spatially-resolved emission, the first alternative is allowed by the Rosat data; the second is not.
(4) Extrapolating the PSPC results into the ASCA band allows us to infer which spatial components dominate the ASCA spectrum. The compact sources, including the core, provide of the total keV emission seen with ASCA and so must make up a significant fraction of the keV “extent” seen with BeppoSAX (C99) when the telescope point-spread function is accounted for.
Comparing our results with those by C99 it is important to realize that our three-component model is a composition based on emission models describing X-ray emitting objects known to exist in virtually all spiral galaxies. While C99 invoke the presence of an additional, extremely hot thermal component, they neglect all potential continuum emission in the keV band from XRBs. However, there is no reason to believe that NGC 253, with its massive starburst, should not host any X-ray emitting massive binaries. On the other hand, XRBs can account for the observed thermal Fe K line emission.
5 Spectroscopic Results for M 82
5.1 Modeling the PSPC Spectra
-
1.
The Diffuse Halo Gas:
Power law or single-temperature thermal plasma models are statistically ruled out for the halo emission in M 82 (models P and M, Table 5). Assuming solar abundances, the halo emission is best described with a two-temperature model having k keV and k keV, resulting in = 14.3 for 25 d.o.f. (model MM, Table 5). As in the case of NGC 253, we cannot rule out a power law as the harder of the two components instead of a thermal plasma, although the thermal description is somewhat preferred from the ASCA result (§ 5.2).
-
2.
The Core Spectrum:
Two model components are required to fit the core spectrum. If these are a power law and a MEKAL plasma (model PM1), then the hard component prefers to be much flatter than measured with ASCA (similar to NGC 253). This could result from significant unresolved line emission above 1 keV (Si) or from a heavily absorbed component. When the hard component is constrained to have the same photon index as the ASCA hard component (model PM2, identical to the technique we used for NGC 253), the inferred thermal temperature in the core approaches that in the halo. In this case, the hard component requires absorption in excess of the Galactic value.
-
3.
The Compact Sources:
Most of the point-like sources near M 82 do not appear to be associated with the galaxy since they fall outside the plane of the galaxy. However, the very soft sources to the north have properties similar to the hot halo gas in M 82 and they may, in fact, be associated with the outflow (Lehnert, Heckman and Weaver 1999). See paper 1 for further discussion of the point sources.
5.2 Modeling the ASCA Spectrum
ASCA results for M 82 have been published by P97, T97, and ML96. All are of comparable statistical quality, but we propose that the spatial information from the PSPC can be used to tell which are physically meaningful.
Similar to NGC 253, we performed a detailed investigation of the ASCA spectrum using a two-component “baseline” model to determine (min) and comparing this with the three-component model. Since the statistics are good enough, we also use both Raymond-Smith and MEKAL plasma models to see how well the data can distinguish between the two. For a model that consists of a thermal plasma with solar abundances and a power law, all fits are poor with values ranging from 1.44 to 1.48 (Table 6, models PRs and PMs). We next allow the abundances of individual elements to vary, although keeping N and Na at their solar values because of their large uncertainty. In this case, the fits improve dramatically (models PRv, PMv and BMv) and we derive abundances similar to P97.
Like NGC 253, the PSPC data clearly indicate an additional low-temperature plasma and excess absorption (Strickland et al. 1997). However, three-component models with solar abundances (models PRRs, PMMs) do not fit the ASCA data as well as two-component models with variable abundances. In fact, when the abundances are allowed to vary, a soft component is not required in the ASCA bandpass at all.
We also detect Fe K emission in M 82, which could have a thermal origin or could come from X-ray binaries. Adding a narrow Gaussian to the ASCA model yields and a line at keV with an equivalent width of eV and normalization of photons cm-2 s-1.
5.3 Joint Spectral Modeling
For joint ASCA and PSPC fits of M 82, we are forced to ignore the ASCA data below 0.7 keV to avoid a slight miscalibration between the detectors. Currently, there is a calibration effect in the SIS at energies less than 1 keV that causes an apparent decrease in the quantum efficiency and mimics excess absorption on the order of a few cm-2. The magnitude of the problem depends on the SIS CCD mode and the time of the observation since launch (Weaver and Gelbord 1999; in prep.). Early in the mission, this effect is only detectable for fairly bright sources and so is not a problem for our joint analysis of ASCA and PSPC spectra for NGC 253 (§ 4.4).
In the case of M 82 our best fits require the addition of a second low-temperature plasma component (models PMMs and PMMv, Table 8), regardless of whether or not the abundances are allowed to vary. For variable abundances, O and Mg are uncertain by a factor of 5 and the ratio of O to Fe ranges from 0.92 to 3.6. Non-solar abundances are required for some elements, but we find that the abundances are not necessarily unusual or overly large when excess absorption is allowed. This result differs from T97 and P97, who instead derive or assume a low value for (w). Our analysis clearly suggests that the relative abundances are model dependent and difficult to determine.
The most appropriate self-consistent description for the PSPC and ASCA data is a three component model that consists of cool thermal emission, warm thermal emission and a hard component. Model PMMv is shown in Figure 8.
6 Summary & Implications
6.1 Comparison to Previous Work
We have arrived at somewhat different conclusions than have several other recent analyses of the X-ray spectra of starbursts. As we have argued above, this is not surprising. Starburst galaxies are complex X-ray sources, with emission resulting from diffuse, hot gas inside and outside the galaxy (associated with starburst-driven winds), X-ray binaries (XRBs) and supernovae in the disk of the galaxy, and absorption from the galaxy. The soft X-ray obscuration, in particular when combined with limited spatial information, causes ambiguity in unraveling the detailed physics of the hot gas (e.g., abundances), because a multi-temperature distribution of soft X-ray thermal spectra can be modified by underlying absorption and can imitate the signature of gas with unusual abundance ratios.
From ASCA and Rosat PSPC archival data for NGC 253 and M 82, we find ambiguities in the spectral model fitting such that multiple components are confused when there is no adequate spatial information. Our most plausible model that is consistent with the PSPC images and spectra consists of three components, (1) a low-temperature thermal plasma, (2) a warm thermal plasma, and (3) a hard power-law or thermal component. We identify the spectral components with the likely emitting sources in Table 9. The line-of-sight absorption is approximately a few times 1021 cm-2 in the disk of the galaxy, but both this and the plasma abundances are model-dependent, with most constraints being inferred from the imaging data. Our self-consistent examination illustrates the criticality of the X-ray images when searching for a physically reasonable description of the data. The absolute abundances are impossible to determine without the improved spatial/spectral resolution of Chandra and XMM.
Our results differ from those by other authors. T97 examined a three component model, but fixed the absorption of the thermal components to be significantly lower than measured in the disk (VP98). They also choose to investigate abundances and non-equilibrium effects rather than absorption effects, which we claim have a dramatic impact on the soft X-ray spectrum. While none of the spectral models used by us, P97, T97, or others are unique interpretations of the data, it is worth emphasizing that there is no overwhelming evidence at this time to support highly unusual abundances or non-equilibrium effects for M 82 or NGC 253.
Joint ASCA + PSPC fits prefer larger absorbing column densities than the PSPC alone, except perhaps with a bremsstrahlung modeling of the hard component. This appears to be an effect of the different ways in which the fits are weighted, with the PSPC fits weighted toward the soft emission that is not heavily absorbed and the joint fits weighted more toward the warm emission that is absorbed. We expect the joint fits to be more sensitive to intrinsic, underlying absorption of the order cm-2 than the PSPC, because such an absorbed component is hard to isolate in the PSPC data.
The ASCA data are barely of sufficient quality to comment on the spectral origin of the hard X-ray component, i.e., thermal or non-thermal. We detect weak Fe K emission in M 82, which could arise from thermal processes or from XRBs. There are disagreements about a thermal interpretation for the hard X-rays in NGC 253 because although BeppoSAX has now detected the expected Fe K line in NGC 253, the emission is weak (P97 and Ohashi et al. 1990). One explanation for the weak Fe lines is that the hard emission contains a significant contribution from point sources - XRBs or SNe. Our spectral/spatial analysis of NGC 253 suggests that compact sources must at least partly contribute to the hard emission.
6.2 The Origin of the Thermal X-ray Emission in Starbursts
It has long been known that starbursts are unusually intense X-ray sources (cf., Fabbiano 1989 and references therein), and likewise, the existence of X-ray-emitting superwinds is now well-established. However, the process(es) by which they produce X-ray emission is (are) not clear (see, for example Strickland 1998). The chemical abundances in the X-ray-emitting gas can provide strong constraints on these processes.
If the outflowing wind consists purely of the thermalized ejecta from supernovae and stellar winds, the wind fluid would have extremely high metallicity ( 10 ), with the ratio of -burning elements to Fe roughly twice solar (e.g. Gibson, Loewenstein, & Mushotzky 1997). In this case, the gas would be very hot ( 108 K prior to adiabatic cooling), but so tenuous that it will be an insignificant source of X-ray emission (Chevalier & Clegg 1985; Suchkov et al 1994). Thus, the observational constraints on the absolute metal abundances in the X-ray plasma agree with other arguments: we are not observing emission from undiluted type II supernova ejecta.
Various processes have been proposed to boost the X-ray luminosity produced by a superwind. Substantial quantities of material could be mixed into the wind in or near the starburst as the stellar ejecta interact with the starburst ISM (the wind could be centrally “mass-loaded” - Suchkov et al 1996; Hartquist et al 1997). In this case the abundances will be intermediate between the extreme values for the supernova ejecta and the more normal values for the gas in/near the starburst. For example, the hot thermal component we observe in the cores of NGC 253 and M 82 has a temperature of roughly 107 K, which could imply a roughly 10:1 dilution of the hot (108 K) supernova ejecta with ambient gas. In this case, if the ambient gas had solar abundances, the X-ray gas would have abundances of -elements like O, Ne, Si, Mg that are roughly twice solar and only slightly super-solar /Fe ratios. Such abundances are consistent with our three-component fits to the joint X-ray spectra of M 82 and NGC 253.
Alternatively, very little central mass-loading might occur, and the hot, tenuous (X-ray faint) wind fluid could propagate into the ISM and galactic halo where it could shock heat the halo material to 106 to 107 K, causing it to emit soft X-rays (e.g., Suchkov et al 1994). In this case we would expect the abundances in the X-ray-emitting gas to reflect the pre-existing abundances in the ambient gas. In the disk of the “host” galaxy or within the starburst itself, this model would predict roughly solar abundances (consistent with our three component spectral models). In the halo, substantially subsolar metal abundances are possible. The High Velocity Clouds in the halo of the Milky Way generally have metal abundances less than 10% solar (Wakker & van Woerden 1997). The Lyman-Limit quasar absorption-line systems are generally interpreted as arising in the halos of normal galaxies (Steidel 1993), and these have abundances ranging from 0.01 to 0.4 solar (Prochaska 1999; Prochaska & Burles 1999). Thus, if the very low metallicities implied by the simple two-component fits are correct, it would imply that the observed X-ray emission is arising from shock-heated halo gas. This may be tenable for the diffuse halo emission in NGC 253 and M 82, but not for the emission in the starburst core.
It is also worth emphasizing that we are now starting to uncover a complexity in the ISM of starbursts that is similar to that in the Milky Way. This increasing complexity (e.g., two or three thermal components in the hot X-ray-emitting gas alone) supports the suggestions by Norman & Ferrara (1996) that a more general description of the ISM (a phase-continuum) should be used instead of simply adding more and more individual phases. Strickland (1998) has advocated this approach in fitting the X-ray spectra of starbursts.
6.3 Starbursts & the Enrichment of the Intergalactic Medium
The results in this paper imply that – contrary to earlier analyses – the hot X-ray-emitting superwind gas can have normal (roughly solar) abundances, and therefore may be carrying a significant amount of metals out of the starburst galaxy and into the intergalactic medium (IGM). This corroborates the suggestion by Heckman, Armus, & Miley (1990; hereafter HAM90) that starburst-driven (i.e., mostly dominated by type II supernovae – hereafter SN II) outflows are one of the potential processes for enriching the IGM at the present epoch. The importance of this effect in comparison with others is currently a matter of debate. While the observed values of the /Fe ratios in the intra-cluster medium (ICM) in galaxy clusters leave no doubt that most of the metals (by mass) were contributed by SN II (Gibson, Loewenstein, & Mushotzky 1997; Renzini 1997), the roles of Type I supernovae, galactic winds, tidal and ram-pressure stripping, elliptical vs. spirals, and dwarfs vs. massive galaxies are still matters for debate.
For example, Gnedin (1998) argues that tidal-stripping of the ISM is the dominant mechanism by which the IGM was “polluted”, and that the role of SN II-dominated outflows is negligible on cosmological timescales. On the other hand, others have argued that bimodel star-formation in elliptical galaxies, i.e., high-mass star-formation with an SN II-dominated ISM in the early phase that induces a massive wind and dies after about 0.04 Gyr (Arnaud et al. 1992; Elbaz et al 1995) might have caused significant enrichment of the IGM from ellipticals then, with no observational trace of further significant star-formation at the present epoch (see Zepf & Silk 1996).
Wiebe et al (1999), on the other hand, state that disk galaxies contribute significantly to the enrichment of the IGM, with an “effective” loss (per unit luminosity) comparable to that of ellipticals, which dominate the enrichment of the IGM only because they outnumber spirals. The efficiency of metal losses of spirals into the IGM depends on their total mass. Nath & Chiba (1995) find that dwarf starbursts can contribute to the metal enrichment of clusters at high , but they produce only low-metallicity gas.
Kauffman & Charlot (1998) have proposed that hot winds of merging galaxies at high , which later form giant ellipticals, are the sources of metals in clusters. This idea could logically combine the two apparently contradicting models favoring metal ingestion into the IGM by either ellipticals or spirals. The question remains how significant the metal enrichment of the IGM due to galactic superwinds in spirals is at the present epoch.
The most likely analogs to these systems in the current universe are far infra-red luminous galaxies (FIRGs), like e.g. NGC 6240 and Arp 220 (HAM90). According to these authors, FIRGs could inject of order and ergs per galaxy over a Hubble time, with no evolution in the superwind rate over time. While these systems are very scarce at low redshifts, sub-millimeter observations show that dusty ultraluminous galaxies are far more common at high-redshift, and may rival normal star-forming galaxies in terms of metal production over the age of the universe (e.g., Lilly 1999). Moreover, galaxies like M 82 and NGC 253 exist in far greater numbers than ultraluminous mergers in the current universe, and could dominate the present-day enrichment of the IGM in groups and clusters.
Material torn out of interacting galaxies can be observed in the form of tidal tails and similar structures (Toomre & Toomre 1972). The existence of such structures is a tracer of the shallowness of the galaxies’ gravitational potentials, which also makes it easier for them to expel metal-enriched gas via supernova-driven superwinds (see, e.g., NGC 4631; Weliachew et al 1978, Combes 1978, paper 1). In this context it is important to understand the abundances in these outflows. We have found in paper 1 that superwinds, with hot gas up to 10 kpc above the disks of galaxies, do exist and that outflows are a common phenomenon in nearby starburst galaxies. The current paper shows that the metallicities of the outflowing gas can be high enough to allow for significant metal losses into the IGM, if escape velocity is reached (cf., estimates by HAM90).
The observational limit is currently that the existing ambiguity in the minimum space of the X-ray spectral fits cannot be removed. At present we can only show that it is indeed possible to fit the data of both M 82 and NGC 253, two of the IR-brightest galaxies in the nearby Universe, in accordance with chemical evolutionary models and that this implies possible significant metal losses into the IGM. However, at the same time spectral fits to the data with extremely low metallicities are still allowed. As the next step, data of better quality is needed, first for these nearby galaxies and then for a larger sample of galaxies to see whether one of the two solutions can then be excluded. This will be possible with the next generation of X-ray telescopes, like Chandra or XMM.
X-ray studies of distant (high-) starbursts can be used to estimate the IGM enrichment by starburst-driven superwinds as a function of epoch. However, this will also only be possible based on data from one of the future X-ray missions. A good diagnostic tool is the [O/Fe] abundance ratio, which should be higher than Solar for SN II-dominated winds, while for an SN I-dominated ISM it should be close to Solar (e.g., Matteucci & Vettolani 1988). Future high throughput X-ray observations should put much tighter constraints on the possible metallicities of the hot gas in star-forming galaxies and thereby help to shed light on the potential metal enrichment of the IGM as a consequence of massive star-formation.
6.4 Current Limitations & Future Prospects
Combining the data from Rosat PSPC and ASCA is a step forward in our attempt to describe the complex X-ray emission properties of galaxies like NGC 253 and M 82 compared to studies based on data from only one instrument. Not only is there an ambiguity in the choice of the “best” model for the combined spectra, but an interpretation of data from only one satellite (in the pre-Chandra and pre-XMM era) can be even more misleading because different bandpasses are sensitive to different emission components, and neither Rosat nor ASCA can detect all of them.
X-ray spectral fits now turn into multi-component multi-d.o.f. approximations including internal (X-ray imaging) and external (observations in other wavebands) consistency checks in the choice of model components, as performed here. At present, the choice of models to be fitted to the data depends on assumptions or information from sources other than the spectra themselves.
However, there are still a few shortcomings, which call for the improved capabilities of the next generation of X-ray satellites:
-
•
While Rosat has good spatial resolution but limited spectral resolution, ASCA has a poor spatial resolution but high spectral resolution. This leads to possible ambiguities and inconsistencies in combining the data. The superb spatial resolution of Chandra, coupled with an energy resolution similar to ASCA should allow the spectral properties to be far better determined, since it will be possible to spatially segregate the different emitting components.
-
•
The effective areas of the past generations of X-ray telescopes were not high enough to provide adequate signal-to-noise for the individual X-ray sources/components in starbursts (especially given that M 82 and NGC 253 are at least an order-of-magnitude brighter X-ray sources than any other starburst galaxy). XMM’s combination of good angular resolution, large effective area, and good energy resolution will be a major improvement.
-
•
For gas in the typical temperature range seen in starbursts, even the energy resolution of the CCD’s on XMM and Chandra are inadequate to resolve the Fe-L complex (whose strength and mean energy largely drive the fits for temperature and metal abundance in the existing spectra). The 10 eV energy resolution of the XRS instrument on Astro-E should allow many individual X-ray lines to be resolved. For sources as bright as M 82 and NGC 253, it may be possible to measure the temperature range and chemical abundances via a multitude of independent emission-line ratios (as is done in solar/stellar coronae) rather than by fitting idealized models to lower-resolution, complex spectra.
-
•
Both Chandra and XMM cover a very wide energy range that includes the bandpasses of Rosat + ASCA, thus removing the uncertainties connected with the combination of two datasets with disparate properties.
Acknowledgements We thank the referee, Joel Bregman, for helpful comments. This research was supported in part by NASA grants NAG5-6400 and NAG5-6917.
References
- [] Arnaud, M., Rothenflug, R., Boulade, O., Vigroux, L., & Vanioni-Flam, E. 1992, A&A, 254, 49
- [] Bregman, J. N., Schulman, E., & Tomisaka, K. 1995, ApJ, 439, 155
- [] Cappi, M. et al. 1999, A&A, 350, 777
- [] Chevalier, R. & Clegg, A. 1985, Nature, 317, 44
- [] Combes, F. 1978, A&A, 65, 47
- [] Dahlem, M., Weaver, K. & Heckman, T. 1998, ApJS, 118, 401 (paper 1)
- [] Elbaz, D., Arnaud, M., Cassé, M. et al 1995, A&A, 265, L29
- [] Fabbiano, G. 1982, ApJ, 330, 672
- [] Fabbiano, G. 1989, ARAA, 27, 37
- [] Fabbiano, G. & Trinchieri G. 1984, ApJ, 286, 491
- [] Gibson, B., Loewenstein, M., & Mushotzky, R. 1997, MNRAS, 290, 623
- [] Gnedin, N. Y. 1998, MNRAS, 294, 407
- [] Hartquist, T., Dyson, J., & Williams, R. 1997, ApJ, 482, 182
- [] Heckman, T. M., Armus, L., & Miley, G. K. 1990, ApJS, 74, 833 (HAM90)
- [] Kaastra, J.S. 1992, An X-Ray Spectral Code for Optically Thin Plasmas (Internal SRON-Leiden Report, updated version 2.0)
- [] Kauffman, G., & Charlot, S. 1998, MNRAS, 294, 705
- [] Lehnert, M. D., Heckman, T. M., & Weaver, K. A. 1999, ApJ(1999astro.ph..4227L)
- [] Lilly, S. J. et al. 1999, ApJ, 518, 641
- [] Matteucci, F., & Vettolani, G. 1988, A&A, 202, 21
- [] Mewe, R., Gronenschild, E.H.B.M., and van den Oord, G.H.J. 1985, A&AS, 62, 197
- [] Mewe, R., Lemen, J.R., and van den Oord, G.H.J. 1986, A&AS, 65, 511
- [] Moran, E. C., & Lehnert, M. D. 1997, ApJ, 478, 172
- [] Nath, B. B., & Chiba, M. 1995, ApJ, 454, 604
- [] Norman, C. A., & Ferrara, A. 1996, ApJ, 467, 280
- [] Ohashi, T., Makishima, K., Tsuru, T., Takano, S., Koyama, K. & Stewart, G. C. 1990, ApJ, 365, 180
- [] Petre, R. 1993, BBXRT: A Preview to Astronomical X-ray Spectroscopy in the 90’s (NASA: Goddard Space Flight Center), p. 321
- [] Prochaska, J. 1999, ApJ, 511, L71
- [] Prochaska, J., and Burles, S. 1999, AJ, 117, 1957
- [] Ptak, A., Serlemitsos, P., Yaqoob, T., & Mushotzky, R. 1997, AJ, 113, 1286
- [] Raymond, J. C. & Smith, B. W. 1977, ApJS, 35, 419
- [] Renzini, A. 1997, ApJ, 488, 35
- [] Schaaf, R., Pietsch, W., Biermann, P. L., Kronberg, P. P., & Schmutzler, T. 1989, ApJ, 336, 722
- [] Steidel, C. 1993, The Environment and Evolution of Galaxies, ed. J.M. Shull and H. A. Thronson, Jr. (Kluwer: Dordrecht), p. 263
- [] Strickland, D. K. 1998, Ph.D. Dissertation, The University of Birmingham
- [] Strickland, D. K., Ponman, T. J., & Stevens, I. R. 1997, A&A, 320, 378
- [] Suchkov, A. A., Balsara, D. S., Heckman, T. M., & Leitherer, C. 1994, ApJ, 430, 511
- [] Suchkov, A., Berman, V., Heckman, T., & Balsara, D. 1996, ApJ, 463, 528
- [] Toomre, A., & Toomre, J. 1972, ApJ, 178, 623
- [] Tsuru, T., Hayashi, I., Awaki, H., Koyama, K. & Ptak, A. 1997, RMxAC, 6, 218
- [] Vogler, A., & Pietsch, W. 1999, A&A, 342, 101
- [] Wakker, B., & van Woerden, H. 1997, ARAA, 35, 217
- [] Watson, M. G., Stanger, V. & Griffiths, R. E. 1984, ApJ, 286, 144
- [] Weliachew, L., Sancisi, R., & Guélin, M. 1978, A&A, 65, 37
- [] Wiebe, D. S., Shustov, B. M., & Tutukov, A. V. 1999, A&A, (in press; astro-ph/9902202)
- [] Zaritsky, Kennicutt & Huchra 1994, ApJ, 420, 87
- [] Zepf, S., & Silk, J. 1996, ApJ, 466, 114
| Regiona | Modelc | d | kTe | Zg | / j | (0.1–2.0keV)k | (0.1–2.0keV)k | |||
|---|---|---|---|---|---|---|---|---|---|---|
| [Obs.] | [Unabs.] | |||||||||
| (1) | (2) | (3) | (4) | (5) | (6) | (7) | (8) | (9) | (10) | (11) |
| Halo | M1 | 0.90+0.40 | 0.20 | 7.0 | 1(f) | \nodata | \nodata | 96.1/28 | 1.37 | 1.85 |
| Halo | M2 | 0.90+0.40 | 0.36 | 49.9 | 0.01 | \nodata | \nodata | 20.1/27 | 1.35 | 2.07 |
| Halo | MM | 0.90+0.80 | 0.14 | 20.0 | 0.2(f) | \nodata | \nodata | 19.6/26 | 0.75(s) | 1.29 |
| 0.61 | 5.69 | 0.2(f) | 0.49(h) | 0.60 | ||||||
| Soft src | P | 1.66 | \nodata | \nodata | \nodata | 2.90 | 0.230.05 | 14.1/19 | 0.120.03 | 0.310.06 |
| Soft src | M | 0.90+1.09 | 0.40 | 4.2 | 0.0 | \nodata | \nodata | 11.2/18 | 0.120.02 | 0.180.02 |
| Soft src | MM | 0.99+2.50 | 0.14 | 1.83 | 0.2(f) | \nodata | \nodata | 12.1/18 | 0.07(s) | 0.12 |
| 0.61(f) | 0.47 | 0.2(f) | 0.04(h) | 0.05 | ||||||
| All Disk | P | 9.00 | \nodata | \nodata | \nodata | 3.68 | 3.70.3 | 34.6/29 | 1.100.10 | 17.01.3 |
| All Disk | M | 4.85 | 0.44 | 54.54.1 | 0.003 | \nodata | \nodata | 37.5/28 | 0.970.08 | 2.460.19 |
| All Disk | PM1 | 2.31 | 0.250.05 | 6.09 | 0.5(f) | 0.77(bf) | 1.10 | 19.1/27 | 0.61(s),0.29(h) | 0.92(s),0.33(h) |
| All Disk | PM2 | 7.02 | 0.290.03 | 3.83 | 0.5(f) | 1.9(f) | 1.77 | 29.1/28 | 0.48(s),0.37(h) | 0.59(s),0.79(h) |
| N. Disk | P | 16.5 | \nodata | \nodata | \nodata | 3.68(f) | 0.720.20 | 31.9/25 | 0.130.03 | 3.30.9 |
| N. Disk | M | 12.0 | 0.44(f) | 10.4 | 0.003(f) | \nodata | \nodata | 31.1/25 | 0.120.0 | 0.470.13 |
| S. Disk | P | 8.24 | \nodata | \nodata | \nodata | 3.68(f) | 3.050.22 | 24.1/25 | 0.960.06 | 13.81.0 |
| S. Disk | M | 4.33 | 0.44(f) | 45.43.2 | 0.003(f) | \nodata | \nodata | 20.6/25 | 0.850.06 | 2.050.14 |
| Core | P | 5.15 | \nodata | \nodata | \nodata | 1.80 | 8.850.32 | 108.0/27 | 2.020.06 | 3.670.13 |
| Core | M | 4.29 | 1.83 | 37.4 | 0.09 | \nodata | \nodata | 92.5/26 | 1.95 | 3.01 |
| Core | PM1 | 2.13 | 0.60 | 2.90 | 0.71(bf) | 0.91 | 4.99 | 27.6/24 | 0.56(s),1.28(h) | 0.65(s),1.46(h) |
| Core | PM2 | 5.13 | 0.80 | 1.64 | 1.0(f) | 1.9(f) | 6.93 | 70.9/26 | 0.33(s),1.58(h) | 0.42(s),3.06(h) |
| Core | PM3 | 2.48 | 0.51 | 13.5 | 0.18 | 1.9(f) | 10.6 | 25.2/24 | 0.90(s),0.89(h) | 1.32(s),4.72(h) |
| 44.4 | ||||||||||
| Hard src | P | 14.3 | \nodata | \nodata | \nodata | 2.12 | 6.46 | 33.1/28 | 1.03 | 3.42 |
| Hard src | B | 10.5 | 1.86 | 8.67 | \nodata | \nodata | \nodata | 34.5/28 | 1.02 | 2.07 |
| Total | P | 2.47 | \nodata | \nodata | \nodata | 2.23 | 20.00.06 | 90.0/28 | 6.080.12 | 11.810.30 |
| Total | M | 1.330.27 | 1.11 | 115.412.0 | 0.0+0.02 | \nodata | \nodata | 64.3/27 | 5.850.63 | 7.840.85 |
| Total | PM | 0.90+0.4 | 0.34 | 22.92.1 | 0.23(bf) | 1.50 | 13.30.04 | 21.9/26 | 5.640.60 | 6.900.76 |
Notes to Table 1:
aSource region (see paper 1).
bBackground accumulated from field for halo, soft sources, and total;
background accumulated from diffuse halo and galaxy disk emission for
disk, core, and hard point sources.
For the PSPC spectral analysis we examine both
“field” and “local” backgrounds.
The field background is determined in source-free
areas outside the galaxy that are selected to be larger
than the source regions so as not to be background-noise
limited, while the local background is determined in regions
within the halo and galaxy disk that contain diffuse emission
but that are free of compact sources. The latter
is important within the central regions
where the spatially-resolved spectra of the galaxy disk
and nucleus can be contaminated by soft, diffuse emission
that is seen in projection.
cModels are (P) power law, (M) MEKAL plasma, and (B) thermal bremsstrahlung.
All models include absorption.
dAbsorbing column density in units of 1020 cm-2. Where two values are
listed, the first is for the soft component and the second is for the hard component.
eTemperature of thermal component in units of keV. Where two values are listed
the first is for the soft component and the second is for
the hard component.
For all fits, the absorbing column was constrained to be
greater than the Galactic value of cm-2.
fNormalization of thermal component in units of 10-4K, where K is
10-14/(4 D2) for the MEKAL model and
3.0210-15/(4 D2)
for the bremsstrahlung model. D is the luminosity distance to the source in cm and
ne, nH, and nI are the electron, hydrogen,
and ion densities in cm-3.
gAbundance in units of .
hPower-law photon index.
iPower-law normalization in units of 10-4 photons keV-1
cm-2 s-1 at 1 keV.
j divided by the number of degrees of freedom.
kObserved and Unabsorbed keV fluxes in units of
10-12 ergs cm-2 s-1. Where
two values are listed, the first is for the soft component and the second is for
the hard component.
Except for fluxes and normalizations, which have 90% confidence errors for
one interesting parameter ( + 2.71), errors represent 90% confidence errors
for 2 or 3 interesting parameters ( + 4.61 and + 6.25).
“(f)” denotes a fixed parameter.
“(bf)” denotes a best-fit value that is
fixed to determine errors on the other parameters.
| Modela | normb | (w)c | kT(w)d | normb | (h)c | /kTf | normb | /dof | f(c)g | f(w)g | f(h)g | |
|---|---|---|---|---|---|---|---|---|---|---|---|---|
| (1) | (2) | (3) | (4) | (5) | (6) | (7) | (8) | (9) | (10) | (11) | (12) | (13) |
| PMM | 2.01 | 4.0 | 0.600.06 | 1.55 | 2.09 | 8.3 | 2.00 | 2.04 | 515.4/456 | 1.08 | 1.29 | 1.00 |
| PM | \nodata | 1.5 | 0.640.07 | 10.7 | 0.210.08 | 11.7 | 2.07 | 2.28 | 525.9/457 | \nodata | 2.23 | 0.71 |
| BMM | 1.86 | 4.6 | 0.61 | 1.58 | 2.27 | 5.0 | 7.01 | 1.59 | 526.0/456 | 1.05 | 1.23 | 1.07 |
| BM | \nodata | 1.3 | 0.65 | 9.47 | 0.22 | 7.1 | 6.59 | 1.66 | 540.0/457 | \nodata | 2.19 | 0.78 |
Notes for Table 2:
aModels are M: Mewe-Kaastra plasma (MEKAL), P: power law, B:
bremsstrahlung. We
assume ==1.0 for 3c and ==0.05
for two-component models, as found by P97. For the cool component
kT = 0.2 keV and the abundance is 0.2 times solar
(see joint fits). The Galactic column density is included for all fits.
bNormalizations are given in units of 10-3.
cThe units on are 1021 cm-2.
dTemperature of the warm component in units of keV.
eAbundance of O,Mg,Si, and S in solar units.
fPhoton index (temperature in keV) of the hard (hot) component.
gFluxes are 0.1-2.0 keV fluxes in units of 10-12 ergs cm-2 s-1.
∗The spectral extraction regions used here are the same as those of P97.
| Soft | Medium | Hard | ||||||||
|---|---|---|---|---|---|---|---|---|---|---|
| Modela | (w) | (h) | /kT | |||||||
| (1) | (2) | (3) | (4) | (5) | (6) | (7) | (8) | (9) | (10) | (11) |
| PMM1 | 0.260.04 | 0.18 | 6.38 | 0.700.10 | 0.5(f) | 0.8 | 0.4 | 8.51 | 1.96 | 538.5/499 |
| PMM2 | 0.260.04 | 0.17 | 6.77 | 0.72 | 0.5(f) | 0.87 | 0.5(f) | 7.91 | 1.95 | 540.5/500 |
| BMM | 0.270.04 | 0.17 | 7.67 | 0.750.09 | 0.5(f) | 0.96 | 0.5(f) | 4.60 | 7.8 | 544.2/500 |
| PMM3 | 0.270.03 | 0.17 | 7.55 | 0.74 | 0.5(f) | 0.79 | 0.5(f) | =NH(m) | 1.92 | 540.8/501 |
| PMM4 | 0.270.03 | 0.17 | 7.28 | 0.73 | 1.0(f) | 1.67 | 1.0(f) | =NH(m) | 1.94 | 540.6/501 |
| (PMM)pc | 0.340.07 | 3.76 | 0.72 | 1.0(f) | 3.35 | 1.0(f) | ∗12.9 | 2.12 | 540.5/500 | |
Notes to Table 3:
aModel components are P:power law,
B: bremsstrahlung, M: MEKAL plasma, pc: partial covering.
bTemperature of cool component in units of keV.
cAbundance of cool component in units of .
dColumn density of warm component in units of 1021 cm-2.
eTemperature of warm component in units of keV.
fColumn density of hard component in units of 1021 cm-2.
Errors for NH(w), NH(h), , and z(OMSS) are 90% confidence for 4 interesting
parameters (=7.1). Errors for kT(m) are =4.6 for cases
where both columns are free.
The Galactic column of 0.91020 included in all fits.
∗For the partial covering model, the covering factor is
| Model | A(c)a | A(w)a | A(h)a | f(c)b | f(w)b | f(h)b |
|---|---|---|---|---|---|---|
| (1) | (2) | (3) | (4) | (5) | (6) | (7) |
| PMM1 | 5.33 | 4.27 | 2.05 | 2.93 | 1.04 | 1.04 |
| PMM2 | 5.48 | 3.64 | 2.00 | 2.96 | 0.95 | 1.09 |
| BMM | 5.61 | 3.72 | 1.62 | 2.99 | 0.87 | 1.15 |
| PMM3 | 5.58 | 4.03 | 1.90 | 3.00 | 0.90 | 1.09 |
| PMM4 | 5.54 | 1.94 | 1.980.15 | 2.98 | 0.86 | 1.16 |
| (PMM)pc | 0.340.10 | 0.78 | 2.690.33 | 1.60 | 0.88 | 3.17 |
Notes to Table 4:
aNormalizations for the cool, warm, and hard components
are given in units of 10-3.
bFluxes are 0.1-2.0 keV fluxes in units of 10-12 ergs cm-2 s-1.
| (1) | (2) | (3) | (4) | (5) | (6) | (7) | (8) | (9) | (10) | (11) | (12) |
| Region | M,F | k | / | ||||||||
| [ cm-2] | [keV] | [10-3] | [10-3] | [Obs.] | [Unabs.] | [Unabs.] | |||||
| (1) | (2) | (3) | (4) | (5) | (6) | (7) | (8) | (9) | (10) | (11) | (12) |
| Halo | P | 47.0 | \nodata | \nodata | \nodata | 6.32 | 2.19 | 77.0/27 | 1.58 | \nodata | \nodata |
| Halo | M | 7.5 | 0.450.06 | 8.100.40 | 0.030.02 | \nodata | \nodata | 34.9/26 | 1.580.07 | 4.270.21 | 5.420.26 |
| Halo | MM | 4.4 | 0.31 | 0.570.05 | 1.0(f) | \nodata | \nodata | 14.3/25 | 1.500.15 | 2.260.19 | 2.870.25 |
| 4.70 | 0.740.10 | 1.0(f) | |||||||||
| Core | P | 33.5 | \nodata | \nodata | \nodata | 2.98 | 12.5 | 502.1/27 | 10.8 | \nodata | \nodata |
| Core | PM1 | 7.6 | 0.67 | 1.92 | 1.0(f) | 0.39 | 2.98 | 41.2/25 | 11.11.0 | 15.11.2 | 19.181.52 |
| Core | PM2 | 31.8 | 0.54 | 1.92 | 1.0(f) | 1.50(f) | 5.37 | 46.3/28 | 8.56 | 26.5 | 33.7 |
| Total | P | 31.4 | \nodata | \nodata | \nodata | 3.25 | 13.7 | 568.3/166 | 12.4 | ||
| Total | M | 16.4 | 0.97 | 52.0 | 0.02 | \nodata | \nodata | 540.2/165 | 12.3 | ||
| Total | PM | 5.7 | 0.60 | 2.08 | 1.0(f) | 0.57 | 3.34 | 124.7/164 | 12.7 |
| Modela | normb | (m)c | kT(w)d | normb | (h)c | /kTf | normb | /dof | f(c)g | f(w)g | f(h)g | |
|---|---|---|---|---|---|---|---|---|---|---|---|---|
| (1) | (2) | (3) | (4) | (5) | (6) | (7) | (8) | (9) | (10) | (11) | (12) | (13) |
| PRs | \nodata | 7.9 | 0.770.03 | 1.220.16 | 1(f) | \nodata | 1.500.04 | 3.580.05 | 1205.0/813 | \nodata | 8.50.2 | 3.00.4 |
| PMs | \nodata | 2.1 | 0.600.03 | 2.700.11 | 1(f) | \nodata | 1.550.04 | 3.910.10 | 1167.7/813 | \nodata | 4.00.2 | 6.50.3 |
| PRv | \nodata | 1.1 | 0.750.05 | 29.51.4 | (a) | 25.5 | 1.770.08 | 6.190.10 | 903.2/805 | \nodata | 11.10.6 | 1.00.7 |
| PMv | \nodata | 2.2 | 0.610.04 | 32.32.2 | (b) | 16.7 | 1.710.10 | 5.420.09 | 879.3/804 | \nodata | 9.70.8 | 1.50.1 |
| BMv | \nodata | 2.1 | 0.610.03 | 29.42.4 | (c) | 11.6 | 15.4 | 5.440.08 | 875.7/804 | \nodata | 9.40.8 | 1.70.1 |
| ∗PRRs | 1.310.07 | 7.60 | 0.770.03 | 12.60.3 | 1(f) | 8.9 | 1.470.08 | 3.500.10 | 969.6/811 | 3.00.2 | 5.50.2 | 2.30.1 |
| ∗PMMs | 1.530.07 | 8.400.9 | 0.670.04 | 16.70.4 | 1(f) | 10.6 | 1.540.09 | 3.960.06 | 952.4/811 | 3.30.2 | 5.30.2 | 2.20.1 |
Notes for Table 6:
aModels are R: Raymond-Smith plasma, P: power law, B:
bremsstrahlung.
*For the cool component,
the temperature is fixed at 0.31 keV and
cm-2.
(a) abundances are: N=1(f),O=0.0, Ne=0.16, Mg=0.26,
Si=0.35, S=0.60, Ar,Ca,Ni=0.014, Fe=0.034 (Si/Fe = 10.3).
(b) abundances are: N=1(f), O=0.19, Ne=0.20, Na=1(f), Mg=0.33,
Al=0.0, Si=0.45, S=0.84, Ar,Ca,Ni=0.0, Fe=0.07 (Si/Fe = 6.4).
(c) abundances are: N=1(f), O=0.21, Ne=0.23, Na=1(f), Mg=0.34,
Al=0.0, Si=0.49, S=0.97, Ar,Ca,Ni=0.0, Fe=0.08 (Si/Fe = 6.1).
Fluxes are averaged GIS fluxes for M 82.
∗(c) = cm-2 and kT(c) = 0.35 keV.
| Soft | Medium | Hard | |||||||
|---|---|---|---|---|---|---|---|---|---|
| Modela | (c) | (w) | (h) | /kT | |||||
| (1) | (2) | (3) | (4) | (5) | (6) | (7) | (8) | (9) | (10) |
| PRs | 3.7+1.5 | \nodata | \nodata | \nodata | 0.76 | 1.0(f) | 8.1 | 1.54 | 1396.3/975 |
| PRv | 4.6 | \nodata | \nodata | \nodata | 0.590.03 | (a) | 1.59 | 1.44 | 1095.1/968 |
| PMs | 3.8 | \nodata | \nodata | \nodata | 0.640.02 | 1.0(f) | 14.3.9 | 1.58 | 1360.9/975 |
| PMv | 5.72 | \nodata | \nodata | \nodata | 0.600.03 | (b) | 2.4 | 1.48 | 1066.6/968 |
| PMMs | 5.3 | 0.330.03 | 1.0(f) | 8.7 | 0.680.05 | 1.0(f) | 10.1 | 1.53 | 1110.9/972 |
| PMMv | 6.2 | 0.480.05 | (d) | 4.5 | 0.92 | (d) | 6.1 | 1.470.09 | 1045.5/965 |
Notes to Table 7:
aModel components are P: power law, R: Raymond-Smith plasma,
M: MEKAL plasma. The s and v subscripts refer to solar and
variable abundances, respectively.
bTemperature of cool component in units of keV.
cAbundance in units of .
dColumn density of warm component in units of 1021 cm-2.
Column density of soft component in units of 1020 cm-2.
eTemperature of warm component in units of keV.
fColumn density of hard component in units of 1021 cm-2.
Errors for NH(w), NH(h), , and Z are 90% confidence for 4 interesting
parameters (=7.1). Errors for kT(w) are =4.6 for cases
where both columns are free.
The Galactic column is 3.71020 cm-2.
(a) abundances are: N=1(f), O=3.17, Ne=4.47, Mg=6.41, Si=13.6,
S=33.8, Ar,Ca,Ni=8.93, Fe=0.88.
(b) abundances are: N=1(f), O=4.34, Ne=5.63, Na=1(f), Mg=9.43, Si=15.5,
S=29.5, Ar,Ca,Ni=4.88, Fe=1.98.
(c) abundances are: N=1(f), O=1.94, Ne=4.70, Mg=3.97, Si=3.58,
S=5.26, Ar,Ca,Ni=8.98, Fe=2.10.
(d) abundances are: N=1(f), O=0.85, Ne=0.01, Na=1(f), Mg=1.78, Si=2.05,
S=2.41, Ar,Ca,Ni=3.96, Fe=0.51.
| Model | A(c)a | A(w)a | A(h)a | f(c)b | f(w)b | f(h)b |
|---|---|---|---|---|---|---|
| PRs | \nodata | 1.390.08 | 4.980.05 | \nodata | 3.5 | 8.9 |
| PRv | \nodata | 1.110.05 | 4.240.04 | \nodata | 5.6 | 5.5 |
| PMs | \nodata | 1.750.07 | 5.360.05 | \nodata | 4.1 | 8.2 |
| PMv | \nodata | 1.020.04 | 4.540.04 | \nodata | 6.2 | 5.1 |
| PMMs | 2.350.10 | 21.10.6 | 4.920.07 | 4.8 | 5.9 | 2.9 |
| PMMv | 3.780.15 | 5.540.14 | 4.540.06 | 6.1 | 2.9 | 3.4 |
Notes to Table 8:
aNormalizations for the cool, warm, and hard components
are given in units of 10-3.
bFluxes are keV
observed fluxes in units of 10-12 ergs cm-2 s-1.
| Galaxy | Halo | Disk | Core | Pt. sources | Notes |
|---|---|---|---|---|---|
| (1) | (2) | (3) | (4) | (5) | (6) |
| NGC 253 | M+M | M+M | P+M | P or M | absorption in disk |
| M 82 | M+M or P+M | \nodata | P+M | P or M | absorption in disk and halo |
Notes to Table 9:
Models are M: Mekal plasma, P: power law.