Pulse Fluctuation Properties at 35 MHz
1Raman Research Institute, Sadashivnagar, Bangalore 560 080 INDIA.
2Joint Astronomy Programme, Indian Institute of Science, Bangalore 560 012 INDIA.
A few bright pulsars were observed at 35 MHz for s using the
Gauribidanur Radio Telescope, and the data were analysed to study their
single-pulse fluctuation properties
(Asgekar & Deshpande, 1999a; & ref.s therein).
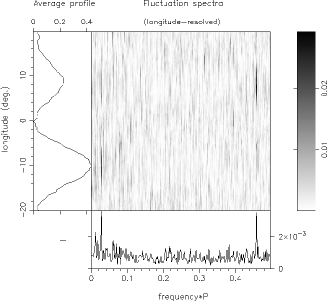
The well-known drifter B0943+10 shows a well
resolved two-component profile at 35 MHz.
The longitude-resolved fluctuation spectrum (Fig 1)
shows a stable phase modulation
feature (aliased) at , consistent with its drifting pattern
seen at higher radio-frequencies. Using the
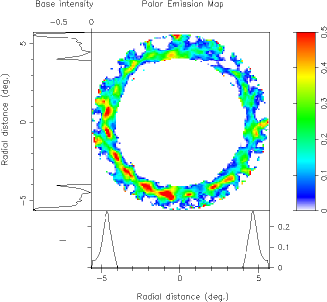
“Cartographic Transform” technique (Deshpande & Rankin, 1999; hereafter DR),
we have mapped the pattern of its polar emission at 35 MHz
(Asgekar & Deshpande, 1999b) as shown in fig 1.
Helped by the larger cone radius at lower frequencies,
the subbeams can be sampled in their full radial extent at 35 MHz.
These results combined with those at higher frequencies (DR) suggest a
steadily rotating system consisting of 20
emission-columns in the polar region as that responsible for the
observed fluctuations over the entire range of observed frequencies.
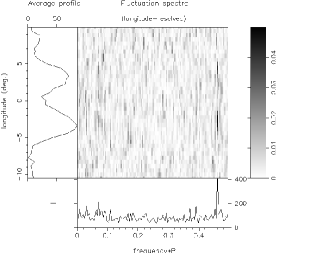
The fluctuation spectrum of
B0834+06 exhibits a feature at 0.461 related to amplitude
modulation (fig 2) and has relatively low Q-value.
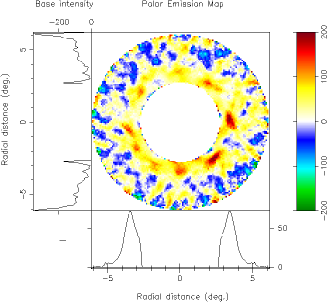
We estimate the circulation time associated with the underlying rotating
pattern of subbeams based on the fluctuation frequency (as well as phase)
and the viewing geometry for this pulsar.
This estimate depends crucially on the polarization PA-sweep rate and
we note that the polarization data presently available may be somewhat
unreliable. A preliminary polar-emission map made using our estimates
shows distinct subbeams delineating the emission cone (fig 2). More
importantly, the subbeam spacing is not as uniform as in the case of B0943+10,
consistent with the low Q of the features in the fluctuation spectra.
We have also examined the fluctuation spectra of
B1919+21 & B0950+08 at 35 MHz.
In both cases, the fluctuation spectra agree well with
those seen at higher radio-frequencies. B0950+08 shows a featureless
spectrum, but with a bifurcated profile of modulated intensity.
A closer examination shows that more intense pulses from
B0950+08 seem to bifurcate preferentially.
References
Asgekar, A., & Deshpande, A. A. 1999a, Bull. Astr. Soc. India, 27, 209
Asgekar, A., & Deshpande, A. A. 1999b, preprint
Deshpande, A. A., & Rankin, J. M. 1999, ApJ, 524, 1008