Discovery of circularly polarised radio emission from SS 433
Abstract
We report the discovery of circularly polarised radio emission from the radio-jet X-ray binary SS 433 with the Australia Telescope Compact Array. The flux density spectrum of the circular polarization, clearly detected at four frequencies between 1 – 9 GHz, is of the form . Multiple components in the source and a lack of very high spatial resolution do not allow a unique determination of the origin of the circular polarization, nor of the spectrum of fractional polarization. However, we argue that the emission is likely to arise in the inner regions of the binary, possibly via propagation-induced conversion of linear to circular polarization, and the fractional circular polarization of these regions may be as high as 10%. Observations such as these have the potential to investigate the composition, whether pairs or baryonic, of the ejecta from X-ray binaries.
Subject headings:
Radio continuum:stars – Stars:individual:SS 433accretion, accretion discs – ISM: jets and outflows
1. Introduction
High-velocity synchrotron-emitting jets are commonly observed from Active Galactic Nuclei (AGN; e.g. Ostrowski et al. 1997; Shields 1999), and X-ray binary systems (XRBs) containing both black holes and neutron stars (e.g. Hjellming & Han 1995; Fender 1999 and references therein). The composition of the jet plasma, whether electron-proton (e-p+) or electron-positron (e-e+) remains a fundamental yet unanswered question in nearly all cases.
SS 433 is one of the most celebrated of Galactic objects. The source is an XRB consisting, most probably, of a mass-losing star in a 13-day orbit with a stellar-mass black hole or neutron star. The system produces bright quasi-continuous radio jets which precess with a period of days (Vermeulen 1989; Vermeulen 1992; Brinkmann 1998). Moving optical emission lines (Margon 1984 and references therein) indicate a jet velocity of , confirmed by both VLA and VLBI radio observations (Vermeulen 1992 and references therein). These optical lines, and their X-ray counterparts (Kotani et al. 1996 and references therein), are the only direct evidence for the existence of baryonic material (i.e. e-p+) in a jet from any X-ray binary.
Recent progress towards determining the composition of the plasma in jets from AGN has been made by the detection and modelling of a circularly polarised radio component from the quasar 3C 279 (Wardle et al. 1998). Wilson & Weiler (1997) argue that radio circular polarization upper limits for the Crab supernova remnant come close to determining the positron content of the nebula. In addition Bower, Falcke & Backer (1999) and Sault & Macquart (1999) have recently detected circularly polarised radio emission from Sgr A* at the Galactic Centre.
In this paper we report the detection of circularly polarised radio emission from SS 433, the first from any XRB, at four radio frequencies. This observation has the potential to be the benchmark against which other jets from other XRBs may be compared in an effort to determine whether they produce e-p+ or e-e+ jets.

2. Observations and results
The Australia Telescope Compact Array (ATCA) consists of six 22 m alt-az antennas near Narrabri, New South Wales (Frater, Brooks, & Whiteoak 1992). Each ATCA antenna is equipped with two wide-band feed horns, and each feed horn is equipped with two pairs of orthogonal-linear probes. This allows both orthogonal polarizations at two separate frequencies to be observed with each feed horn at the same time. Observations were made using the ATCA ‘continuum-mode’, which gives bandwidths of 128 MHz simultaneously at each of two frequencies, and four correlation products (XX, YY, XY, YX). The observations on 1999 May 10 were made centered on 4.80 GHz and 8.64 GHz. On 1999 May 20, observations at 1.38 GHz and 2.50 GHz were alternated with those at 4.80 GHz and 8.64 GHz, with a cycle time of minutes. Calibration sources, selected from the ATCA Calibrator Source Catalogue (Reynolds 1997), were observed every cycle. The ATCA primary calibrator PKS 1934–638 was used to calibrate the bandpass and to set the absolute flux scale (Reynolds 1994).
Data reduction was performed with the Miriad package (Sault, Teuben, & Wright 1995). Prior to gain calibration, the xy-phase correction measured by a noise-diode system was applied, and the data were corrected for a small (otherwise unmodelled) field rotation due to the antenna’s pointing model (Kesteven 1997). The main calibration step involves simultaneously solving for time-dependent complex-gains, time-independent residual xy-phase, and time-independent polarization leakages for each feed, as well as the linear and circular polarization of the calibration source. A good parallactic-angle coverage is required in order that the leakages and calibrator linear polarization can be decoupled in the solution process through the relative rotation of the feeds and parallactic angle (Conway & Kronberg 1969).
Circular polarization data requires calibration using the ‘strongly-polarized’ equations (Sault, Killeen, & Kesteven 1991), which include terms in . To obtain such a solution requires a calibration source which has a few percent linear polarization (for this experiment PKS 1908-202) so that there is sufficient signal in the second-order terms. The accuracy of the leakage solution was estimated by repeating the entire calibration procedure for the 1999 May 20 observation, for all four frequencies, with a different calibrator (either PKS 1947+079 or PKS 2029+121). For SS433, the differences in the resultant circular polarization are of the same order as the errors expected from system noise alone; these differences have been incorporated into our circular polarization error estimates.
All calibrators were imaged in circular polarization as a consistency check, and the results for 20 May, 1999, are shown in Fig 1. The leakage calibration of these calibrators was constrained so that the results gave zero circular polarization for PKS 1934-638 (an absolute circular polarization calibrator is needed for the interferometer – see Sault, Hamaker & Bregman 1996). A bias in the observed circular polarization of compact steep spectrum sources observed at the ATCA (Rayner et al. 1999) suggests that PKS 1934–638 is in fact circularly-polarized with at 4.8 GHz. An error of this order in the absolute circular polariation flux-scale is much smaller than the observed circular polarization of SS433, and does not affect the conclusions of this paper. The sign convention of V follows the IAU convention (Transactions of the IAU, vol 15B, (1973) 166), which conforms to the IEEE definition (1969, Standard Definitions of terms for radio wave propogation, IEEE Trans AP-17, 270).
SS 433 was slightly resolved (i.e. arcsec) in the E-W direction in both total intensity and linear polarization, consistent with the observations of Hjellming & Johnston (1981). However the source is unresolved in Stokes V, consistent with all the circularly polarised flux arising in an unresolved point source.
On 1999 May 10 we also observed the radio-jet X-ray binary GRS 1915+105; at the time the source had a flat spectrum between 4.80 – 8.64 GHz, at a flux density of mJy. We can place limits of 1.2% on both the fractional linear and circular polarization of the emission from this source.
In addition to our ATCA observations, we also utilise data from the Green Bank Interferometer (GBI) variable source monitoring program. These data provide a long-term view of the state of activity of the radio source with daily flux density measurements at 2.3 and 8.3 GHz (see e.g. Waltman et al. 1991).
3. Evolution of the propagating ejecta
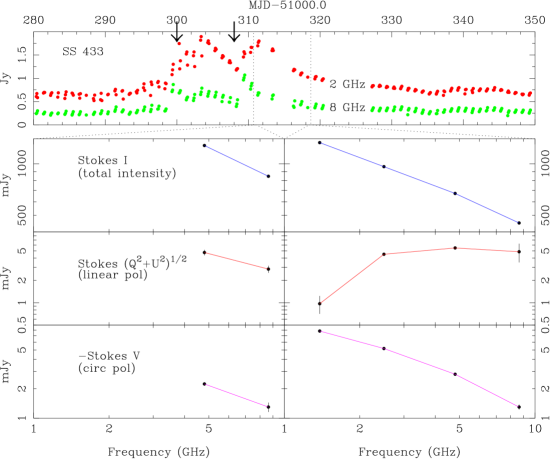
Both the GBI monitoring data and our ATCA observations are presented in Figure 2. Note that the lower two panels show the flux density measured in linear and circular polarization respectively (i.e. not the fractional spectra). A best fit to the observed flux density spectrum of the circular polarization has a spectral index of (where ). Between the two epochs it is clear that the total radio flux dropped by % and was dominated by the decaying stages of the two major flare events which peaked, at 2 GHz, on MJD 51304 and MJD 51312 respectively. Over the same period the linearly polarised flux may have increased slightly, and the circularly polarised flux appears to have remained constant.
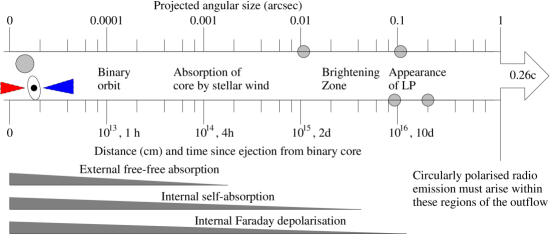
Our current understanding of the evolution of external and internal opacity effects in the outflow from SS 433 is summarised in Fig 3 (based upon Hjellming & Johnston 1981, Vermeulen 1992 and Paragi et al. 1999). Also indicated are our best estimates of the physical locations of the components corresponding to the two flare events, at the times of our observations on 1999 May 10 and May 20. We can presume that on our first epoch we only observed linear polarization from the first ejection, which contributed of the total flux density at this time. By our second epoch of observations both components contributed to the linearly polarised flux. Qualitatively this can explain the increase in the linearly polarised flux density between the two epochs, even though the total flux density decreased. Qualitatively similar behaviour is seen in the evolution of linear polarization in ejections from GRS 1915+105 (Fender et al. 1999) where the core also remains persistently (linearly) depolarised.
4. The origin of the circular polarization
Circular polarization may be produced in a synchrotron-emitting plasma either directly as a result of the synchrotron process or via conversion of linear to circular polarization (Kennett & Melrose 1998 and references therein). Below we briefly discuss the possible interpretations of the circularly polarised radio emission from SS 433 in the context of these models.
4.1. Intrinsically circularly polarised synchrotron emission
An electron of Lorentz factor can be considered to radiate synchrotron emission primarily at a frequency MHz, where is the component of the magnetic field perpendicular to the line of sight, measured in Gauss. The fractional circular polarization (= Stokes ) produced intrinsically by synchrotron radiation is of order (Legg & Westfold 1968), and hence the observed circular polarization spectrum should follow the relation . For an observed at 8640 MHz, we can estimate a magnetic field strength of mG (corresponding to ).
This estimate is in order-of-magnitude agreement with magnetic field estimates for major ejections from SS 433 and other X-ray binaries (e.g. Hjellming & Han 1995, Fender et al. 1999). Note in addition that ‘Faraday depolarization’, which can severely reduce the observed linear polarization, will have no effect on circular polarization. It is therefore possible to have an optically thin synchrotron source which displays a large ratio of circular to linear polarization, as is observed in this case. However, reversals in the line-of-sight component of the magnetic field which are likely to occur within the source will require significantly higher magnetic fields. Similarly, a significant e+ population within the source will also cause a reduction in the observed , and require a significantly higher magnetic field. In addition, the constant circularly polarised flux density at 8640 MHz during a drop by % in the total flux density does not seem compatible with an origin for the circular polarization in the optically thin ejecta which correspond to the two major flares.
4.2. Propagation-induced circular polarization
Linearly polarised radiation can be converted to circularly polarised radiation during propagation through a plasma with elliptical (or linear) propagation modes (Pacholczyk 1973; Kennett & Melrose 1998 and references therein). In the event of the admixture of a small amount of relativistic plasma to a thermal plasma, propagation modes through the plasma will become slightly elliptical, and a spectrum of the form is predicted (Pacholczyk 1973). In the event of plasma which is dominated by highly relativistic particles, the propagation modes may approach linear, and a much steeper spectrum of the form is predicted (Kennett & Melrose 1998).
Wardle et al. (1998) argued that the circular polarization observed from 3C 279 arose because of such propagation-induced ‘repolarization’. They concluded that the low-energy spectrum of the relativistic particles must extend to , and therefore the jet must be composed of an e+e- plasma (if there were protons accompanying each emitting electron the kinetic energy of the jet would be several orders of magnitude greater than that which is seen to be dissipated at the head of the jet). We note that analogous considerations may be also applicable to SS 433, where X-ray and radio hotspots are observed within the W 50 radio nebula, presumably at the site of the jet : ISM interaction. Indeed, the kinetic energy in the jets of SS 433, if they are composed of a e-p+ plasma, is erg s-1 (Brinkmann et al. 1988), which is much greater than that which is directly observed to be dissipated on larger scales within W50 (this is one of the arguments against an e-p+ plasma which is put forward by Kundt 1998).
4.3. Alternative mechanisms ?
Given the complexity of the SS 433 system and the high densities and magnetic field strengths likely to be present near to the base of the jet, alternative origins for the circularly polarised emission cannot be ruled out. These include gyrosynchrotron emission from low-energy electrons and cyclotron maser emission (Dulk 1985). We note that if the circularly polarised emission is associated with a region on the scale of one of the binary components (e.g. cm) then the brightness temperature is K at 8.64 GHz, and K at 1.4 GHz.
5. Discussion
It is of great importance to determine in which of the various emitting regions the circularly polarised flux density originated, in order to determine both the spectrum and relative strength of the emission. Our ATCA observations rule out an extension with the optically thin jets on scales of arcsec, and the lack of correlated variability in Stokes I and V argues against an association with the two major ejection events. The underlying radio spectrum of SS 433 is typically around 250 mJy at 8 GHz, with an optically thin spectral index of about , corresponding to a quasi-continuous flow of matter into the jets. If associated with this component then the spectrum of the relative circular polarization could be as flat as the predicted for intrinsic synchrotron emission. However, if associated with this component, then why not with the two flares, which are presumably just enhancements of the same flow ? Alternatively, Paragi et al. (1999) show that the innermost regions ( mas) of the jets have a flat/inverted spectrum between 1 – 15 GHz. The core region has a peak flux density typically of mJy on VLBI scales. If associated with this region the fractional circular polarization may be as high as 10% and the spectrum may steepen to the predicted for a mildly relativistic plasma (it seems unlikely that the spectrum can be recovered, unless the emission arises right in the binary core of the system, which has the most inverted radio spectrum). If associated with the inner regions, this implies a very large ratio of circular to linear polarizations, as found for Sgr A* by Bower et al. (1999).
Further precessional-phase-resolved monitoring and spatial resolution of the regions responsible for the circular polarization are essential to further investigate this discovery. If, as seems likely, the circular polarization is associated with the synchrotron emitting ejecta, comparison with circular polarization measurements of other X-ray binaries has the potential to reveal, finally, the composition of the relativistic plasmas.
References
- (1) Bower G.C., Falcke H., Backer D.C., 1999, ApJ, 523, L29
- (2) Brinkmann W., 1998, New Astronomy Reviews, 42, 589
- (3) Brinkmann W., Fink H.H., Massaglia S., Bodo G., Ferrari A., 1988, A&A, 196, 313
- Conway & Kronberg (1969) Conway, R. G. & Kronberg, P. P. 1969, MNRAS, 142, 11
- (5) Dulk G.A., ARA&A, 1985, 23, 169
- (6) Fender R.P., 1999, ‘Relativistic Jets from X-ray binaries’, In: Astrophysics and Cosmology : A collection of critical thoughts’, Springer Lecture Notes in Physics, in press (astro-ph/9907050)
- (7) Fender R.P., Garrington S.T., McKay D.J., Muxlow T.W.B., Pooley G.G., Spencer R.E., Stirling A.M., Waltman E.B., 1999, MNRAS, 304, 865
- Frater, Brooks, & Whiteoak (1992) Frater, R. H., Brooks, J. W., & Whiteoak, J. B. 1992, JEEEA, 12, 103
- (9) Hjellming R.M., Han X.H., 1995, ‘Radio properties of X-ray binaries’, In: Lewin W.H.G., van Paradijs J., van den Heuvel E.P.J., eds., X-ray binaries, CUP, p. 308
- (10) Hjellming R.M., Johnston K.J., 1981, ApJ, 246, L41
- (11) Kennett M., Melrose D., 1998, PASAu, 15, 211
- Kesteven (1997) Kesteven, M. J. 1997, Field rotation due to an antenna’s pointing model, AT Tech. Doc. Series 39.3/040, Australia Telescope National Facility
- Komesaroff, Roberts, Milne, Rayner, & Cooke (1984) Komesaroff, M. M., Roberts, J. A., Milne, D. K., Rayner, P. T., & Cooke, D. J. 1984, MNRAS, 208, 409
- (14) Kotani T., Kawai N., Matsuoka M., Brinkmann W., 1996, PASJ, 48, 619
- (15) Kundt W., 1998, ‘The astrophysical key source SS 433’, In: Buccheri R., van Paradijs J., Alpar M.A., Eds, The many faces of neutron stars, NATO ASI, Kluwer, p.461
- (16) Legg M.P.C., Westfold K.C., 1968, ApJ, 154, 499
- (17) Margon B., 1984, ARA&A, 22, 507
- (18) Ostrowski M., Sikora M., Madejski G., Begelman M., 1997, Eds, ‘Relativistic Jets in AGN’, Krakow
- (19) Pacholczyk A.G., 1973, MNRAS, 163, 29
- (20) Paragi Z., Vermeulen R.C., Fejes I., Schilizzi R.T., Spencer R.E., Stirling A.M., 1999, A&A, 348, 910
- Rayner, Sault, & Norris (1999) Rayner, D. P., Norris, R. P., Sault, R. J., 1999, MNRAS, submitted
- Reynolds (1994) Reynolds, J. E. 1994, A Revised Flux Scale for the AT Compact Array, Tech. Rep. 39.3/040, Australia Telescope National Facility
- Reynolds (1997) —. 1997, ATCA Calibrator Source Catalogue, ftp://ftp.atnf.csiro.au/pub/atnfdo cs/guides/at.cat
- (24) Sault R.J., Macquart J.-P., 1999, ApJ Lett, in press
- Sault, Killeen, & Kesteven (1991) Sault, R. J., Killeen, N. E. B., & Kesteven, M. J. 1991, AT Polarization Calib ration, Tech. Rep. 39.3015, Australia Telescope National Facility
- Sault, Teuben, & Wright (1995) Sault, R. J., Teuben, P. J., & Wright, M. C. H. 1995, in Astronomical Society of the Pacific conference Series, Vol. 77, Astronomical Data Analysis Software and Systems IV, ed. R. Shaw, H. E. Payne, & J. J. E. Hayes, 433
- (27) Sault, R. J., Hamaker J.P., Bregman J.D., 1996, A&AS, 117, 149
- (28) Shields G.A., 1999, PASP, 111, 661
- (29) Vermeulen R.C., 1989, PhD thesis ‘Multi-wavelength studies of SS 433, University of Leiden
- (30) Vermeulen R.C., 1992, The Jets of SS 433, In ‘Astrophysical Jets’, D. Burgarella, M. Livio, C.P. O’Dea (Eds), STSCi Symp. Ser. 6, CUP, p. 241
- (31) Wardle J.F.C., Homan D.C., Ojha R., Roberts D.H., 1998, Nature, 395, 457
- (32) Waltman E.B., Fiedler R.L., Johnston K.J., Spencer J.H., Florkowski D.R., Josties F.J., McCarthy D.D., Matsakis D.N., 1991, ApJ Supp. Ser., 77, 379
- (33) Wilson A.S., Weiler K.W., 1997, ApJ, 475, 661