Modelling the Far-Infrared Emission
in Spiral Galaxies
by
Simone Bianchi
A thesis submitted to the
University of Wales
for the degree of
Doctor of Philosophy
September 1999
Acknowledgements
It is a pleasure to thank my supervisor, Jon Davies, for the help he continuously gave me during the three years of my PhD project, not to speak about his contagious enthusiasm. I have benefit a lot from the discussions and comments of the past and current members of our research group, Paul Alton, Lea Morshidi, Matthew Trewhella and Alexandros Kambas. A particular thank goes to Rodney Smith, for not having shouted once during my continuous reports of real (and sometimes fictitious) problems with the computer, usually followed by a request of immediate solution; and to Judy Haynes, for having spared me months of data reduction. Among all the other people that have helped me during these three years, I would like to remember Andrea Ferrara, for suggesting new directions of investigation, and Spyros Kitsionas, Phillip Gladwin and Neil Francis, for the numerous hints they gave me.
Un grazie particolare va ai molti amici italiani, españoles, latinoamericanos, , portugueses e di molti altri paesi, che mi hanno aiutato a passare felicemente questi tre lunghi anni di permanenza in Galles. Vorrei infine dedicare questa tesi alla mia famiglia e ai miei amici di sempre. Cu!
Summary
The dust distributions observed in spiral galaxies play a major role in Astrophysics. Dust very effectively extinguishes UV and optical starlight. Therefore it may alter considerably our view of the galaxy itself and of the distant universe in its background. The dust opacity in spiral galaxies is still a debated issue. Since the energy absorbed by dust grains from starlight is re-emitted at longer wavelengths, mainly in the Far-Infrared (FIR) and Sub-millimetre ( 60-), observations of dust emission can help to constrain the parameters of the dust distribution.
I have developed an original model for the FIR emission in spirals, starting from an existing radiative transfer code (Bianchi, Ferrara & Giovanardi 1996). The model’s main features are: a complete treatment of multiple scattering within geometries appropriate for spirals; a full coverage of spectral range of stellar emission; the use of empirically determined dust properties (some of which are derived in the present work); the production of maps of the dust temperature distribution, together with simulated optical, FIR and sub-millimetre images. The model has been applied to observations of stellar and dust emission in the galaxy NGC 6946.
It is found that optically thick models (central face-on optrical depth ) are necessary to explain the observed FIR output. For such models, almost 30-40% of the intrinsic starlight is absorbed. The observed ratio of FIR and optical scalelengths can be explained if the dust distribution is more extended than the stellar. However, because of the less steep gradients of optical emission in optically thick cases, a very extended dust distribution is needed (). The distribution of atomic gas in NGC 6946 has a similar extent.
I discuss the approximations in the modelling (mainly the use of smooth distributions against the observed clumpiness of the interstellar medium) and the implications of the results.
Chapter 1 Introduction
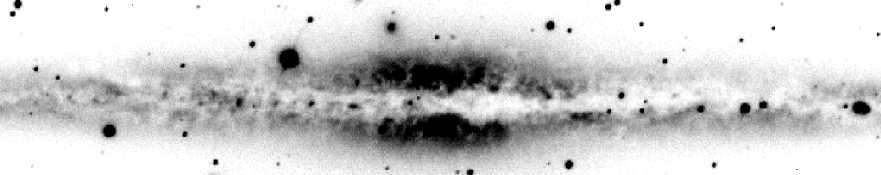
Observations of our Galaxy, as well as of other spirals (Fig. 1.1) reveal the presence of regions of sky darker than the surroundings. This apparent decrease in the number of stars is caused by one of the constituent of the Inter-Stellar Medium (ISM), dust. Dust is made of small (mean radius 0.1m, Hildebrand 1983) solid grains possibly made of silicates and graphite (Draine & Lee 1984). It constitutes only a tiny fraction of the ISM: for instance, in the Solar neighbourhood, the mass of dust is less than 1% of the mass of the gas (Sect. 2.2). Despite its relatively small abundance, dust plays a major role in astrophysics. Dust grains are very effective in extinguishing Ultra-Violet and Optical (m) starlight because the radiation wavelength is of the same order of the grain size (Sect. 2.2). Our view of the universe, being mainly based on optical observation, can therefore be severely biased by dust extinction.
Dust’s ability to extinguish radiation is usually quantified by the extinction , i.e. the ratio between the observed and the intrinsic unextinguished luminosity, in a magnitude scale. In the case of dust laying between a light source and the observer, the extinction is approximately equal to the optical depth , the inverse of the mean free path of light in a dusty medium (See Sect. 2.1 for mathematical definitions). Extinction and optical depth depend on the wavelength , the effect of dust being larger for smaller wavelengths (Sect. 2.2). The higher transparency of a dusty medium for radiation at large wavelength rather than for short wavelengths, goes under the name of reddening. A medium is defined as optically thin for a radiation of wavelength if , the amount of dust not reducing drastically the source radiation, or optically thick otherwise. Within the Galaxy, an extinction in the V band mag is observed in the direction of the poles, while in the direction of the Galactic centre it reaches (Whittet 1992). While the relative transparency out of the Galactic plane has permitted us to observe extragalactic objects, the high opacity along the plane has severely biased the first determination of shape and dimension of the Galaxy (Whittet 1992).
Dust extinction in the Galaxy is directly assessed through studies of the obscuration of individual stars of known intrinsic luminosity. This is not possible in external galaxies. For these objects, estimates of the extinction of galactic light by dust in its own ISM (usually referred to as internal extinction) rely on a comparison of the observed luminosity profiles with models of radiative transfer. Realistic models are necessary, to avoid misinterpretations and mutually exclusive results (Disney, Davies & Phillipps 1989). Among the requirements of realistic models, the choice of stellar-dust geometries appropriate to galaxies and the inclusion of light scattering by dust in the radiative transfer are vital (Sect. 3.1). A brief review of extinction studies is presented in Sect. 1.2.
The stellar radiation absorbed by dust is re-emitted at infrared wavelengths, mainly in the Mid-Infrared (5m-60m; MIR) and in the Far-Infrared (60m-300m; FIR) spectral ranges. Dust emission has been observed in our Galaxy as well as in the other spirals (Sect. 1.3 and Sect. 1.4). In our Galaxy, 10-30% of the total Galactic bolometric luminosity is emitted by dust (Whittet 1992). The Infrared Astronomical Satellite (IRAS) has revealed that the Galactic dust emission is characterised by regions of Star-Formation, with dust at higher temperatures because of the closeness to the radiation sources (Sect. 2.3), and diffuse, thin clouds (often denoted as cirrus) of colder dust, heated by a diffuse Inter-Stellar Radiation Field (ISRF) (Beichman 1987). The cold diffuse cirrus dust, due to its ubiquity, is responsible of the interstellar extinction. As for external galaxies, studies of dust emission are limited by the instrument resolution, sensitivity and spectral range observed (Sect. 1.3). However, the recent technological development (mainly in the Sub-millimetre and millimetre spectral ranges for m) has permitted the observation of cold dust responsible for extinction in external galaxies as well (Sect. 1.4).
Because of the direct link between dust emission and extinction, it is possible in principle to derive the quantity of dust in a spiral galaxy by comparing the observed stellar luminosity with the FIR emission, if an accurate radiative transfer model is used. For this Thesis, I have modified an existing radiative transfer code for spiral galaxies (Bianchi, Ferrara & Giovanardi 1996) to model dust emission in the FIR. The observed Spectral Energy Distributions (SEDs) of stellar and dust emission, as well as their spatial distribution, will be compared to the model output to gain clues about the galaxy dust content and star-dust relative geometry.
In this Chapter I will describe observations of extinction and FIR emission, introducing the main topics that will be discussed throughout the rest of the Thesis. A plan of the Thesis is presented at the end of this Chapter. A brief discussion of the relevance of dust studies to the understanding of spiral galaxies and distant universe is given in the next Section.
1.1 Relevance of dust studies to extra-galactic astronomy
Dust plays a very important role in many astrophysical processes, from the formation of molecular gas, that is believed to combine on grain surfaces, to the obscuration of the distant universe. Without the pretension of being complete, I discuss now a few problems that may benefit from a proper knowledge of dust distribution and amount.
- Galactic Properties:
-
The study of galactic morphology depends, obviously, on the observed radiation. Galactic properties, like luminosity and dimension, may be severely biased by dust extinction. Objects with the same intrinsic properties but different dust distribution properties may look of different type, thus prejudicing any morphological classification based on the optical aspect. As an example, Trewhella (1998a) found that an Sc galaxy observed in the B-band, NGC 6946, is similar to an Sb when a correction for extinction, from his model, is applied. Because of the selective extinction with the wavelength, ages of distant objects inferred from broad-band colours may be biased by the reddening introduced by dust (Cimatti et al. 1997).
- Dark Matter:
-
Rotation curves of spiral galaxies derived from atomic Hydrogen observation can be used to infer the galactic mass. The mass of a galaxy derived from the luminosity, assuming a constant mass-to-luminosity ratio, is always smaller than that derived from the gravitational studies: large amounts of dark matter are present. At present, dark matter is unexplained. Although it is improbable that dark matter is due to a large underestimate of the stellar content due to extinction, dust emission may trace a possible extended halo component of cold gas, that can account for some of the unseen mass (Gerhard & Silk 1996).
- Obscuration of the distant Universe:
- Tully Fisher relation:
-
the relation between the HI line width at 21cm and the galactic luminosity is used to derive the object distance from its apparent magnitude. Because of dust, corrections are necessary to bring the luminosities of objects with different inclination to a common face-on value (Sect. 1.2). The Tully-Fisher relation in the optical band presents a large scatter, mainly because of dust extinction. Although the scatter is significantly reduced using luminosities in the less extinguished Near-Infrared (NIR), extinction correction may still be necessary (Moriondo, Giovanelli & Haynes 1998).
- Star Formation:
-
ultraviolet and blue fluxes are used to derive the star-formation history of the Universe (Madau et al. 1996). Star-formation rates are therefore greatly dependent on correct estimates of extinction. On the other hand, if the rate is to be derived from dust FIR emission, a knowledge of the dust heating mechanism is necessary (Sec. 1.5).
1.2 Studies of dust extinction
A derivation of the extinction in an astrophysical object is relatively easy only in the case when dust lies between the source of radiation and the observer (a screen model; Sect. 3.1), as for stars in the Galaxy. Even in this case, a knowledge of the intrinsic luminosity of the source is necessary to assess the opacity of the dust screen. This is not the case for spiral galaxies, where the intrinsic properties of unextinguished objects are unknown and the dust distribution is co-spatial with the stars.
One method used to infer the opacity of spirals is the study of the variation of some observables, like surface brightness and magnitude, with the inclination of the object. For a simple model where dust and stars are homogeneously distributed in an infinite plane-parallel geometry (a slab model; Sect. 3.1), the surface brightness (magnitude per unit solid angle) of the object will increase with the inclination in the optically thin case, because lines of sight closer to the model plane intersect a larger portion of the galaxy. In the optically thick case, instead, only the radiation coming from a region of the dimension of the mean free path for a photon is observed, and this is independent of the inclination. Opposite behaviours are expected for the total magnitude, that will be constant in the optically thin case, because all the light emitted by stars can be seen from any direction, while it will decrease in an optically thick case, as a result of the decrease of the object’s area projected on the sky. These results for the slab model constitute two limiting case, an object with more realistic dust geometry will have intermediate behaviours. Statistical studies have been conducted on large samples of galaxies of supposedly similar properties as a function of the inclination with which they are observed.
The first study of this kind was that conducted by Holmberg (1958) analysing the variation of the projected surface brightness with the inclination for a sample of 119 spirals (53 of types Sa-Sb, 66 of type Sc). Using a model derived from the variation of the Galactic extinction with the latitude (a screen model, as he recognised later; Holmberg 1975) he inferred a substantial transparency for spiral galaxies. This result was widely accepted, until Disney et al. (1989) showed how it depended heavily on the assumed model. They were able to fit Holmberg data with an optically thick model, provided the dust distribution was internal to the stellar one, as inferred from observation of edge-on galaxies. For an infinite opacity, such a model would behave as a transparent one, because of the unextinguished dust-free layer of stars above the dust distribution. They showed how more realistic models are necessary to ascertain the opacity of a galaxy (See Sect. 3.1 for a description of the problems involved in producing realistic models of internal extinction in a spiral galaxy).
Unfortunately statistical studies, even within the framework of proper models, can be severely biased by selection effects. For instance, two works suggesting high optical depths up to large distances from the galactic centre (Valentijn 1990, Burstein et al. 1991) are shown to be affected by the object selection criteria, by selecting galaxies with similar surface brightness independently of the inclination (Davies et al. 1993) or lying in a too small space volume (Davies et al. 1995).
Giovanelli et al. (1994) analysed the photometric properties of a sample of 1235 Sbc-Sc galaxies observed in the I band. The derived laws relating galactic photometric properties to the inclination are then compared to the results from a TRIPLEX model (Disney et al. 1989, Sect. 3.1). Observations are compatible with a galactic disk having a central face-on optical depth, (, using the Galactic extinction law in Table 2.1). A similar analysis was conducted by Moriondo et al. (1998), on a sample of 154 spirals observed in the Near-Infrared (1m-5m; NIR) band H (68 of which with I band data). Each galaxy is decomposed into its structural parameters and their variation with inclination were studied. The effects of internal extinction were detected, especially the increase of disk scalelengths and I-H colour with inclination. Simulations from a modified version of the TRIPLEX model, allowing for larger dust scalelengths (Xilouris et al. 1997; 1998, Sect. 1.6), lead to results compatible to the observations if the central face-on optical depth is (). For such optical depths the galactic disk would be moderately opaque, becoming optically thin, for face-on inclinations, at about 1 disk radial scalelength from the centre.
Extinction studies have also been carried out more directly on single objects. One of the dust properties that is frequently exploited in extinction studies is the selective extinction at different wavelengths. If intrinsic variations of starlight colour, like those due to different stellar populations being present in different parts of a disk, are not present, a reddening of the radiation will reveal the dusty regions. Therefore, comparing images in the optical, where extinction should be present, with observation in the NIR, which are far less affected by dust (; Table 2.1) a map of the extinction can be produced. Using a radiative transfer model, the optical depth can be finally retrieved. However, even in the hypothetical case of no intrinsic colour variation, the method is not of easy application, since it is difficult to derive the intrinsic unextinguished colour for the stellar population. Block et al. (1994) used optical-NIR colours to derive the extinction in two mid-inclined spiral galaxies, NGC 4736 and NGC 4826. They estimate the intrinsic colour from regions that look free of extinction or by using synthetic models of stellar populations. With a radiative transfer code, they retrieve a relation between the colour and the dust optical depth. In NGC 4736 they detect a dust component demarcating the spiral arms, with optical depth 24, and diffuse interarm dust with . In NGC 4826 it is distributed in a foreground screen of . From the optical depth they deduced the dust mass and found values an order of magnitude higher than those inferred by IRAS observations of dust emission (I’ll show in Sect. 1.3 and 1.4 how IRAS observations are not able to detect the more massive dust component in a galaxy). Regan, Vogel & Teuben (1997) applied the same technique to NGC 1530, using six optical-NIR colours. A peak face-on optical depth is derived in a nuclear dust ring.
The same line of reasoning is used by Peletier et al. (1995). They measured the radial scalelength in B and K and studied their ratio as a function of inclination. Assuming that the colour radial gradient is due mainly to dust (see De Jong 1996a, for an opposite view), the variation of the scalelength ratio can be described by an extended distribution of dust (Sect. 1.6) with face-on optical depth of order unity in the V band. Beckman et al. (1996) measure radial scalelength in B, V, R, I for three face-on galaxies, over the whole disk and over selected regions, to separate the arm contribution from the interarm. The increase of the radial scalelength with the decreasing wavelength of the observation, is modelled with a radiative transfer code for face-on galaxies. Higher central face-on optical depths are found for the arm region than for the interarm. When optical depths are derived from the mean scalelength of each whole galaxy, values of are found.
Kuchinski et al. (1998) study several optical-NIR colours of 15 highly inclined spiral galaxies. Colour-colour plots for different position along the minor axis of each galaxy are compared with analogous data from a complex Monte Carlo radiative transfer model (Sect. 3.1) inclusive of scattering, stellar and dust disk, stellar spheroidal distribution and clumping. The observed trajectories in the colour-colour plots can be explained by models with optical depths in the range .
In all the optical depth determinations from radiative transfer models presented above, assumptions where made about the parameters describing the stellar and dust distribution. In edge-on galaxies, where the gradients due to dust extinction are maximised, resulting in evident extinction lanes, it should be possible to derive both the optical depth and the distribution parameters from an image of the galaxy. This is achieved by the fitting procedure of Xilouris et al. (1999). A mean V-band face on optical depth is derived from models of 7 edge-on galaxies.
Alternatively, light from background objects can be used to derive the extinction, in the simple screen scheme, without any knowledge or assumption required for the relative distribution of dust and stars in the galaxy. The first application of this technique is made by Zaritsky (1994), to detect a possible dust halo in two spiral galaxy. I will discuss this more extensively in Sect. 1.6 and in Appendix B. González et al. (1998) studied the colour and number counts of background galaxies through the disks of the spiral galaxy NGC 4536 and the irregular NGC 3664, using images from the Wide Field Planetary Camera 2 of the Hubble Space Telescope. They found an extinction =0.74-1.07 for the arm region of NGC 4536 (the value depending on the method used), and of 0.5 for the interarm region. The disk of NGC 3664 shows an extinction =1. These results convert to 2 for the arm region of NGC 4536 and the central part of NGC 3664.
Another technique that makes use of background objects is the method of overlapping galaxies (White & Keel 1992, Berlind et al. 1997). To separate the radiation of the foreground object from the attenuated radiation of the background one, smooth and symmetric objects are required. If this is the case, it is possible to estimate each intrinsic individual flux in the region of overlap from the flux in the regions were the objects are seen separately. Subtracting the foreground flux from the overlap, only the attenuated flux of the background object is left. Comparing it to the intrinsic flux the extinction can be derived. Both the works of White & Keel (1992) and Berlind et al. (1997), conducted on two different galactic pairs, give higher extinction for the arm region ( 1) than for the interarm ( 0.5).
Most of the recent work listed here seem to suggest that galaxies have a moderate extinction, with face-on central optical depth of order unity. However, the methods devised to ascertain the opacity in a spiral galaxy suffer from a lot of uncertainties and assumptions. Further constraints on dust can be obtained analysing its FIR emission.
1.3 FIR emission from spiral galaxies: missing dust?
As a consequence of the principle of energy conservation, the radiation absorbed by dust from stars must be re-emitted. Using simple calculations for a dust grain immersed in the local ISRF, Van De Hulst (1946) derived a grain equilibrium temperature K. The peak of dust emission would therefore occur at m, in the FIR (Sect. 2.3). Dust in the proximity of stars would be heated to a larger temperature and therefore emit at shorter wavelengths (Whittet 1992). With the launch of IRAS in 1983 (Neugebauer et al. 1984), dust emission was revealed to span over a wide wavelength range, from the MIR to the FIR, in our Galaxy (Beichman 1987, Cox & Mezger 1989) as well as in other spirals (Rice et al. 1988).
IRAS observed in four broad filters centred at 12, 25, 60 and 100 m, covering a spectral range from m to m. If dust is heated preferentially by the ISRF to temperatures lower than 30K, the peak of dust emission is not observed. Because of its spectral range, IRAS is therefore more likely to pick up regions where dust has higher temperature, like in the proximity of star forming regions, where the radiation field is higher than in the diffuse medium. Furthermore, it was discovered that emission at m is mostly due to small grains heated stochastically and not at the thermal equilibrium (Sect. 2.5). Because of this excess emission at shorter wavelengths, dust temperatures derived from IRAS flux ratios under the hypothesis of thermal equilibrium are biased towards higher values.
The luminosity emitted by dust depends on a high power of the temperature (, where ; Sect. 2.3). A small amount of warm dust can therefore emit more radiation than a large amount of cold dust, which could pass undetected, unless observations cover the spectral range where cold dust emission peaks. Using IRAS data only, the bulk of the dust in a spiral galaxy may be overlooked. This is evident in the first determinations of the gas-to-dust mass ratio in our Galaxy and in other spirals. From the correlation between the local column density of interstellar hydrogen (atomic + molecular) and the colour excess E(B-V) found by Bohlin et al. (1978) towards a sample of 96 stars (Sect. 2.2) in the Solar neighbourhood, it is straightforward to derive the local gas-to-dust mass ratio. A value of 130 is found. The first determinations based on IRAS data gave higher values than that, thus implying a substantially smaller amount of dust than that derived from the extinction in the local interstellar medium.
Sodroski et al. (1987) analysed the Galactic IRAS FIR emission at 60 and 100 m. After correcting for zodiacal light and smoothing over discrete sources, the FIR emission from the galactic plane was compared to CO, HI and 5Ghz surveys, to study the similarities between dust emission and the main three phases of the gas, molecular, atomic and ionised. The longitude profiles of 60 and 100m are quite similar to the CO and 5Ghz emission, while the HI is broader. The latitude distribution suggests a significant contribution from the dust associated with the atomic gas, the 100m emission being broader and following closer the HI warp than the molecular. Temperatures derived from the ratio of 60 and 100m fluxes are quite constant, with a mean value of 24 K (using an emissivity law with ; Sect. 2.3 and 2.4), decreasing by less than 10% from the inner to the outer Galaxy. This was unexpected, if the ISRF is the main contributor to dust heating: dust temperature should be higher in the centre, where the ISRF is higher. The constancy of T is ascribed to stochastically heated grains, whose apparent temperature (i.e. the temperature as measured from the flux ratios under the assumption of thermal equilibrium, which is not the case for small grains) depends very weakly on the IRSF. The derived dust masses lead to a gas-to-dust ratio that is twice the value for the Solar neighbourhood in the inner Galaxy, and 6 times higher in the outer Galaxy. The larger gas-to-dust ratio can be explained if a cold dust component from 1.5 to 6 times more massive than the warm dust is introduced. The cold component would contribute only to the 20% of IRAS emission.
Sodroski et al. (1989) decompose the IRAS Galactic plane emission at 60 and 100 m into three emission components, associated with the molecular (H2), neutral atomic (HI) and ionised (HII) phase. For several position along the galactic plane they derive temperatures (under the assumption of a singular temperature component along the line of sight), optical depths and gas-to-dust ratios for each of the three components. The assumption of a single T along the line of sight biases the results towards higher values of T. Using an emissivity law with =2, they derived T=24 K for the HI component, a warmer T=32K for the HII component, consistent with OB stars heating the dust, while the molecular component is colder, T=18K. As in their previous work, the small variations of the temperature with the galactic longitude are not compatible with ISRF heating, but rather betray the presence of small transiently heated grains. The gas-to-dust ratio of the HI component is higher than the Solar neighbourhood value, as already seen in Sodroski et al. (1987). The value for the HII component, instead, is closer to that expected, because the temperature of dust associated with HII regions is higher then for dust in the mean ISRF, and therefore less affected by the IRAS bias on high T and the small grain emission. The gas-to-dust ratio for the molecular gas has large uncertainties.
A similar trend was observed in other spiral galaxies. Devereux & Young (1990a) derive the dust mass from 60 and 100m IRAS fluxes, for a sample of 58 spiral galaxies with available HI and H2 data. A good correlation is found between the mass of gas and the mass of dust. The dispersion in the correlation is reduced when only data for the inner disk (RD25) are used. Since molecular gas is always concentrated in the central part of the galaxy, this suggested that the outer part of the HI disk does not contribute significantly to the FIR emission. Nevertheless, the derived gas-to-dust ratio is higher than the Galactic (a mean value 1080). The observed value can be explained if 90% of the total dust mass has T15K, too cold to be detected by IRAS.
It is interesting to note that cold dust at T K was not detected even when IRAS fluxes of spiral galaxies were integrated with sub-millimetre/millimetre observations (Eales, Wynn-Williams & Duncan 1989, Clements, Andreani & Chase 1993). Clements et al. (1993) explain this with the different beam sizes of the IRAS telescope (FWHM=120”) with respect to the observation at longer wavelengths (). Directly comparing the fluxes in the two spectral ranges is equivalent to assuming that both the emissions come from a region smaller than the smaller beam size. If instead dust emission is extended, the flux from mm/sub-mm observations will be underestimated. Correcting the mm/sub-mm fluxes for this effect, Clements et al. (1993) retrieve a colder dust temperature of 20K.
1.4 FIR emission from spiral galaxies: cold dust
As already foreseen, the picture changed with the availability of observations at wavelengths longer than the range observed by IRAS. Sodroski et al. (1994) repeat the same analysis as in Sodroski et al. (1987; 1989), but using the 140 and 240 m observation of the Galactic plane from the Diffuse Infrared Background experiment (DIRBE) aboard the Cosmic Background Explorer (COBE) satellite. The observations are more sensitive than IRAS to cold dust, and the contamination from small grain emission is avoided. A mean gas-to-dust ratio of 160 is found, now compatible with the local value derived from extinction, and a mean temperature of 19 K. The longitudinal trend of T suggests that the dust temperature decreases with the galactocentric distance, compatible with dust being heated by a general ISRF. The gas-to-dust ratio increases with longitude, suggesting a lower metallicity in the external part of the galaxy, or the presence of a colder dust component, too cold to be detected even by DIRBE. As in Sodroski et al. (1989), the FIR emission is then decomposed into the contribution of the three gas phases. The temperature of dust associated with HI is consistent with ISRF heating and similar to the previous IRAS determination for the other components.
In Sodroski et al. (1997) a similar data set is used to produce a three-dimensional model of the Galactic FIR emission. The properties of the dust component associated to each gas phase are retrieved as a function of the Galactocentric distance for 3 rings in the inner galaxy and for the outer galaxy out from the distance of the Sun, after adopting a rotation curve. Temperatures are still derived fitting a blackbody to the 140 and 240m images, using a emissivity. For the HI component, T decreases with the galactocentric distance as for dust heated by the ISRF. Apart from the position of the molecular ring, the main contributor to the FIR is dust associated with HI (55-65% of Galactic FIR emission). The temperature is T21 K. The gas-to-dust ratio for the component associated with HI increases outward (consistent with the decrease in the metallicity gradient), with a value of 13040 at the Sun Galactocentric distance. A similar gas-to-dust ratio is retrieved for the other gas phases. Assuming an emissivity law (Sect. 2.3 and 2.4) and using the optical depth at 240m for the HI and H2 dust component, they find that the radial distribution of the face-on optical depth of the Galactic disk is quite flat, with . If seen from a face-on direction, the Galaxy would look transparent, with a total extinction 0.2. There is no evidence in DIRBE data to support the idea that a large fraction of the hidden mass in spirals may be due to unseen cold gas and stars obscured by intervening dust.
Reach et al. (1995) fit several models to the Galactic spectrum from 104m to 4.5mm, observed by the Far-Infrared Absolute Spectrometer (FIRAS) on board of the COBE satellite. Data are best fitted by a two temperatures model, with a warm component with 16KT23K and a very cold component with 4KT7K. High signal to noise spectra in the inner Galactic plane need an intermediate component, with T14K. The warm dust produces the Galactic spectrum between 100 and 300 m and is identified as produced by large grains in equilibrium with the ISRF. It is identical to the dust detected by Sodroski et al. (1994). The very cold component gives an important contribution to the spectrum only for m and shows very little variation with position in the Galaxy. The optical depth of the cold component correlates well with the warm component and this suggests a Galactic origin. It is difficult to explain this component with dust shielded from the ISRF in the core of very opaque clouds: the high optical depths required and the ubiquity of the cold component would produce a Galactic extinction much higher than that observed. Transiently heated grains would have a very small temperature between each temperature fluctuation. Nevertheless, dust models (Désert et al. 1990) predict a contribution of very small grains to the spectrum in this wavelength range that is smaller than that observed: an increased amount of small grains to match the FIR-Submm spectrum would produce an excess of emission in the NIR, that is not observed. Other possible explanations require the presence of grains with unusual optical properties, as for example fractal grains with high emissivity, emissivity enhancements, like spectral features of the grains responsible for the warm component, or very large grains, although they should have a dependence on the ISRF, while the cold component has a quite constant T in the inner and outer galaxy. The third dust component observed in the inner galaxy is associated with the molecular gas, as indicated by the rough correlation between the variation of its brightness and that of the CO line. Dust in molecular clouds shielded from the mean ISRF would be heated to similar temperatures. It is very weak, contributing only 2% to the emission at 200m.
Boulanger et al. (1996) studied the correlation between the FIR emission from dust as measured from DIRBE and FIRAS and the atomic gas emission at high galactic latitude. They found a very tight correlation for atomic hydrogen column densities below 5.5 1020 H-atoms cm-2. Above this threshold there is an excess of FIR emission that is interpreted as the increasing contribution of dust associated with molecular clouds: FIR emission associated with this dust is observed, while the H2 is not in a HI survey. In the limit for zero HI column density there is a residual FIR emission, that is considered as due in part to an isotropic cosmic FIR background (Puget et al. 1996) and in part to warm ionised gas uncorrelated to the atomic component. After removing the residual, a mean spectrum for the low column density regions is computed, characterised by a temperature of 17.50.2 K (). No evidence for the Reach et al. (1995) very cold component is found, thus suggesting that it was an artifact caused by the cosmic FIR background.
Lagache et al. (1998) analysed high latitude observation from DIRBE and FIRAS, after subtracting the cosmic FIR background of Puget et al. (1996). Using the 60m DIRBE image as a template of the diffuse Galactic emission, they isolate regions with excess emission at longer wavelengths. These regions at colder temperatures are associated with dense molecular clouds and appear as positive excesses in the FIR/HI correlation of Boulanger et al. (1996). The drop in temperature may be due to the attenuation of the radiation field in a dense cloud, but also to a change in the dust properties with the environment. Some regions have negative excesses, with dust hotter than in the mean interstellar medium because of the proximity to young stars, like in HII regions. The mean FIRAS spectrum for regions without FIR excess can be fitted with a modified blackbody () of T=17.52.5 K. Temperature fluctuations can be converted to variations of a 30% around the mean intensity of the radiation field. For regions of sky (3.4% of the celestial sphere) with a significant FIR excess, a two component spectrum is required, with a warm temperature T=17.81.2 K, consistent with the one derived in the other regions without FIRE excess, and T=15.00.8K for the cold dust, associated with the molecular clouds. The coldest temperature detected is 13K. Again, no evidence for the Reach et al. (1995) very cold component is found, whose detection is shown to be an artifact of the unsubtracted cosmic FIR background. Regions without FIR excess are further analysed in Lagache et al. (1999). Decomposing the FIR spectrum in dust associated with HI gas and with Warm Ionised Medium (WIM), they derive a temperature for the dust in the second gas component of T=20K. Dust properties in WIM are quite similar to those in the neutral gas (See Sect. 2.4.3) and consistent with those derived by Boulanger et al. (1996).
With newly available observations in the FIR at m and in the mm/sub-mm range, large amounts of cold dust have been finally observed in other spiral galaxies. Chini & Kruegel (1993) mapped the 1.3mm emission of three galaxies. They find that the dust emission spatial extent is comparable to the optical size of the galaxies. Because of the spatial information of the emission, they can safely compare the new observations with IRAS data, without being affected by the beam size problem described by Clements et al. (1993). A cold dust component with T=17 K is necessary to explain the spectra for m.
Guélin et al. (1993) observed NGC 891 at 1.3mm, using a bolometer array at the IRAM telescope. The measured flux is nine times stronger than what would have been expected on the bases of IRAS fluxes and temperature. After discharging other possible contributions to the observed emission, as CO lines or free-free emission, they conclude that the bulk of the emission must arise from dust at T K. Comparing IRAS fluxes with a 1.3mm image of NGC 3627, Sievers et al. (1994) concludes that emission at m can be explained by a dust component with T= 19.5K.
Chini et al. (1995) mapped 32 non-active spirals at 1.3mm, observing 7 of them also at 450 and 800m. Integrating the data with IRAS fluxes, they find that the coldest dust component necessary to fit the spectrum at larger wavelengths has an average temperature in the range 10-20 K.
Cold dust is found by Guelin et al. (1995) in M51; they combine fluxes from a 1.2mm image with FIR observation between 55 and 320 m from the Kuiper Airborne Observatory. The millimetre image is smoothed to the poorer resolution of the KAO observation. The spectrum at m can be fitted by dust at T=18 K. Neininger et al. (1996) observed NGC4565 at 1.2mm. The emission is seen to follow the molecular gas in the inner part of the galaxy and the HI at the periphery. The radial gradient at 1.2mm is shallower than those previously observed in the range 50-200m from IRAS and KAO. This is a clear signature of dust heated by the ISRF. The dust temperature in the centre of the galaxy is T=18K. Colder dust temperatures (T=15K) are observed in a plateau at a distance of 12 kpc from the galactic centre, in correspondence with the peak of HI emission. Dumke et al. (1997) observed NGC 5907 at 1.2mm. The dust emission follows the gas, but is also present at larger distances from the centre, where no CO is observed. Comparing the total flux with IRAS data, a cold dust component with a mean temperature of 18K is necessary to fit the spectrum, the warmer dust detected by IRAS being unable to explain the observed emission at 1.2mm. From an analysis of the radial profiles, a slight temperature gradient is inferred, with T dropping from 20K in the centre to 16K in the outer disk.
As suggested by Chini et al. (1995) more precise temperature estimates than using IRAS and millimetre fluxes are possible when data around the peak of dust emission are available. Data in this spectral range have been made available by the ISOPHOT instrument (Lemke et al. 1996) on board of the Infrared Space Observatory (ISO; Kessler et al. 1996). Krügel et al. (1998) observed three quiescent and three active galaxies with ISOPHOT, obtaining data between 60 and 200m. In combination with fluxes at 1.3mm, they found evidence for large amounts of cold dust in the inactive galaxies, with temperatures T=10K or smaller. Compared to estimates made without ISO data, the mass of dust is increased by a factor of three.
Alton et al. (1998a, see also for NGC 6946) present resolved images of a sample of 8 nearby galaxies, observed with ISOPHOT at 200m. Apart from consideration of the extent of the dust emission, which are reported in Sect. 1.6, they infer a mean grain temperature between 18 and 20K, using the IRAS 100m data together with their 200m fluxes. Temperatures are about 10K lower than those based on IRAS data only. Consequently, the dust mass is increased by an order of magnitude. Using literature values for the gas masses, they derived a mean gas-to-dust mass ratio of 220, much closer to the Galactic value than those derived by Devereux & Young (1990a). The results hold even when a possible error of 30% in the ISO photometric calibration is taken into account.
Similar results come from ISOPHOT observation at 175m of M31, the Andromeda galaxy (Haas et al. 1998). A dust temperature of 162 K is fitted to the ISO data and to DIRBE data at 140 and 240m reported by Odenwald et al. (1998). The dust mass is boosted up by an order of magnitude with respect to the IRAS value, thus bringing the dust-to-gas ratio to 130, close to the determination of Sodroski et al. (1994). If the dust is assumed to be distributed in a thin slab for the inner 10 kpc, a mean face-on optical depth can be derived. This agrees with the mean values inferred by Xu & Helou (1996b), derived from an energy balance method (Sect. 3.2).
Alton et al. (1998b) observed NGC 891 with the sub-mm camera SCUBA at 450 and 850m. After smoothing the images to a resolution common with 60 and 100 m High Resolution (HiRes) IRAS images, they find a cold dust component of 15K, together with a hot component of 30 K necessary to fit the 60 m flux. An approximate distribution of cold dust is retrieved fitting the two temperatures model to the spectra for each of 6 radial bins at different distances from the centre of the galaxy. It is found that the cold component contributes increasingly with the galactocentric distance to the dust mass in each bin.
Odenwald et al. (1998) searched in the COBE DIRBE all-sky survey (with a beam size of 0.7∘x0.7∘), for all galaxies with locations listed in the IRAS Catalog of Extragalactic Objects and the Centre for Astrophysics Catalog of Galaxies. They found 57 galaxies, of which only 7 had available fluxes for m. Their spectra could be fitted by a cold component of T=20-25 K, and a possible weak very cold component of T=10-15 K. The very cold component contributes usually only up to 15% of the total dust mass. Only two of the seven galaxies are not compatible with a cold component spectrum only.
Most of the work on spiral galaxies presented in this section makes use of observations coming from different broad-band instruments to derive flux ratios and dust temperatures. Temperatures would be better determined from spectra of FIR emission (like in the Reach et al. 1995 work on the FIRAS Galactic spectrum). The Long Wavelength Spectrometer (LWS) (Clegg et al. 1996), aboard the satellite ISO, cover the spectral range between 40 to 200 m. Although a more extended coverage of the long wavelength range would be desirable, dust temperatures as cold as 15K can be derived from the spectrum shape.
Braine & Hughes (1999) observed the centre of NGC4414, within the 100” LWS aperture. A temperature T=24.5 K for the cold component is derived. Comparing the LWS data with IRAS fluxes and 1.3mm images covering a larger area, they infer a gradient in the dust temperature, with colder dust at larger radii. Trewhella et al. (1999) observed five galaxies positioning the LWS aperture in the centre and at different position along the galactic disk. Although work is in progress, the spectra on the centres suggest temperatures T= 30-35 K, with emission peaking at 100m, while for the outer regions the spectra are flat, or still rising out to the maximum LWS wavelength. Spectra of the outer regions are compatible with TK.
As shown in this Section, the problem of the lack of dust resulting from the use of IRAS data only is solved when observations at 100 m are available. A cold (TK), massive ( 90% of the total dust mass) component is necessary to explain the FIR and sub-mm emission, in the Galaxy as well in other external spirals. The measured dust temperatures and the gradient of its radial distribution (observed in the Galaxy and also in other spiral, thanks to new high resolution and sensitivity sub-mm instruments) indicates that the cold component is heated by a diffuse ISRF. Since diffuse dust is the main contributor to extinction, FIR observation around the peak of dust emission (100m-300m) can be used to assess the opacity of a galaxy (Reach et al. 1995).
1.5 Heating mechanisms
While it is accepted that starlight is the major source of dust heating in normal non-active spiral galaxies, there is controversy about which stellar population is the main contributor to the process. If young, high-mass stellar objects are the main contributor, it would be possible to derive the rate of recent star formation directly from the FIR emission. This would be highly desirable, since observations of FIR emission from spiral galaxies are more readily available than those of other tracers of star formation, like H emission (Devereux & Young 1991). Instead, if the diffuse ISRF from an older stellar population is the main source of heating, estimates of star formation rates from FIR emission would be severely biased.
Devereux & Young (1990b) claim that the correlation between the FIR and the molecular gas, as well as the correlation with the non-thermal radio emission support the first hypothesis. They compare FIR and H luminosities for a sample of 124 spiral galaxies bright in the IRAS bands. L(H) and L(40-120m), derived from 60 and 100m IRAS fluxes, correlates, with a mean L(H)/L(40-120m). If all the radiation from the star in a HII region is supposed to be absorbed and re-emitted in the FIR, the FIR luminosity is analogous to the bolometric luminosity of the heating star Lbol. The ratio L(H)/Lbol can be therefore computed for any spectral type of ionising stars, after assuming standard conditions for the HII regions. The measured L(H)/L(40-120m) in their sample of spirals is consistent with stars of spectral type O9 being the main source of dust heating.
In two successive works, they analyse FIR and H emission in two galaxies, M51 (Devereux & Young 1992) and NGC 6946 (Devereux & Young 1993). A good correlation is found in the two objects between H emission, H2 column density and FIR emission (at 170m for M51 and 160m for NGC 6946), while the atomic hydrogen presents a central depression. Temperatures derived from 60 and 100 m IRAS fluxes are quite constant all over the galaxy (32-33K and 27-28K, for and 2, respectively). A total FIR luminosity is obtained from the IRAS fluxes and from the flux in the FIR image at =160-170m (they derive the temperature of the warm component from 60 and 100m fluxes and assume that 90% of dust is cold at T=14-16K, Devereux & Young 1990a. The FIR luminosity is dominated by the warm component. The ratio between the FIR luminosities and the H for several location within the galaxies is consistent with O9-B0 stars being responsible for the heating of dust.
Devereux & Young also claim that the absence of a radial gradient for the temperature can be explained by the fact that the typical temperature of dust in HII regions is not expected to depend on the position in the galaxy. Sodroski et al. (1989) show that the temperature derived from the ratio of 60 and 100 m IRAS fluxes on the Galactic plane is constant even when the FIR emission associated with the neutral gas only is considered. This suggests that stochastically heated grains provide a better explanation for the shallow temperature gradient.
For the galaxy M51, Rand et al. (1992) come to radically different conclusions about the source of dust heating. They found that the infrared excess, i.e. the ratio between the FIR flux and the flux of Ly photons (derived from the free-free continuum at 21 cm) is higher than that derived in Galactic HII regions, indicating a FIR emission not due to dust heated by photons originating in massive star-forming regions. Furthermore, they found that the arm-interarm contrast in IRAS images is always lower than for H images convolved to the same resolution. This second test too suggests that the FIR emission does not arise only from dust in star-forming regions.
Another contrasting view is offered by the two works on the Andromeda galaxy by Devereux et al. (1994) and Xu & Helou (1996a). In Devereux et al. (1994) the same arguments as in Devereux & Young (1992; 1993) are brought in favour of the FIR luminosity originating mainly from dust in star-forming regions, i.e. close resemblance of H and FIR images and the ratio between FIR and H luminosities similar to that observed in Galactic HII regions. The star-forming ring is supposed to contribute 70% of the FIR radiation. Xu & Helou (1996a) measure the ratio between the IRAS 60m and H fluxes from bright FIR-resolved sources in M31. Using the total H luminosity and the Désert et al. (1990) dust model, they extrapolate the fraction of the total FIR luminosity that is associated with HII regions and star-formation. A value of 3014% only is found.
Walterbos & Greenawalt (1996) model the FIR emission of spiral galaxies under the assumption that dust is heated by the ISRF. The amount of dust is estimated from the HI column density, assuming a constant ratio between the two, while the intensity of the ISRF is derived from the blue profile, after correcting for the inclination and the dust internal extinction. The ISRF model is then scaled on the Galactic local value and the 60 and 100m fluxes are then computed using the values tabulated by Désert et al. (1990) for their dust model heated by fractions or multiples of the Galactic local ISRF. On a sample of 20 galaxies, the modelled FIR fluxes can account for, on average, half of the observed fluxes. They conclude that the role of the ISRF in heating the dust should not be ignored.
From their decomposition of the Galactic FIR emission Sodroski et al. (1997) conclude that the main contributor is dust associated with atomic gas (55-65%). The dust associated with the molecular phase contributes 30-35% of the FIR emission. It is believed that FIR emission within the H2 gas comes in part from dust heated by the ISRF and in part by OB stars. The HII component contributes only to 5-10% of the total FIR. They conclude that since 55-85% of FIR emission is not associated to HII or to OB stars heating within the H2 component, it is not safe to use the FIR to derive star-formation rates.
Among the papers presented in this Section, the main evidence in favour of the dust heating by high-mass stars is the correlation between the FIR and H emissions. This may simply be a reflection of the local density of the interstellar medium, both star formation (and H emission) and FIR emission being stronger in regions of high density. The problem could be solved by decomposing the FIR emission into the different sources of heating. Because of the lack of high-resolution observations, this is possible only on large objects. Observations of the Galaxy and M31 favour the hypothesis of a FIR emission arising mainly from ISRF heated dust. It is then interesting to note that the works in favour of the high-mass star hypothesis presented here are mainly based on IRAS observations. As shown in Section 1.4, dust emitting for m is likely to be heated by a diffuse IRSF.
1.6 Evidence for extended dust distributions
In recent years new evidence has emerged that shows how galactic disks extend beyond the dimensions inferred from the luminous stellar distribution. Molecular clouds and associated HII regions has been observed in our Galaxy, at distances between 18 and 28 kpc, more than twice the Sun galactocentric distance (De Geus et al. 1993, Digel et al. 1994). HII regions beyond the optical radius (, the radius corresponding to the 25 mag arcsec-2 isophote in the B-band) have been observed in deep H images of three spiral galaxies (Ferguson et al. 1998b; a).
Because of the tight correlation between B-I colour excess and gas column density (Sect. 2.2), dust might be expected to be present at large distances as well. A few studies of extinction in spiral galaxies suggest larger exponential scalelengths for the dust distribution with respect to the stellar. Peletier et al. (1995) analyses the ratio between the B and K radial scalelength for a sample of 37 galaxies. Assuming an intrinsic ratio 1.2, due to stellar population gradients, a larger observed ratio can be caused by dust extinction, that makes the B profile flatter, leaving the K scalelength substantially unaltered, because of the small opacity at larger wavelengths. Comparing the observed ratios of 1.3 for face-on galaxies and 1.7 for edge-on with the results of an absorption (without scattering) model for dust and stellar exponential distributions, they find consistent results for exponential dust scalelengths larger then twice the stellar. A similar model is compared to J- and V-band images of edge-on spirals by Ohta & Kodaira (1995): for one of three galaxies (NGC 4565), the dust scalelength is found to be twice the stellar. A more complete radiative transfer model, inclusive of scattering and spheroidal distributions for stellar bulges is fitted to edge-on galaxies surface photometry by Xilouris et al. (1999). For a sample of six objects observed in several optical bands (and two of them also in the Near Infrared), they derived a mean dust/star scalelength ratio of 1.5.
A close correlation has been found for the V-I colour of background galaxies seen in projection along the disk of M31 and the local hydrogen column density, on a field at a distance of 23kpc from the centre, outside the optical radius of the galaxy Lequeux & Guelin (1996). The result implies a substantial dust reddening ( mag). The colour-magnitude diagram of the galaxy’s stars in the field reveals blue stars and therefore massive star formation.
FIR observations of dust emission confirm the presence of extended dust distributions. Davies et al. (1997) use observations at 140m and 240m from the DIRBE instrument aboard COBE to model the dust emission. Adopting a double exponential model for the dust and a dust temperature spatial distribution inferred from observations, they produce maps of FIR emission and temperature as a function of Galactic latitude and longitude. The observed emission and temperature can be matched by the model only for a dust disk with a radial scalelength 1.5 times the stellar. The vertical scalelength of dust is found larger than the stellar as well. The Davies et al. model suggest a dust layer twice as thick as the stellar disk.
The most striking evidence for a large dust distribution comes from ISO observations at 200m (Davies et al. 1999b, Alton et al. 1998a). Alton et al. (1998a) compared the optical (B-band) and FIR scalelength at 60 and 100m derived from high resolution HiRes IRAS images with 200m images of seven resolved spiral galaxies, observed by the instrument ISOPHOT aboard ISO. To be sure to compare emission coming from the same galactic structures, all the images have been smoothed to the poorer ISO resolution (FWHM=117”). It is found that IRAS scalelengths are generally smaller than the optical. On the contrary, the 200m ISO profiles are shallower, with an exponential scalelength 1.3 times the one measured in B. The dust temperature in the centre of a galaxy is warmer, because of the higher Interstellar Radiation Field. Therefore, for a given dust scalelength, the scalelength of the FIR emission should be smaller, because of the steep dependence of the emission on the temperature (Sect. 2.3). An emission scalelength larger than the optical can thus be produced only if the dust spatial distribution is more extended than the stellar (as traced by the B-band emission). A proper analysis would require a detailed modelling of the heating by the ISRF at any position along the dust distribution. This is actually the purpose of this Thesis.
A confirmation of the large extent of dust disks in spiral galaxies comes from the work of Nelson, Zaritsky & Cutri (1998). They selected isolated spiral galaxy using the 100m IRAS SKY Survey. Three samples are defined, classifying the objects on the basis of their optical radius (10’-30’,5’-10’,2.5’-5’). For each sample, a coadded image was produced, after rescaling each object, rotating it according to its position angle, subtracting the sky and normalising the flux. An image of the PSF is constructed coadding images of two control samples of stars and unresolved galaxies. After subtracting the PSF, they find residuals of 100 m extended emission in the two samples of galaxies of larger dimensions. Using literature data for stellar disks, they derived a mean 100 m scalelength equivalent or up to a factor of 2 smaller than the stellar scalelength. A simple model shows that this implies a dust spatial distribution less concentrated than the stellar.
As well as along the disk, there are suggestions for extended distribution above the galactic plane. Zaritsky (1994) reports a preliminary detection of a dusty halo, through the colour excess of background object in fields close to two galaxies, with respect to fields at larger distances. Though, the measured colour excess is only twice as large as the rms coming from the intrinsic dispersions of the background object colours. A large number of objects is necessary to produce a statistically convincing result. Lequeux et al. (1995) and Lequeux et al. (1996) apply the same technique to two galaxies, but without producing statistically robust results, the largest colour difference being always smaller than 3. The only positive detection of a colour excess is the one reported for in the already cited work of Lequeux & Guelin (1996), but for a field along the galactic plane and thanks to a corroborating correlation with the gas column density.
As I have shown in this Section, detection of star-formation at large distances from the galactic centre, models of dust extinction and FIR emission, observation of FIR dust scalelengths, all point towards the existence of extended distributions of dust in spiral galaxies, more extended than the stellar disk. if this is the case, the study of the distant universe might be severely biased by dust extinction. However, the only direct detection of extended dust through the extinction of background objects is not statistically robust.
1.7 Plan of the Thesis
The work presented in this Thesis consists of a self-consistent model for the radiative transfer and the dust emission in spiral galaxies. I will adopt the energy balance method (Sect. 3.2), within which the FIR emission is directly compared to the stellar emission to derive the extinction. The simulation also gives the dust temperature distribution and the emission at different FIR wavelengths. Results of the models will be compared to observation, to address some of the topics presented in this Introduction, mainly: i) are spiral galaxies optically thin or thick? ii) Can the SED of FIR emission be explained advocating only the ISRF as the source of dust heating? iii) What kind of extended distributions of dust are needed to explain the observed spatial distribution of FIR emission?
Apart from Chapter 1, the present Introduction, this Thesis is organised in the following Chapters:
-
2.
Dust properties: extinction and emission Basic theory of dust extinction and emission is presented, especially those formulae that are used elsewhere in the Thesis. The adopted dust parameters are presented, together with an original determination of the dust emissivity, based on Galactic extinction and FIR emission. The fraction of absorbed energy re-emitted in the Mid-Infrared is estimated.
-
3.
The radiative transfer and dust emission model First I review radiative transfer and FIR emission models available in the literature. I then describe the adopted distribution for the stars and the dust in the model of the galaxy. Finally, the radiative transfer and dust emission model developed for this Thesis is presented. The adopted procedure is described with the help of example program outputs.
-
4.
Modelling NGC 6946 The model is finally applied to the spiral galaxy NGC 6946. Optical and FIR observation from the literature are used to derive the stellar and dust Spectral energy Distribution (SED). Observation of NGC 6946 carried out at the James Clark Maxwell Telescope (JCMT), using the Sub-millimetre Common User Bolometer Array (SCUBA) in June 1998 are presented here. Several models for the dust distribution are discussed, in the quest for a match with the observed FIR SED and spatial distribution of emission.
-
5.
Conclusions
During the period of my PhD, I have also worked on two other projects, that are presented in the Appendices: Appendix A SCUBA imaging of NGC 7331 dust ring is dedicated to sub-mm observation of the spiral galaxy NGC 7331, that I have carried out in October 1997 at the JCMT using SCUBA. A dust ring, also detected in an optical-NIR colour image, has been revealed.
In Appendix B Search for dust in the halos of spiral galaxies I report on the attempt to measure the colour differences of objects in the background of two nearby edge-on spiral galaxies, following the Zaritsky (1994) technique, as outlined in Sect. 1.6. Unfortunately both the observing runs I attended at the Isaac Newton Telescope (November 1996 and December 1997 - January 1998) were undermined by bad weather and it was not possible to detect a sufficiently large number of objects to produce sound results. I have detected a faint extended luminous halo around the galaxy NGC 891 (Sect. B), similar to that observed in NGC 5907 (Sackett et al. 1994, Lequeux et al. 1996).
Chapter 2 Dust properties: extinction and emission
In this chapter I give a brief description of dust properties: the main aim is that of introducing the definitions and the parameters used later on in the radiative transfer model. A particular emphasis is given to the derivation of the dust emissivity presented in Sect. 2.4, an original contribution of this work.
2.1 Dust extinction
If a light ray travels through a length in a dusty medium with a grain number density , its specific intensity (energy emitted per unit time, area, wavelength band and solid angle, also called surface brightness) is attenuated by a quantity
| (2.1) |
where is the extinction cross section of dust for radiation at wavelength . The extinction cross section is usually written as
| (2.2) |
the product between the geometric cross section of a grain of radius and the extinction efficiency .
Dust extinction involves two different processes, absorption and scattering: in the former, photons are actually absorbed by the dust grain and goes into its heating (and the related emission, Sect. 2.3); in the latter radiation is re-directed along directions different from the incident one. Therefore, the extinction efficiency can be split in two terms describing the contributions from each of these two processes:
| (2.3) |
The fraction of the extinguished radiation that is diffused by scattering is given by the albedo
| (2.4) |
The angular distribution of the scattered radiation is described by the phase function , that, for spherical grains, is a function of the scattering angle only, i.e. the angle between the incident and the scattered direction. The directionality of the phase function is characterised by the asymmetry parameter , that is the mean of over ,
| (2.5) |
A general solution for the extinction efficiency, albedo and phase function can be found in principle for any grain shape and , if the optical properties (i.e refractive index) of the material are known (Van De Hulst 1957, Bohren & Huffman 1983). The solution for spherical grains goes under the name of Mie Theory (Mie 1908).
For a point source, the solution of the radiative transfer (Eqn. 2.1) is
| (2.6) |
where is the intrinsic intensity of the source and the optical depth of the dusty medium between the source and the observer (along the line of sight), given by
| (2.7) |
Under the assumption that grain properties do not change along the line of sight,
| (2.8) |
with the dust column density. A common parameter used to describe the attenuation properties of dust is the extinction ,
| (2.9) |
Eqn. (2.6) and (2.9) are only valid under the assumption of a point source hidden by a layer of dust. In the case of extended sources with intermixed dust, like in the common geometries used to describe galaxies, radiation can be scattered into the line of sight, thus adding a positive term to Eqn. (2.1). In this case, the simple relation between optical depth, intrinsic and observed radiation as in (2.9) will not hold. It is difficult to solve analytically the radiative transfer equation in spiral galaxies including scattering, unless there is a simplification of the geometry (Bruzual et al. 1988) or approximations are made in the treatment of the scattering (Byun et al. 1994). An exact treatment of scattering is possible, in principle, for any geometry by using Monte Carlo methods (Witt et al. 1992, Bianchi et al. 1996, See also Sect. 3.1).
2.2 Assumed parameters for extinction
It is possible to measure the extinction law, i.e. the variation of extinction with the wavelength , comparing the extinction towards stars of the same spectral type. In Fig. (2.3) (data points) the mean Galactic extinction law from Whittet (1992) is plotted in the form of normalised to versus 111Usually the colour excess is plotted, normalised to . For the normalised colour excess tends to the value (for the mean Galactic extinction law ). The ratio can be derived from the normalised colour excess using the measured value for . Alternatively, the ratio between optical depth and hydrogen column density is plotted. Bohlin et al. (1978) found a correlation between the column density of interstellar hydrogen (atomic + molecular) as measured in UV absorption spectra towards a sample of 96 stars and the colour excess E(B-V), (2.10) Using the mean Galactic extinction law, Eqn. (2.10) gives (2.11) The ratio can then be converted to . The ratio can be easily found from Eqn. 2.11 and Eqn. 2.8, and hence the gas-to-dust mass ratio, if , the grain dimension and density are known. Assuming , m and g cm-3 (Hildebrand 1983), the local gast-to-dust mass ratio is 130. . The mean Galactic extinction law is measured along several line of sight through the Galaxy. Its main characteristics are the linear (versus ) growth in the optical, a bump at 2175Å and a steeper rise at shorter wavelength in the far-UV (a more detailed description can be found in Sect. (2.5)). There are local variations of the mean extinction law, mainly consisting in the change of strength of the 2175Å bump and in the Far-UV slope.
As for external galaxies, extinction laws have been directly measured only towards stars of the Magellanic Clouds. In the LMC the curve is quite similar to the Galactic one, apart from the star forming region 30 Doradus, where the bump is weaker and the far-UV rise steeper. The SMC extinction law is characterised by the absence of the bump and the steep far-UV rise (Whittet 1992, Gordon et al. 1997, and references therein). The lack of the 2175Å bump has been noted in starburst galaxies (Calzetti et al. 1994, Calzetti 1997). The weakening of the bump can be due to the differential effects of scattering and absorption (Cimatti et al. 1997), but Gordon et al. (1997) argue that the absence in starbursts is due to a real absence of bump-carrier grains. The bump has been observed in high-redshift Mg2 absorbers (Malhotra 1997). Extinction laws in the optical show smaller differences. Applying a radiative transfer model to seven edge-on galaxies, Xilouris et al. (1999) find an extinction law similar to that of the Galaxy longward of the U-band. Since I am interested in modelling normal galaxies, rather than starbursts, in this work I use the Galactic extinction law, as given by Gordon et al. (1997).
The scattering properties of dust, i.e. albedo, asymmetry parameter and phase function, can be in principle derived from dust extinction models (see, for example Draine & Lee 1984, Bianchi et al. 1996). For the sake of simplicity and due to the uncertainties in current models, I prefer to use the empirical determination of albedo and asymmetry parameter for Milky Way dust in reflection nebulae, given by Gordon et al. (1997). Witt & Gordon (1996) point out that the presence of clumps in dust may bias the derived albedos toward lower values, since observational data are always analysed in the framework of homogeneous radiative transfer models.
For the phase function, I use the analytical expression derived by Henyey & Greenstein (1941) relating the angular distribution of the scattering angle to the asymmetry parameter :
| (2.12) |
Values for the extinction law, albedo and asymmetry parameters used in this thesis are given in Tab. (2.1), for the bands defined in Sect. 3.8. Values are taken from Gordon et al. (1997) apart from the bands EUV and LMN. The extinction law for these two bands has been taken from Whittet (1992) and Rieke & Lebofsky (1985), respectively. Albedo and asymmetry parameter for the EUV band are from Witt et al. (1993) data at 1000Å while for the LMN band they have been assumed equal to those in the K band. The directionality of scattering for an Henyey-Greenstein phase function is shown in Fig. (2.1), for a few values of the asymmetry parameter as in Tab. (2.1) and for the isotropic case (=0).
band EUV 4.34 0.42 0.75 0.72 UV1 3.11 0.60 0.75 0.54 UV2 2.63 0.67 0.75 0.44 UV3 2.50 0.65 0.73 0.47 UV4 2.78 0.55 0.72 0.58 UV5 3.12 0.46 0.71 0.65 UV6 2.35 0.56 0.70 0.54 UV7 2.00 0.61 0.69 0.43 U 1.52 0.63 0.65 0.36 B 1.32 0.61 0.63 0.28 V 1.00 0.59 0.61 0.23 R 0.76 0.57 0.57 0.18 I 0.48 0.55 0.53 0.14 J 0.28 0.53 0.47 0.12 H 0.167 0.51 0.45 0.12 K 0.095 0.50 0.43 0.12 LMN 0.04 0.50 0.43 0.12

2.3 Dust emission
The energy absorbed from photons heats up dust grains and is successively re-emitted in the infrared, preferentially at m. If the energy of each photon impinging on a dust grain is small compared to the internal energy of the grain itself, the radiation is emitted at the thermodynamic equilibrium. This is not the case for small grains absorbing high energy photons: I discuss this in Sect. 2.5. In this section I will consider only processes at the thermodynamic equilibrium.
The power emitted by a dust grain at a temperature can be expressed as
| (2.13) |
where is the Plank function at the wavelength and is the emission efficiency (or emissivity). By Kirchhoff’s law, . At long wavelength scattering efficiencies are negligible compared to absorption (e.g. for the Mie theory while ) and therefore .
The emissivity in the infrared, is usually described by a function of the form
| (2.14) |
where is the value of the emissivity at the reference wavelength , and is the wavelength dependence index. A more detailed description, together with a new derivation of is presented in the next section.
Substituting Eqn. (2.14) in Eqn. (2.13) the emitted power is
| (2.15) |
The function is
| (2.16) |
The integral in Eqn. (2.16) results from the substitution and has the analytical solution , with the Riemann function.
As evident in (2.15), the radiated power is strongly dependent on the temperature of dust, thus colder grains radiate at a much smaller rate. By analogy with the Wien displacement law, the peak of the emitted radiation will occur at
| (2.17) |
The rate of absorbed energy can be computed, if both the radiation field in which the grain is immersed and an expression for the absorption efficiency are known. For a dust grain in the general interstellar radiation field
| (2.18) |
where and are the mean temperature and dilution factor of the general interstellar radiation field. These parameters define the interstellar radiation field as the field produced by a collection of star with effective temperature that covers a fraction of the celestial sphere. A typical interstellar radiation field has K and (Disney et al. 1989).
A crude approximation would be to extend the validity of the expression for as in Eqn. (2.14) to the wavelength range were the interstellar radiation field spectrum peaks (i.e. in the optical and UV). This would give as a result
| (2.19) |
At the thermodynamic equilibrium the principle of detailed balance imposes the rate of absorbed energy to be equal to the rate of emitted energy: equating Eqn. (2.19) and Eqn. (2.15) the dust temperature is
| (2.20) |
Using (a valid approximation for in the optical and in the infrared shortward of 100 m; see next section) a temperature 16 K is obtained (Van De Hulst 1946). Following Eqn. (2.17) it can be seen that the emission of dust at this temperature peaks at , i.e. in the Far-Infrared. Similar temperatures are found using more complex models for (Draine & Lee 1984) and from observations of the the Galaxy (Sect. 2.4). If the dust grain lies in a region denser in stars than the mean interstellar field the dilution factor would be larger, resulting in an increased dust temperature and in an emission peaking at shorter . Eventually, for circumstellar dust, the temperature could rise to the sublimation temperature of the grain, causing is destruction.
Dust grains can be heated also by collision with gas atoms: this process is normally negligible and the dust temperature is almost entirely determined by radiative processes (Spitzer 1978).
If a region of space is occupied by grains of radius , number density and thermal equilibrium temperature , the emission coefficient (energy emitted per unit time, volume, solid angle and wavelength) can be written as
| (2.21) |
An external observer would see a specific intensity that, assuming the region is transparent () to radiation in the wavelength range of dust emission, can be obtained integrating along the line of sight
| (2.22) | |||||
As already said, in the wavelength range of dust emission scattering is negligible and . Therefore, using Eqn. (2.8), Eqn. (2.22) can be rewritten as
| (2.23) |
I will make use of Eqn. (2.23) in the next Section.
2.4 A new determination of dust emissivity
I have derived the dust emissivity in the Far-Infrared (FIR) using data available in the literature. I use two wavelength dependences derived from spectra of Galactic FIR emission (Reach et al. 1995). A value for the emissivity, normalised to the extinction efficiency in the V band, has been retrieved from maps of Galactic FIR emission, dust temperature and extinction (Schlegel et al. 1998).
The results presented here are similar to other measurements in the Galaxy but only marginally consistent with the widely quoted values of Hildebrand (1983) derived on one reflection nebula. The discrepancy with measurements on other reflection nebulae (Casey 1991) is higher and suggests a different grain composition in these environments with respect to the diffuse interstellar medium.
I measure dust masses for a sample of six spiral galaxies with FIR observations and obtain gas-to-dust ratios close to the Galactic value.
2.4.1 Introduction
Assessing the quantity of dust in spiral galaxies is of primary importance in both understanding the intrinsic properties of galaxies themselves and interpreting observations of the distant universe: large quantities of dust can modify the optical appearance of galactic structures like spiral arms (Trewhella 1998a); if the distribution of dust is extended, a large fraction of the radiation from the distant universe can be blocked (Ostriker & Heisler 1984); star formation as determined from UV fluxes could be severely underestimated thus altering our knowledge of the star formation history of the universe (Hughes et al. 1998a).
Dust mass can be retrieved from extinction or from emission in the FIR. In the former case information about the star-dust relative geometry is needed and the method can only be applied to nearby edge-on galaxies, where the dust distribution can be inferred from extinction features (Xilouris et al. 1997; 1998). In the latter case there are no such limitations, and the wealth of data in the FIR and Sub-mm from instruments like the Sub-mm camera SCUBA and from the satellites ISO and COBE, can be used to measure dust mass. Unfortunately, the determination of dust mass is entangled with that of dust temperature and they both rely on knowledge of the dust emissivity (Hildebrand 1983), the form of which is currently highly uncertain.
Usually the emissivity is described by Eqn. 2.14, with values of between 1 and 2. While a value seems to be plausible for m (Hildebrand 1983, Rowan-Robinson 1992), there is observational evidence for a steeper emissivity at longer wavelengths. The difference in emissivity is not unexpected, since emission in the Mid-Infrared (25-60 m) is dominated by transiently heated grains, while at m grains emit at thermal equilibrium (Whittet 1992). Sub-mm observations of spiral galaxies (Bianchi et al. 1998, Alton et al. 1998b)) show that it is not possible to use an emissivity with to fit the 450 and 850 m emission. Reach et al. (1995) came to a similar conclusion. They used the spectrum of the Galactic plane observed by the spectrophotometer FIRAS on board the satellite COBE, to find that the data are well fitted by an emissivity:
| (2.24) |
for the range 100 m to 1 cm. Eqn. (2.24) behaves like (2.14) with at small () and at large () (they set -m).
Masi et al. (1995) measure a value by fitting a single temperature grey-body spectrum to Galactic plane data in four bands between 0.5 and 2-mm taken by the balloon born telescope ARGO. Reach et al. (1995) suggest that a single temperature fit may bias towards lower values of (see also Wright et al. 1991); over the whole FIRAS spectral range, a two temperature grey-body with at large provides a significantly better fit than a single temperature spectrum with . At long wavelengths theoretical calculations for crystalline substances constrain to be an even integer number Wright (1993). For amorphous materials depends on the temperature: Agladze et al. (1996) find for amorphous silicate grains at a temperature of 20 K.
A value for the emissivity at a specific wavelength normalised to the extinction efficiency in the optical can be determined by carrying out an energy balance in a reflection nebula, comparing the energy absorbed from the central star with the FIR output from the surrounding dust. Alternatively, the extinction measured toward the star can be directly compared to the optical depth in the FIR (Whitcomb et al. 1981, Hildebrand 1983, Casey 1991). These methods are complicated by the unknown nebular geometry and by temperature gradients in the dust; as an example, Casey (1991) found that the extinction method usually retrieves higher values than the energy balance.
In this section I use the extinction method comparing the Galactic extinction to FIR emission: in this case the same column density of dust is responsible both for emission and extinction and a reliable result can be obtained.
2.4.2 The method
Schlegel, Finkbeiner & Davis (1998, hereafter SFD) have presented a new map of Galactic extinction. After removing emission from zodiacal light and a cosmic infrared background, they have combined the 100 m map of Galactic emission taken by the DIRBE experiment on board the COBE satellite with the 100 m large-area ISSA map from satellite IRAS, to produce a map of Galactic emission with the quality calibration of DIRBE and the high resolution of IRAS. The dust temperature has been retrieved using the DIRBE maps at 100 m and 240 m assuming =2. Knowing the temperature, the 100 m map has been converted into a dust column density map and subsequently calibrated to E(B-V) using colours and Mg2-index of elliptical galaxies. I would like to stress that the colour excess has been derived from the 100 m emission without any assumption about the value of the emissivity at any wavelength. Moreover, the choice of does not affect significantly their results: when =1.5 is used, the dust column density map varies only of 1%, aside from an overall multiplicative factor that is taken account of when calibrating with the colour excess. I have accessed the electronic distribution of this remarkable dataset to retrieve the 9.5 arcmin/pixel maps of the intensity at 100 m, I(100 m), the temperature and the colour excess E(B-V) for the north and south Galactic hemispheres.
When the same dust grains are responsible for emission and extinction, the ratio between the extinction coefficient in the V-band and the emissivity at 100 m is equivalent to the ratio of the optical depths
| (2.25) |
The above formula is correct if all of the dust grains are identical. In a mixture of grains of different sizes and materials, the ratio of emissivities in Eqn. (2.25) can still be regarded as a mean value characteristic of diffuse galactic dust, if the dust composition is assumed to be the same on any line of sight.
The optical depth at 100 m, in the optically thin case, is measured using
| (2.26) |
where is the value of the Planck function at for a dust temperature , both the intensity and coming from the maps of SFD222The assumption of an optical thin medium for FIR radiation is always valid in a spiral galaxy. The mean optical depth for the 100m radiation over a region of 20∘ around the Galactic poles, derived from the SFD maps, is 2.5 10-5. The maximum on the Galactic plane is 0.14. An optically thin emission is also derived by Sodroski et al. (1994; 1997).. The optical depth in the V-band can be found from the colour excess E(B-V) maps,
| (2.27) |
where I have used a mean galactic value =3.1 (Whittet 1992). Reach et al. (1995) suggest that dust emitting in the wavelength range 100-300 m traces interstellar extinction. Since the FIR optical depth in Eqn. (2.26) has been measured using data at 100 and 240 m, it is then justified to compare it with extinction as in Eqn. (2.27) to find the ratio of the extinction coefficient and emissivity. Knowing the optical depths from (2.26) and (2.27), I can compute a map of the ratio as in Eqn. (2.25); I obtain a mean value of
| (2.28) |
for both hemispheres. This value is included, together with other multiplicative factors, in the calibration coefficient as in Eqn. (22) in SFD. An estimate for can be easily derived from that equation, if the DIRBE colour corrections factors, slowly depending on T, are omitted. Following this method I obtain a value of 765.5. SFD give an error of 8% for and this is the value quoted here. Since most ( 90%) of the elliptical galaxies used to calibrate colour excess maps have galactic latitude , one may argue that the measured value is characteristic only of high latitude dust.
Reach et al. (1995) find that the emissivity (Eqn. 2.24) is best determined by fitting the FIRAS spectrum on the Galactic plane. They say that high latitude data have a smaller signal-to-noise ratio and can be fitted satisfactory with (Eqn. 2.14) although the same emissivity as on the plane cannot be excluded. Under the hypothesis that the same kind of dust is responsible for the diffuse emission in the whole Galaxy, I have corrected SFD temperatures using Reach et al. emissivity (Eqn. 2.24). The new temperatures are a few degrees higher than those measured with (as an example the temperature passes from a mean value of 18K in a 20∘ diameter region around the north pole to a new estimate of 21K). It is interesting to note that the difference between the two estimates of temperature is of the same order as the difference between the temperatures of warm dust at high and low Galactic latitude in Reach et al. (1995) and this may only be a result of the different emissivity used to retrieve the temperature.
When the correction is applied
| (2.29) |
The new ratio is about three times higher, and this is a reflection of the change of temperature in the black body emission in (2.26): for a higher temperature, a lower emissivity in the FIR is required to produce the same emission. Uncertainties in are thus greatly affected by assumptions about the emissivity spectral behaviour.
2.4.3 Comparison with other measurements
I now compare the emissivity for with literature results derived under the same hypothesis. Since no emissivity has been derived to my knowledge assuming Eqn. (2.24), I do not attempt any comparison with that result. All the data are scaled to m.
Studying the correlation between gas and dust emission from FIRAS and DIRBE, Boulanger et al. (1996) derived an emissivity cm2 at 250 m for dust at high galactic latitude; assuming the canonical cm-2 mag-1 and =3.1 (Whittet 1992), this is equivalent to =790. Lagache et al. (1999) have analyzed again the HI/FIR correlation, decomposing the FIR emission into two components, associated to neutral gas and the Warm Ionized Medium. They found cm2 and cm2 at 250 m. These values correspond to = 90090 and 790160, if we assume that the same ratio can be used for dust associated with ionized gas as well as for the atomic. Lagache et al. (1999) argues that the different emissivities in the two components may be due to a smaller cutoff in the large grain size distribution for dust within the hotter ionized medium. Nevertheless, the two values are consistent with each other.
Quite similar values are found in the Draine & Lee (1984) dust model, which has a spectral dependence in this wavelength range. At 125 m the optical depth is cm2 which corresponds to =680. Sodroski et al. (1997) find a value for the ratio at 240 m, using literature data identifying a correlation between B-band extinction and 100 m IRAS surface brightness in high latitude clouds, assuming a dust temperature of 18 K. Converted to my notation, using a standard extinction law, the ratio is =990.
The measurement by Whitcomb et al. (1981) on the reflection nebula NGC 7023 is the most commonly quoted value for the emissivity (Hildebrand 1983). Their value derived at 125 m for is only marginally consistent with my result. Following my notation, their result is equivalent to 220 and 800333Whitcomb et al. (1981) and Casey (1991) originally presented values for : I have corrected to using the provided ., using the energy balance and the extinction method, respectively. The values obtained by Casey (1991) on a sample of five nebulae using the energy balance method are a factor of 3 smaller than the ones presented here (corresponding to 80-400).
In Fig. 2.2 I show the literature data (plotted at the wavelength they have been derived in the original papers) together with the derived emissivity laws. I have added the value for Draine & Lee (1984) model at 250 m.

2.4.4 Gas-to-dust ratio of external spiral galaxies
I now exploit the FIR emissivity derived in this work by determining dust masses for nearby spiral galaxies. Following Hildebrand (1983) dust masses can be measured from FIR emission using
| (2.30) |
where is the total flux at the wavelength , the distance of the object, the Planck function, the grain radius (0.1 m) and the grain mass density (3 g cm-3). The emissivity is derived from the ratio assuming =1.5 (Casey 1991, Whittet 1992).
Alton et al. (1998a) provide total fluxes at 100 m and 200 m from IRAS and ISO for a sample of spiral galaxies. I have derived dust temperatures and masses using =760 and 2390, for =2 and Reach et al. (1995) emissivities, respectively. Using literature values for gas masses, I have computed the gas-to-dust ratios. Values of gas masses, temperatures and gas-to-dust ratios are presented in Table 2.2.
| Galaxy | Gas Mass | emissivity (2.14) | emissivity (2.24) | ||
|---|---|---|---|---|---|
| 1010 M⊙ | T(K) | G/D ratio | T(K) | G/D ratio | |
| NGC 628 | 1.1 | 16 (17) | 90 (190) | 18 (20) | 100 (200) |
| NGC 660 | 0.91 | 19 (21) | 110 (230) | 23 (26) | 120 (250) |
| NGC 5194 | 0.75 | 18 (20) | 90 (180) | 21 (24) | 90 (190) |
| NGC 5236 | 3.5 | 19 (21) | 240 (500) | 22 (25) | 255 (540) |
| NGC 6946 | 3.0 | 17 (19) | 75 (150) | 20 (22) | 80 (160) |
| NGC 7331 | 1.0 | 17 (19) | 70 (145) | 20 (22) | 70 (155) |
The mean value of the gas-to dust ratio for the sample is 100 using Eqn. (2.14), 110 using Eqn. (2.24). Mean temperatures go from 18K with the emissivity to 21K when the Reach et al. (1995) behaviour is assumed (as for the north galactic pole in Sect. 2.4.2). Alton et al. (1998a) pointed out that ISO 200 m fluxes could be overestimated by about 30%; correcting for this I obtain a mean gas-to-dust ratio of 220-240 (for =2 and Reach et al. (1995)) emissivity, respectively). As shown above, dust masses obtained with the two methods are quite similar. This can be explained by substituting eqs. (2.25) and (2.26) into (2.30). For I can derive
| (2.31) |
where is the mean temperature of dust in the Galaxy. From the equation it is clear that the dust mass determination is insensitive to the emissivity law used, as long as the dust temperature in external galaxies and in our own are similar.
2.4.5 Conclusion
I have derived the dust emissivity in the FIR using the wavelength dependence derived from the FIR Galactic spectrum (Reach et al. 1995). The emissivity has been normalised to the extinction efficiency in the V band using dust column density maps calibrated to Galactic extinction (SFD). depends strongly on the assumed wavelength dependence. For a emissivity index I obtained
| (2.32) |
This result is consistent with other values derived from FIR Galactic emission (Boulanger et al. 1996, Sodroski et al. 1997) and with the Draine & Lee (1984) dust model. The widely quoted emissivities of Whitcomb et al. (1981), Hildebrand (1983) derived from the reflection nebula NGC 7023 are only marginally consistent with these values, while the emissivity measured by Casey (1991) on a sample of five nebulae are smaller by a factor of 3. This may suggest a different grain composition for dust in the diffuse inter-stellar medium compared to reflection nebulae.
When the wavelength dependence derived by Reach et al. (1995) on the Galactic plane is used, I obtain
| (2.33) |
I have used the derived emissivities to measure dust masses from 100 m and 200 m fluxes of a sample of six spiral galaxies (Alton et al. 1998a). I have retrieved similar dust masses with both the spectral dependences. The gas-to dust ratios of the sample (100-230) are close to the Galactic value of 160 (Sodroski et al. 1994).
Since Eqn. (2.33) has been determined using the most accurate information available for the spectrum of dust emission and for the extinction in a galaxy, I will use that emissivity law for the FIR simulation of this thesis.
2.5 The MIR correction
As seen in Section 2.3, grains emitting at the thermodynamical equilibrium are responsible for the emission in the FIR. However, if the dust grain is small, the absorption of a single high-energy photon can substantially alter the internal energy of the grain. The dust grain thus undergoes temperature fluctuations of several degrees and cools by emission of infrared radiation, mainly in the MIR range (Whittet 1992). Since in this thesis I want to model the FIR galactic emission only, I need to exclude from the total absorbed energy the fraction that goes into non-equilibrium heating. This can be done if a model of the absorption efficiency for all the dust components is known.
Désert, Boulanger & Puget (1990) built an empirical dust model to interpret both extinction and infrared emission in the solar neighbourhood and other astrophysical situations. Analysing the features in the extinction curve and in the infrared emission, they found that three dust components are needed. They are:
- Big grains:
-
classical big grains () are needed to explain the rise in NIR-Optical extinction curve and the linear rise in the UV. They suggest that big grains could be of silicate with a coating of a blacker, carbon-dominated material, since silicates alone, because of their large albedo, cannot explain extinction. Simple functions are used for the optical properties (, for , both constant for larger radii444These are the general trends predicted by the Mie theory for spherical grains in the limits of grains very small or very large compared to . The oscillating behaviour around these trends (Van De Hulst 1957) have been neglected.). Big grains are needed to explain the thermal equilibrium emission in the FIR.
- Very small grains:
-
these grains are responsible for the bump feature in the extinction curve at 2175Å. In the model they are supposed to be small graphite grains (), pure absorbers and with an absorption efficiency empirically derived fitting the bump with a Drude profile (Fitzpatrick & Massa 1988). These small grains are heated stochastically and are responsible for the infrared emission in the range .
- PAHs:
-
Polycyclic Aromatic Hydrocarbon molecules are introduced to explain the continuum emission and the Unidentified Infra-Red emission features at and the Far UV non linear rise in the extinction curve. Radii of these molecules are taken to be between and . PAHs are pure absorbers and the absorption efficiency is derived both empirically (from a fit of extinction in the FUV (Fitzpatrick & Massa 1988) ) and theoretically. The presence of PAHs features in the infrared spectra of dusty areas closely correlates with the FUV non-linear rise, but not with the presence of the 2175Å bump. This is why two small grain components are needed. Moreover, PAHs of reasonable physical dimensions cannot produce the emission in the range .
Each dust component has a size distribution described by a power law. The parameters of the model, i.e. size distributions, grain radii, albedo of big grains and relative abundances of each component, have been derived comparing the FIR output of the model heated by the Local Inter Stellar Radiation Field with observations. Using the information provided by Désert et al. (1990) I have been able to reproduce their model for the extinction curve (Fig. 2.3).


The fraction of starlight that is absorbed by small grains (both PAHs and very small grains) can be computed using the absorption efficiencies from the Désert et al. (1990) model. The extinction efficiency for all the components is
| (2.34) |
Since both PAHs and Very Small Grains are pure absorbers,
| (2.35) |
while
| (2.36) |
where is the scattering efficiency. The absorption efficiency of the dust model is therefore
| (2.37) |
and the absorption efficiency of small grains (PAHs + Very Small Grains) is
| (2.38) |
Of the light impinging on a dust grain, a fraction of energy proportional to is absorbed; the fraction of total absorbed energy that is absorbed by small grains is therefore
| (2.39) |
Values of the fraction of energy absorbed by small grains are plotted in Fig. (2.4) as a function of . Tab. (2.1) gives the values of the ratio for each of the used wavelength bands. In the model, after computing the energy absorbed by dust from each wavelength band, a fraction as in Eqn. (2.39) is excluded and is not converted into FIR emission (see Chapters 3 and 4).
2.6 Summary
In this Chapter I have introduced the dust properties used in this work. The mathematical expression for dust extinction and emission will be used in the next Chapter, to model the galactic FIR emission. An original derivation for the dust emissivity has been presented, using the best available data for the Galactic dust extinction and emission. Finally, I have evaluated the contribution of the MIR radiation from transiently-heated dust grains to the total dust emission. The purpose of this Thesis is modelling the FIR emission by dust grains at the thermal equilibrium only. The fraction of energy absorbed by grains emitting in the MIR correction will be excluded from the model using the MIR correction derived in the last Section.
Chapter 3 The radiative transfer and dust emission model
This chapter is dedicated to a description of the radiative transfer and dust emission models used in this Thesis. First, a review of previous models for the solution of the radiative transfer problem and for the simulation of dust emission in spiral galaxies is presented. I then describe observations of galactic dust and stellar geometrical distributions and I justify the parameters adopted in this work. A brief description is given of the Monte Carlo radiative transfer code of Bianchi, Ferrara & Giovanardi (1996, hereafter BFG), the backbone of the project. Finally I discuss how dust temperatures and FIR emission are derived by another code, using the map of absorbed energy produced by the Monte Carlo code.
3.1 Radiative transfer models
Several radiative transfer models are available in the literature. I describe in this section those that have been developed to simulate the extinction properties of general galactic environment.
A review of simple geometry models is given by Disney et al. (1989). They show how the early screen model with all the dust in front of the emitting source (in analogy to the first studies of extinction of Galactic stars through layers of dust), always gives higher extinction than models with interspersed stars and dust, like the slab model, where dust and stars have the same plane parallel geometry, and the sandwich model, where the dust is confined to a thinner distribution internal to the stellar one. They then present the Triple Exponential model (TRIPLEX), where the simple plane-parallel scheme is abandoned in favour of more realistic vertical and radial exponential distributions for both stars and dust (Sect. 3.3 and 3.6). The radial scalelength of dust and stars is assumed to be the same, while the vertical scalelengths of the two distribution are independent, to be able to simulate the thinner dust disk. Exact analytical solutions are provided for the face-on case, and approximations for larger inclination of the line of sight.
The models presented by Disney et al. (1989) include absorption as the only process leading to extinction. Because of the large observed values for dust albedo (Sect. 2.1) and in view of possible large optical depth inside a galaxy, any realistic models should include a treatment of multiple scattering of light by dust. Unfortunately, the scattering term makes the radiative transfer problem more complicated. A compromise between an exact treatment of scattering and a realistic galactic geometry must be adopted, if an analytical solution is to be achieved.
Bruzual, Magris & Calvet (1988) chose to adopt a simple plane parallel geometry. The scattering is dealt with in a complete form, through the solution of a system of integro-differential equations. Solutions are found for a slab geometry and a forward scattering Henyey-Greenstein phase function (Eqn. 2.12), or for a sandwich geometry and isotropic scattering. For the same geometries, Di Bartolomeo, Barbaro & Perinotto (1995) use a quickly convergent approximation to the solutions derived with the method of spherical harmonics. Corradi, Beckman & Simonneau (1996) present solution for face-on models, allowing for a dust and stellar exponential distribution but assuming a local plane parallel geometry. The solutions are therefore exact only when the mean free path of the photon is small with respect to the scale of radial variation of the stellar and dust distributions. This is not the case for optically thin regions. However in these regions the scattering events are reduced in number and the results are not greatly affected.
On the other hand, if more realistic geometries are desired, the exact treatment of multiple scattering has to be sacrificed. Kylafis & Bahcall (1987) model the surface brightness of the edge-on galaxy NGC 891 with a a three-dimensional model for dust and stars. The adopted distributions are radially exponential and behaves as a sech2 law (Eqn. 3.3) along the vertical direction. Multiple scattering is treated correctly only for the first order term, then an approximation is introduced for the higher orders. Byun, Freeman & Kylafis (1994) have generalised the method to deal with any galactic inclination. A spheroidal stellar distribution has been included to simulate the bulge. Xilouris et al. (1997; 1998; 1999) successfully applied it to the fitting of edge-on galaxies surface photometry.
Trewhella, Madore & Kuchinski (1998) are designing an analytical model with a cellular approach. The three-dimensional space is divided into cubic cells and radiation is passed from one cell to the other through 26 directions defined by the cell faces, edges and corners. Local optical depth, albedo and dust phase function regulate the absorption of energy and its diffusion through the 26 directions. The model is able to deal with arbitrary geometries, not necessarily homogeneous, and produces results at several wavelengths simultaneously.
The Monte Carlo technique, instead, does not suffer of the limitation of the analytical solutions. Within this technique, each individual photon is randomly created and its path followed, through scattering and absorption, until it escapes the dust distribution. The treatment of scattering is straightforward and no approximations are needed. Arbitrary geometries can be used in principle. With respect to the analytical methods, it has disadvantages in the lack of handy solutions to be used in fitting algorithms (like in Xilouris et al. 1997; 1998; 1999) and in the large amount of computational time needed to produce high signal-to-noise results.
Witt, Thronson & Capuano (1992) present the first application of the Monte Carlo method for extended distribution of stars and dust. The adopted spherical geometry is more suitable to describe extinction in the nuclei of active galaxies or in ellipticals. Several relative distributions of dust and stars are explored. BFG have developed a Monte Carlo code for realistic geometries for spiral galaxies. Since the work of this Thesis is based on this model, a more complete description of the original code, together with the main modification apported for the present simulations, is given separately in Sect. 3.7. Other models for spiral galaxies based on the Monte Carlo methods have been developed by De Jong (1996a) and Wood (1997).
The cellular approach can be successfully adopted in the Monte Carlo technique to simulate Dis-homogeneous distributions of dust and stars. Results for the radiative transfer through clumpy dust distributions have been recently presented by Witt & Gordon (1999) for spherical geometries and by Kuchinski et al. (1998) and Bianchi et al. (1999b) for galactic disks. The last work includes the possibility of clumpy light emission as well.
3.2 Models of FIR emission
The model for the FIR emission I am going to present in this Chapter is a sophisticated version of the energy balance method. Because of the conservation of energy, all the starlight absorbed by dust must be re-emitted. In Chapter 2 I showed how most of the dust emission occurs at m, in the MIR and FIR. The intrinsic, unextinguished stellar luminosity is therefore the sum of the stellar luminosity that escapes dust and is observed in the UV, Optical and NIR and the infrared luminosity emitted by dust. Using a radiative transfer model it is then possible to relate the ratio between intrinsic and emitted starlight to the amount of dust and its geometrical distribution.
Evans (1992) applies the energy balance to a sample of nine galaxies with available optical and FIR observations. As for the radiative transfer, he uses a TRIPLEX model with a dust vertical scalelength half that of the stellar (Sect. 3.6). After fitting a blackbody to the observed stellar fluxes, the integrated luminosity is computed over a few wavebands from the optical to the NIR. For a given optical depth in a reference band (the V-band), the adopted extinction law (Sect. 2.2) can be used to find the optical depth for the central wavelength of each band. The radiative transfer model is then used to compute, from the luminosity observed in each optical band, how much starlight must have been originally emitted, for the chosen dust/star geometry and the band optical depth. Constraining the absorbed energy to equal the observed energy emitted by dust, a value for the reference optical depth (and therefore for the amount of dust) can be derived. A slight modification of this method is used by Trewhella (1998a) to derive the mean absorption on several cells on the galaxy NGC 6946. A high resolution extinction map in the B band is then derived from B-K colour using the relation
| (3.1) |
where the quantity between brackets is the mean derived on each cell.
Both Evans (1992) and Trewhella (1998a) have a wide range of optical and FIR observations for their small number of objects. Xu & Buat (1995) apply the energy balance to a large sample of 135 nearby spiral galaxies with available UV and B fluxes and 60 and 100m IRAS data. Since the spectral coverage is not as extended as in the other two works, a considerable extrapolation is necessary to derive the stellar SED and the total FIR emission. The non-ionising emission of the stellar component (fstar) is derived for each galaxy from an extrapolation of the UV and the B-band monochromatic fluxes, using synthetic spectra for specific Hubble types and/or UV-optical colours. The total FIR emission is derived from the IRAS data at 60 and 100m, using a relation derived for 13 galaxies with available sub-mm observations. In this subsample, the ratio between the total FIR flux (their fdust) and the FIR flux in the spectral range 40m-120m, as derived from the 60 and 100m observation (ffir), is found to anti-correlate with the ratio between the two IRAS fluxes. This is expected, since warmer dust (higher 60/100 flux ratio) would emit at wavelengths shorter than the 100m and most of the radiation would be detected by IRAS. For colder dust (lower 60/100 flux ratio), the emission would occur out of the IRAS spectral range, and the ratio fdust/ffir would be larger. Using this anti-correlation and the available 60 and 100m fluxes, the total dust emission is derived for each galaxy. Ionising photons are assumed to be absorbed locally, in the HII regions. The energy absorbed from ionising photons is derived from the Hα fluxes of a subsample of 34 galaxies and subtracted from the total energy absorbed by dust. The remaining absorbed energy is then compared to the stellar emission, as described for the other two models. The only difference is that Xu & Buat (1995) use a sandwich model inclusive of scattering for the radiative transfer.
The energy balance methods presented above have the disadvantage that the FIR radiation is treated as a bulk and all the information about the spectral distribution of the FIR radiation is unused. The relative geometry of stars and dust affects the ISRF and the way it heats dust. It would be desirable to know, from a radiative transfer code, not only how much energy is absorbed by dust, but also the distribution of the absorbed energy. After assuming dust emission properties it would then be possible to know the temperature and the dust emission as a function of the position in the model. A comparison between the model and the observed spectrum would put firmer constraints on the dust distribution. Usually, instead, the spectrum of dust is modelled assuming an ISRF. Désert et al. (1990) and Rowan-Robinson (1992), for example, first derive the properties of their dust models comparing local Galactic FIR spectrum with that produce by their dust model heated by a local ISRF. When the dust model is determined, spectra of dust heated by fractions or multiples of the local ISRF are derived, to be compared with the spectra observed in other environments, internal or external to the Galaxy.
Few models produce their own ISRF from the stellar model and apply it to a dust distribution. Silva et al. (1998) build a complex model for the photometric evolution of galaxies. An intrinsic SED is derived from a spectral synthesis model. Stars, dust and gas are distributed in three exponential (both on the radial and vertical direction) distributions, to describe: i) a distribution of spherical molecular clouds and associated young stellar objects; ii) free stars that have escaped the molecular clouds; and iii) diffuse gas and associated dust. Although the three distributions in the paper have identical scalelengths, independent parameters can be chosen. Spheroidal galaxies can be modelled as well. The dust mass is derived from the residual gas mass in the galaxy evolution model, assuming a fixed dust to gas ratio. A fraction of the total mass of dust is ascribed to MCs. A model is used for the dust properties, slightly different in the molecular clouds, where there is a decrease of the number of PaHs. As for the radiative transfer, they use a cellular approach for the smooth medium. Scattering is dealt with in an approximate way, using an effective optical depth that leads to rigorous results only for an infinite homogeneous medium and isotropic scattering. A separate treatment is implemented for the objects within molecular clouds. After computing the ISRF in the grid cells, dust emission is derived. The stellar and dust spectral energy distributions are then followed in their evolution with time.
Sauty, Gerin & Casoli (1998) present numerical simulations of radiative transfer in the spiral galaxy NGC 6946. After dividing the galactic volume into a three-dimensional grid, they represent the interstellar medium as a two phase medium, with molecular clouds and a constant density smooth diffuse phase associated with the atomic gas. The distribution of molecular clouds is derived from models of cloud collisions and of the gravitational potential of the galaxy. OB association are created within the more massive clouds, and local fluxes are computed accordingly. The radiative transfer through dust is carried out using a modification of the Monte Carlo method, but only for wavelengths between 912Å and 2000Å since the code does not include stars of later spectral types that contribute at longer wavelengths. In fact, the authors are mainly interested in the effects of the UV ISRF on the H and C+ emission lines. The optical and NIR ISRF is scaled from the Galactic, using the local surface brightness in a R-band image, but is only used in regions with no UV flux, like inter-arm regions. Maps of the FIR emission are produced.
It is difficult, in the two models described before, to disentangle the effects of dust from the other (numerous) parameters. In Silva et al. (1998) a complex model is adopted for the stellar SED and for the dust properties while a correct treatment of the radiative transfer is sacrificed. Furthermore, only the global dust SED is produced, but no information on the spatial distribution of emission is present. The model of Sauty et al. (1998) perhaps deals with the radiative transfer in a more correct way, but the ISRF is derived only for the UV. For the spectral regions where the peak of stellar emission is, a Galactic ISRF is used.
For this Thesis, I have built a self-consistent model for the dust emission in spiral galaxies. The radiative transfer is treated correctly. Given an input stellar SED, dust absorbs radiation from an ISRF that is consistent with the radiative transfer itself. The temperature along the dust distribution is computed, so that not only the FIR luminosity and spectrum can be retrieved, but also the surface brightness distribution of the FIR radiation for any wavelength. A Monte Carlo model with this characteristics has been presented by Wolf, Fischer & Pfau (1998), but only for star formation environments and not for galactic distributions of stars and dust.
3.3 Stellar disk
The luminosity density distribution of a galactic disk is usually described by
| (3.2) |
where r and z are the galactocentric distance and the height above the galactic plane, respectively, and and the relative scalelengths. While there is a consensus for the radial exponential behaviour (De Vaucouleurs 1959, Freeman 1970), a number of expressions for the function have been used in the literature. Van Der Kruit & Searle (1981), in their analysis of optical images of edge-on disks, find that the vertical profile is best fitted by
| (3.3) |
with . This function, the solution for a self gravitating isothermal sheet, behaves like an exponential of scalelength at large radii, but has a less sharp peak in the centre. Peletier & De Grijs (1997) suggested that the results of Van Der Kruit & Searle (1981) may have been influenced by an high dust extinction. Wainscoat, Freeman & Hyland (1989) find the sech2 function unsuitable to describe the vertical profile of the edge-on galaxy IC 2531 and prefer a more sharp function, the exponential
| (3.4) |
This function has the advantage of mathematical simplicity, but has no firm physical justification. An alternative function
| (3.5) |
has been proposed by Van Der Kruit (1988). This function has a peak intermediate between the sech2 and the exp and it is consistent with measures of the velocity dispersion of stars along the z-axis.
Analysing the vertical profiles of a sample of 24 edge-on galaxies in the relatively dust-free K-band, De Grijs, Peletier & Van Der Kruit (1997) find that a distribution with a peak intermediate between the exp and the sech fits better the central peak (see also De Grijs & Van Der Kruit 1996). Since a small inclination from the pure edge-on case can produce a less sharp profile, these results are compatible with the exponential distribution. Therefore in this thesis I will adopt a radial exponential disk of star with a vertical exponential distribution as in Eqn. (3.4).
In Eqn. (3.2) it is assumed that the vertical and radial behaviour are independent: De Grijs & Peletier (1997) noticed a constant increase of with in a sample of spiral galaxies. This effect is stronger for early-type galaxies, where can increase as much as a factor of 1.5 per radial scalelength. In late-type galaxies it is almost zero. This behaviour has been explained by a thick disk of star with a bigger scalelength than the ordinary one. Being dusty late-type galaxies the main concern of this work, I use here a constant .
3.4 Observed Galactic scalelengths
In this section I give a list of references to recent determination of radial and vertical scalelengths of the stellar disk distribution in our Galaxy.
In the bi-dimensional model of De Vaucouleurs & Pence (1978) the Galactic disk has a radial scalelength kpc. The value is obtained by comparing the local () vertically integrated surface brightness in the B-band (derived from star counts) with the mean central surface brightness 21.65 mag arcsec-1 for disks of spiral galaxies (Freeman Law; Freeman 1970).
Bahcall & Soneira (1980) built a three-dimensional Galactic model to fit B and V star counts at a Galactic latitude (where extinction is low). The disk component is modelled with an exponential both in the radial and in the vertical direction. For they assume the De Vaucouleurs & Pence (1978) value; values for are derived from the literature and summarised in a magnitude (age)-dependent relation: young stars () have pc, old disk dwarfs () have pc, while a linear relation for stars in the range is assumed. In this formalism giants have pc. This model is commonly referred to in the literature as the standard model. In a subsequent work (Bahcall & Soneira 1984) the parameter space is explored and limits are put on the scalelengths: pc for giants and pc for old disk dwarfs. Although the results depend weakly on (because the model is compared to star counts at high latitude), data can be reasonably fit only for kpc.
A modified Bahcall & Soneira model is used by Van der Kruit (1986) to fit the integrated blue and red starlight observed by the Background Experiment on board of Pioneer 10. To avoid regions with high extinction, only data for galactic latitude are used: thus, as shown by the author, only the value can be derived. Assuming pc a value of kpc is derived. As suggested by Kent et al. (1991) this method is sensitive to local surface brightness gradients and may only give a measure of the local exponential scalelength.
Kent, Dame & Fazio (1991) derive the parameters of Galactic structure from the 2.4- integrated light, measured from the Infrared Telescope aboard the Spacelab 2 mission in 1985. A radial exponential distribution is assumed for the disk, allowing for different vertical distributions. A correction for extinction (small at this wavelength, although not negligible) is incorporated in the model, evaluated from the atomic hydrogen distribution, assuming a constant value for the dust/hydrogen ratio. Surface brightness profiles as a function of the galactic longitude at several latitudes are compared to the data: the standard model is unable to describe the profile on the galactic plane. Using an exponential vertical distribution they find pc and kpc. The value is small compared to the Bahcall & Soneira (1980) value for the giant star distribution (the main contributor to the luminosity in the observed wavelength range). For this reason they try a different fit allowing for a varying . Up to 5.3 kpc they keep pc then they assume a gradient of 30 pc/kpc so that at . The corresponding radial scalelengths is kpc. I note here that all the works cited up to this point used R⊙=8 kpc, while in the next references the value 8.5 is preferred. When a scalelength is derived from a model it should be scaled to the value of R⊙ (Kent et al. 1991).
Wainscoat et al. (1992) fit star counts at 12- and 25- from the IRAS Point Source Catalog with a Galactic model with a disk of radial scalelength kpc. Scaleheights for the vertical exponential distribution are given for a a compilation of 87 types of galactic sources responsible for emission in the NIR bands. Values are similar to those in the Bahcall & Soneira (1980) model (e.g. pc for old dwarfs, 270 pc for giants etc.). A previous model to fit K-band star count and 12- IRAS source count (Garwood & Jones 1987, see also Jones et al. 1981) used slightly smaller values ( pc for old disk dwarfs).
In Robin et al. (1992b) the scalelength is measured from B and V-band star counts up to mag in a low absorption window in the direction of the Galactic anticenter. They use a complex structure and evolution Galaxy model (the Besançon model): the disk in this model follows an Einasto density law, that behaves similarly to an exponential in the radial direction and to a in the vertical. A correction for extinction is evaluated from the U-B/B-V plot of a sample of stars for which U-band data are available. They obtain kpc.
A similar value ( kpc) is obtained by Ruphy et al. (1996) using J- and K-band star counts of two fields in the direction of the Galactic anticenter from the Deep Near-Infrared Survey of the Southern Sky. The same model as in Robin et al. (1992b) is assumed. Data are corrected for extinction (affecting the J-band) matching the positions of the observed and the model J-K colour distribution of the stars. The scalelength is obtained by minimising the difference in shape between the two distributions. Like in Robin et al. (1992b) their fit is not very sensitive on the assumed value for (because data are very close to the Galactic plane).
Porcel et al. (1998) measures from K-band star counts in the Two Micron Galactic Survey database. Extinction effects, low in the K-band, are further minimised by selecting stars out of the galactic plane (at a galactic latitude ). A range of galactic longitudes () is chosen to minimise the contribution to the star distribution from local structures: namely, bulge, ring and bar in the centre () and Local Arm, warp and truncation (). The contribution from other spiral arms are minimised by the choice of . In the database, only stars with K-band apparent magnitude are selected: it can be shown that 80% of the total light emitted in this magnitude range is provided by K2-K5III stars, which have an absolute magnitude . Their luminosity function can thus be conveniently approximated by a Dirac delta function. They find kpc, assuming a vertical scalelength of 200 pc (again the result is not very sensitive on ).
These recent results based on star counts are confirmed also by the kinematical estimate of Fux & Martinet (1994), based on the asymmetric drift equation, that gives kpc, assuming a constant value for . If the gradient in derived by Kent et al. (1991) is included, kpc.
Recently Haywood, Robin & Crézé (1997a; b) have questioned the validity of the exponential assumption for the vertical structure, on the basis of the Besançon model. Rather than adopting different values of for different galactic sources, the model derives the vertical structure from the combined effect of the star formation history and of the secular heating of the disk. After tests on B, V, and I star counts (the Ruphy et al. (1996) value of , 2.5 kpc, is used) they claim that the exponential is unsuitable to properly describe data for pc. They find that the vertical density distribution decreases faster than the pc scaleheight generally assumed for old disk dwarf stars. In Ruphy et al. (1996) a value of pc is suggested for .
3.5 Adopted disk parameters
A table of vertical scalelengths, B, V, J, H, K-band absolute magnitudes, local number density and other values for the main Galactic stellar sources is provided by Wainscoat et al. (1992). I have computed the mean values for the vertical scalelengths averaging over the disk luminosity in each waveband. A mean value is computed also averaging over the total disk luminosity integrated from the B to the K band. Mean values for are presented in Tab. (3.1), together with the ratios . I have assumed kpc, a compromise between the highest and lowest values presented in Sect. 3.4.
| Band | [pc] | |
|---|---|---|
| B | 150 | 20.0 |
| V | 182 | 16.5 |
| J | 256 | 11.7 |
| H | 268 | 11.2 |
| K | 271 | 11.1 |
| Tot | 208 | 14.4 |
As shown by Tab. (3.1) and by the discussion in Sect. 3.4, a model of a spiral galaxy should include different scalelengths ratios for different stellar components, and therefore for emission at different wavelengths. For simplicity, in this thesis I will mainly use one scalelength ratio only, the one averaged over the total luminosity, . A test simulation has been run using different scale heights for different wavelength ranges (Sect. 4.7); for that simulation I use ( pc for an kpc) shortward of the V-band (obtained averaging over the total integrated luminosity from B to V) and 11.3 ( pc) at longer wavelengths (averaging over the total integrated luminosity from J to K).
Similar values for can be found in the literature. Analysing the structure of eight large edge-on galaxies in the UGC catalog, De Grijs & Van Der Kruit (1996) find a mean ratio of the radial and vertical exponential scalelength in the I-band of . They argue that looking at edge-on objects, the radial scalelength can be overestimated at least by 10% (in a transparent case) because of projection effects, thus reducing the ratio. No clear trend of variation of from B to I-band is observed in their sample. Van Der Kruit & Searle (1982) obtained in the J-band for eight edge-on spiral galaxies, including our own. Fitting the stellar emission in a sample of seven spiral galaxies with their radiative transfer model, Xilouris et al. (1997; 1998; 1999) measure 14, in B, 12 in V-band and 11-12 in I, J, K.
In the models of this thesis, only one value of the radial scalelength is used, i.e. all the stellar components have a radial exponential distribution with the same . A few authors have investigated the ratios of radial scalelengths in different passbands. Peletier et al. (1994) have compared B and K-band disk scalelengths for a diameter limited sample of 37 Sb-Sc galaxies with a uniform distribution of orientation respect to the sky. Their aim is to separate in the effects of extinction from those of a change in stellar population. If the ratio is mainly due to extinction, it increases with inclination, while it is constant if the change in stellar population is the dominant contributor to the galactic colour gradient. From the metallicity gradients a ratio of 1.17 is estimated, independent of inclination, while the observed value goes from 1.3 for face-on galaxies to 1.7 for edge-on (Peletier et al. 1995). Moreover they observe from previous work that in dust-free late type galaxies the ratio between scalelengths is small: , equivalent to for almost any stellar population model. Thus they claim that the change in scalelength with is mainly due to dust extinction, rather than being a reflection of different stellar components. On the contrary, comparing colour-colour plots of a sample of 86 face-on galaxies with a Monte Carlo radiative transfer model, De Jong (1996a) concludes that dust can’t be responsible for the gradient in colour. He suggests that the observed ratio is caused by a change in stellar population in the outer parts of the disk.
3.6 Dust disk
The parameters for the dust disk are by far more uncertain than the stellar disk. Usually the same functional form is used as for the stellar distribution, with independent scalelengths (Kylafis & Bahcall 1987, Byun et al. 1994, Bianchi et al. 1996, Xilouris et al. 1997; 1998; 1999).
Devereux & Young (1990a) find a very good correlation between the mass of dust derived from IRAS fluxes at 60m and 100m and the total mass of gas inside the optical radius for a sample of 58 galaxies. Xu et al. (1997) compared the extinction in the B band derived on a sample of 79 galaxies using an energy balance model with that obtained from the gas column density using the relation measure in the Galaxy (Eqn. 2.10). A good agreement is found. When the correlation is analysed separately for each gas phase, a tighter correlation is found for the H2, suggesting that extinction is due essentially to dust associated with the molecular gas. This is because in their sample, molecular gas is the dominant component in the inner galaxy. Indeed, when galaxies with a dominant HI component are selected, extinction is mainly associated to the atomic gas. Therefore, it is reasonable to use the gas distribution as a tracer of the dust distribution.
In luminous, face-on, late-type spirals, H2 peaks in the centre and falls off monotonically with increasing distance from the centre. This contrasts markedly with the central HI depression and the nearly constant HI surface density across the rest of the optical disk (Young & Scoville 1991). The same behaviour has been observed in some early type galaxies, although a good fraction of them presents a central depression and a flatter ring distribution for the molecular gas. Conducting an energy balance on M31 for several cells associated with diffuse FIR emission on M31, Xu & Helou (1996b) found a quite flat face-on optical depth with the radius. Because of their selection against FIR sources associated with molecular clouds and star-forming regions, the optical depth profile is close to the HI, rather than to the H2 component. A dust ring in emission has been observed by SCUBA at 450m and 850m in the early type galaxy NGC 7331 (Bianchi et al. 1998). The dust emission correlates well with the observed molecular ring (See Appendix A for a complete discussion). A flat distribution for the B-band optical depth of the Galactic disk has been found by Sodroski et al. (1997) from the optical depth at m derived from DIRBE observation.
Nevertheless, most of the galaxy exhibit a centrally peaked molecular gas component, dominant on the atomic gas phase. This is the case of the late-type spiral NGC 6946 (Tacconi & Young 1986), whose dust distribution is the main concern of this thesis (Chapter. 4), Therefore, I assume the dust to be distributed in a smooth radial and vertical exponential disk, similar to the stellar one (Sect. 3.3). The number density of dust grains can be written as
| (3.6) |
with the central number density. The radial and vertical scalelengths and can be selected independently from the analogous stellar parameters. Usually it is assumed and . The choice of the last parameter is mainly dictated by the impossibility of simulating the extinction lanes in edge-on galaxies with a dust distribution higher than the stars (Xilouris et al. 1999). Recently there have been suggestions for more extended dust distributions, both from analysis of extinction of starlight and FIR emission. Peletier et al. (1995), from an analysis of the variation of scalelength ratios in different colours with inclination, concluded that . Davies et al. (1997) modelled the Galactic FIR emission at 140 m and 240 m observed by the satellite with an extended dust distribution with scalelengths and . In all of seven edge-on spiral galaxies, Xilouris et al. (1999) are able to fit optical and NIR starlight with their radiative transfer model only using a larger radial scalelength for dust with respect to stars: the mean value is .
The dust number density in Eqn. (3.6) is normalised in the model from the optical depth. For a model with face-on central optical depth in the V-band , the central number density is given by
| (3.7) |
where is the extinction cross section. For a model at a specific wavelength, the absorption coefficient
| (3.8) |
is integrated along a path to compute the optical depth and there is no need to specify the absolute values of but only the ratio , given by the assumed extinction law (Sect. 2.2). The dust disk has the same truncations as the stellar, at 6 scalelengths both in the vertical and radial direction.
In chapter 4, I will explore various values of and and , to better reproduce the characteristics of the dust FIR emission.
3.7 The Monte Carlo code
The model used in this thesis is based on the BFG Monte Carlo code for the radiative transfer (complete with scattering) in dusty spiral galaxies. The BFG code originally included the radiative transfer of all the Stokes parameters, to also model polarisation. Dust properties were computed from the Draine & Lee (1984) dust model, using Mie’s theory for spherical grains. For use in this thesis the BFG code has been simplified: the radiative transfer is carried out only for the intensity using empirical dust properties and phase functions (Sect. 2.2). Clumping (Bianchi et al. 1999b) is not yet included in this work.
Within the Monte Carlo method, the life of a photon (i.e. a unit of energy in the program) can be followed through scattering and absorption processes, until the radiation is able to escape the dusty medium. I’ll give here a brief description of the computation scheme of the Monte Carlo code, referring the interested reader to the BFG paper. The main steps are:
- Emission:
-
the position of a photon in the 3-D space is derived according to the stellar distributions described in Sect. 3.3. The photon is emitted isotropically. Photons are emitted with unit intensity.
- Calculation of optical depth:
-
the optical depth through the dust distribution is now computed from the emission position along the photon travelling direction. A fraction of all the energy travelling in that direction is able to propagate through the dust. With the Monte Carlo method it is then possible to extract the optical depth at which the photon impinges on a dust grain. This optical depth can be computed inverting
(3.9) where is a random number in the range [0,1]. If the derived is smaller than , the photon suffer extinction, otherwise escapes the dusty medium. This process is quite inefficient when the optical depth of the dust distribution is small, most of the photons leaving the dust distribution unaffected. To overcame this problem, the forced scattering method is used (Cashwell & Everett 1959, Witt 1977): essentially, a fraction of the photon energy is unextinguished and the remaining is forced to scatter. When the optical depth is small () or the photon path is free of dust, the photon escapes the cycle. Once is known, the geometrical position corresponding to the point where the photons collide with a dust grain is computed.
- Scattering and Absorption:
-
a fraction of the photon energy, given by the albedo , is scattered, while the remaining is absorbed. The scattering polar angle , i.e. the angle between the original photon path and the scattered direction, is computed using the Henyey & Greenstein (1941) scattering phase function (Eqn. 2.12), inverting
(3.10) with a random number. The inversion of Eqn. (3.10) is given by the analytical formula
(3.11) with the asymmetry parameter (Sect. 2.1). Another angle is needed to define the direction of the scattered radiation. Since for spherical grains there is no preferential direction perpendicular to the original photon path, an azimuthal angle is extracted randomly in the range .
The original BFG code has been modified to store the information about absorption, to be used in the derivation of dust temperature. Using the model symmetries around the vertical axis and about the galactic plane to improve the signal-to-noise, a map of the absorbed energy is produced as a function of the galactocentric distance and the height above the plane.
- Exit conditions:
-
the last two steps are then repeated, using the new direction of the scattered photon, the coordinates of the scattering point and the energy reduced by absorption. The cycle is repeated until the energy of the photon falls below a threshold value ( of the initial intensity) or until the exit conditions on are verified.
After the exit conditions are satisfied, the photon is characterised by the last scattering point, its travelling direction and its energy. The two symmetries of the model, planar and axial, are exploited to reduce the computational time: if the model is supposed to be observed from a point at infinite distance in the (x,z) plane, each photon position is rotated around the symmetry axis until its direction is parallel to that plane; then, for each photon coming from (x,y,z), another with the same direction coming from (x,-y,z) is added; two other photons are added coming from (x,y,-z) and (x,-y,-z) and with a direction specular to the original one with respect to the galactic plane. A total of 4 photons are produced from each one. The photons are then classified according to the angle between their direction and the symmetry axis, to produce maps of the galaxy as seen from different inclinations. This is done by dividing the whole solid angle in latitudinal bands of the same solid angle. In BFG and here, . There are therefore 8 independent images at mean inclinations of 20∘, 37∘, 48∘, 58∘, 66∘, 75∘, 82∘ and 90∘. When models are produced for a specific angle only, as in Chapter 4, it means that a band of solid angle is used, with a mean angle equal to the given one.
Finally, all the photons in an angle band are projected into the plane of the sky according to their point of last scattering. For the models of this thesis, I have used maps of 201x201 pixel, to cover a region of 12x12 stellar radial scalelengths around the centre of the galaxy. Maps of absorbed energy are derived to cover 6 dust scalelengths in the radial direction and in the positive vertical direction in 101x101 pixels.
3.8 Normalisation of the radiative transfer output
The Monte Carlo model described in the previous section is monochromatic, since the optical properties of dust must be specified for a particular wavelength. Also the geometrical distributions of stars may depend on (Sect. 3.5). Therefore the absorbed energy maps contain information on the energy absorbed by dust from a single wavelength only: a map of the total energy absorbed by dust can be produced running several monochromatic models to cover the Spectral Energy Distribution (SED) of stellar radiation, the main source of dust heating.
To describe the output of the program, I use in this chapter a model with a stellar exponential disk of radial scalelength kpc (the choice for a model of NGC 6946, see Sect. 4.5) and (Sect. 3.5). The adopted dust disk has the same radial scalelength as the stars, but a vertical scalelength half the stellar one. The central face-on optical depth in this model is . Images have been produced for the 15 contiguous angle bands defined in BFG (Sect. 3.7). I use a synthetic SED for a spiral galaxy, derived with the spectrophotometric evolution model PEGASE111The spectra has been produced using the parameters for an Sbc galaxy given in Fioc & Rocca-Volmerange (1997), without taking dust into consideration, the extinction being modelled by the code described in this thesis. For the spectrum, I have assumed a galaxy of mass 1011 M⊙. (Fioc & Rocca-Volmerange 1997). The spectrum is shown in Fig. (3.1).

In Table (3.2) the 17 wavelength bands used in the model are defined: the bands from UV1 to K have essentially the same spectral coverage as the homonymous described by Gordon et al. (1997), for which they provide extinction and scattering properties (Sect. 2.2). Two bands (namely EUV and LMN) have been added to extend the spectral coverage in the ultraviolet up to the ionization limit and in the near infrared. A Monte Carlo simulation is run for each of the band. The energy emitted in each band is computed integrating the stellar SED over the band limits (Fig. 3.1). In the example of this chapter, models are normalised to the intrinsic energy, i.e. the energy a galaxy would emit in the optical without intervening dust. For each band, I show in Fig. (3.1) the amount of energy that is able to escape dust, the rest being absorbed. When comparing the simulation to observed SEDs, as in the next chapter, the models are normalised to the observed energy, i.e. after radiation has been processed by dust. The intrinsic SED is then inferred from the radiative transfer model.
band [Å] EUV 912 1125 UV1 1125 1375 UV2 1375 1655 UV3 1655 1900 UV4 1900 2090 UV5 2090 2340 UV6 2340 2620 UV7 2620 3230 U 3230 3930 band [Å] B 3930 4979 V 4979 5878 R 5878 7350 I 7350 9500 J 9500 14000 H 14000 19000 K 19000 25000 LMN 25000 37500
Usually 107 photons are run for each simulation. Approximatively, 24 hours of computing on a SUN ULTRA 5 workstation are needed for a complete set of 17 simulations with . Optical images are produced in units of surface brightness (L⊙ kpc-2 m-1 sterad-1). An example of the images produced by the radiative transfer code in the optical (B-band) is given in Fig. (3.3).
3.9 The FIR code
For each waveband, a map of the absorbed energy density as a function of the galactocentric distance and of the height above the galactic plane is produced. Of all the radiation absorbed in a specific waveband, a fraction is absorbed by grains not emitting at the thermodynamic equilibrium. Since I am interested in modelling only the thermal emission, a correction is applied to the absorbed energy maps, as described in Sect. (2.5).
After all the absorbed energy maps are scaled to the energy input of each band, they are summed together, to produce a single map of the absorbed energy that goes into thermal emission. The final map, , has units of energy per unit time per unit volume (L⊙ kpc-3). Knowing the number density of dust grains, , the power absorbed by a single grain, , can be derived. Equating the absorbed and emitted radiation, a relation for the temperature can be then found. Assuming that dust grains have all the same radius, it can be derived from Eqn. (2.13) that
| (3.12) |
In the case of an exponential dust distribution, the number density can be obtained by Eqn. (3.6). The central number density of Eqn. (3.7) can be rewritten in terms of the grain radius and the extinction efficiency as
| (3.13) |
Finally, substituting Eqns. (3.6) and (3.13) in Eqn. (3.12)
| (3.14) |
A map of the temperature can thus be derived inverting Eqn. (3.14). I have used the emissivity law defined in Eqn. (2.33). The temperature contour map is shown in Fig. (3.2).
The emission coefficient (Eqn. 2.21) can be easily derived from the temperature from the formula
| (3.15) | |||||
It is interesting to note that both the determination of the temperature and the emission coefficient are independent of the grain radius . If a dust model was to be used for , rather then an empirically determined value, the emissivity would have been dependent on the dust grain radius and on its composition. Therefore, the approach used here is analogous to use a mean value over the dust distribution of sizes and materials for both the radius and the ratio .
FIR images are created integrating the emission coefficient along a given line of sight through the dust distribution, under the assumption that dust is optically thin to FIR radiation. Using the emissivity as in Eqn. (2.33) this is justified for any model with reasonable . As for the optical images, the far infrared images are produced in units of surface brightness (L⊙ kpc-2 m-1 sterad-1). FIR images have the same extent and resolution of the optical images, i.e. a region of 12x12 stellar radial scalelengths around the centre of the galaxy is mapped in 201x201 pixels. As an example, FIR images are shown in Fig. 3.3, at 100 m.

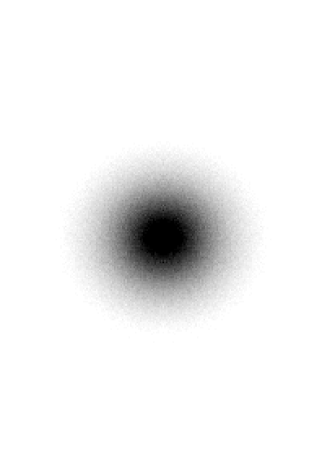
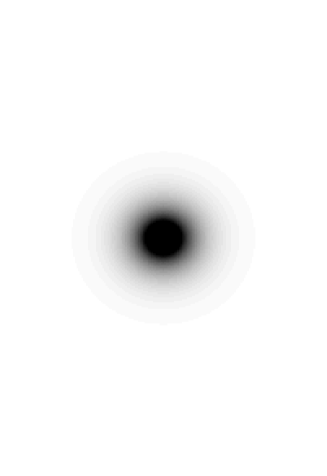
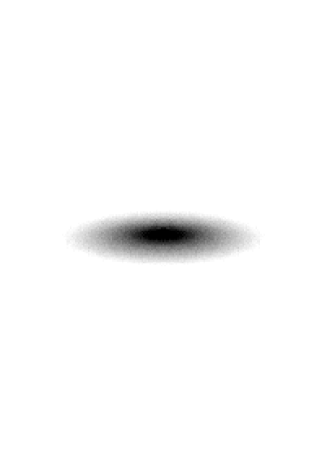
Both optical and FIR images can be analysed as real images. In Fig. (3.4) I show the surface brightness measured over a circular aperture corresponding to the half-light radius (in the B-band), for both optical and FIR images at an inclination of 20∘ (solid line). The half-light radius is observed, i.e. it has been derived from the surface brightness distribution in the B band image. The surface brightness inside the half light radius for a transparent galaxy seen at that inclination is also shown (dashed line). From Fig. (3.4) it is not straightforward to derive a relation between the absorbed and the emitted energy, i.e. it is not possible to compare the area between the two curves in the UV/optical/NIR (the absorbed energy) with the area under the FIR curve (the energy emitted by dust). This is because we are not looking at the total energy emitted by the model, but at the energy coming from a specific inclination: because of the reduced extinction and the influence of scattering, a model at low inclination looks more transparent than in the edge-on case. Furthermore, part of the absorbed energy has been disregarded because is not going into thermal equilibrium processes. The sum of the total energy emitted by dust and of the total energy observed in the optical, for all the inclination bands, do equal the total intrinsic unextinguished stellar energy.

3.10 Summary
In this Chapter I have described the code used to model the FIR emission. A modified version of the BFG radiative transfer code is used to produce a map of the energy absorbed by dust as a function of the position within the dust distribution, together with the usual images of the attenuated emission from the stellar distribution. The whole spectral range of non-ionising stellar radiation is used. Using the model for the dust emissivity derived in Sect. 2.3, a temperature distribution is derived from the absorbed energy map. Finally, the FIR emission is computed, integrating over the dust number density and temperature distributions. Images of FIR emission for any wavelength and galaxy inclination are produced.
In the next Chapter, I will use the code to model the FIR emission of the spiral galaxy NGC 6946. For a chosen dust distribution and optical depth, the output for the stellar emission from the radiative transfer code will be normalised to the observed stellar SED. The modelled FIR emission will be then compared with the observations. Dust parameters will be changed to match the observed FIR spectrum and the spatial distribution of FIR images (as defined by a radial exponential scalelength).
Chapter 4 Modelling NGC 6946
NGC 6946 is a large (D25=11.5’, De Vaucouleurs et al. 1991, RC3) nearby Sc galaxy, seen from an inclination of 34∘ (Garcia-Gomez & Athanassoula 1991). Tully (1988) give a distance of 5.5 Mpc, similar to those obtained by other authors with a variety of methods (De Vaucouleurs 1979, Eastman et al. 1996, Schoniger & Sofue 1994), although there are estimates as big as 10.1 Mpc (Sandage & Tammann 1974). In this work I assume a distance of 5.5 Mpc, that gives a scale on the sky of 27 pc arcsec-1.
The optical appearance of the galaxy is characterised by the prominent spiral arms (Fig. 4.1). Six separate spiral arms can be seen in optical images (Tacconi & Young 1990): the three spiral arms originating from the northeast quadrant are brighter and more developed than the other in the southwest. In his high-resolution extinction maps based on an energy balance method, Trewhella (1998a; b) finds that the interarm regions between the two prominent northeast spiral arms is a site of strong extinction, rather than being intrinsically less luminous. Indeed, light polarised by dust is observed in the interarm regions as well as in the spiral arms (Fendt et al. 1998). There is evidence for recent star formation along the spiral arms and a mild starburst in the centre (Tacconi & Young 1990). The distribution of atomic and molecular gas in the inner 10’ has been studied by Tacconi & Young (1986, Sect. 4.9).
The galaxy is marginally resolved in FIR observations from IRAS and KAO (Engargiola 1991, Alton et al. 1998a), with the FIR emission following the giant HII regions along the spirals and the bright central emission. The low resolution 200m ISO image (Alton et al. 1998a) shows a morphology similar to the 100m IRAS observation (Fig. 4.1).
In this chapter I will apply the model described in Chapter 3 to the optical and FIR observations of NGC 6946, to determine the spatial distribution and content of dust in the galaxy.
To reduce the size of this file, these figures have been omitted. The full version of this thesis, including the present figures, can be found at http://www.arcetri.astro.it/∼sbianchi/tesi/thesis.ps.gz
4.1 The stellar Spectral Energy Distribution
The observed Spectral Energy Distribution of the stellar radiation in NGC 6946 has been constructed using data available in the literature and extrapolating a few data points at the edges of the wavelength range, where no observations were available. The SED (in units of surface brightness) for a circular aperture of 5’ (corresponding to the half light radius in the B-band) is presented in Table 4.1. All the data have been corrected for a Galactic extinction =1.73 (RC3) using a standard extinction law (Whittet 1992).
Optical and Near Infrared data comes from Engargiola (1991), that provides fluxes for NGC 6946 in the bands U, B, g, V, r, I, J, H, K for the half light radius aperture.
In the NIR part of spectrum, the emission could be due in part to small grains of dust. Dust contribution can be computed from the Désert et al. (1990) dust model for dust heated by the local interstellar radiation field. According to the model, emission in filter K is 0.004 times the emission in the IRAS 12 m filter. This is still valid even if the radiation field is 100 times the local one. Using NGC 6946 emission at 12 m, derived from IRAS HiRes images (Sect. 4.2), it is therefore possible to compute the contribution of dust to the emission in K and compare it to the observed emission in that band. As expected, the K-band emission can be considered as purely stellar, the dust contributing only about 0.3% to the total.
The stellar emission at longer wavelengths has been extrapolated using the synthetic galactic SEDs of Fioc & Rocca-Volmerange (1997). In this wavelength range, the SED of their unextinguished spiral galaxy models is almost linear when is plotted versus . A value at 5 m has thus been computed from the K-band flux.
band Iλ (5’/ ) m 106 L⊙ kpc-2 m-1 sterad-1 0.091 25 short-UV 0.165 14 4 medium-UV 0.250 9 6 long-UV 0.315 15 7 U 0.360 17 2 B 0.435 21 2 g 0.495 20 2 V 0.554 20 1 r 0.655 20 2 I 0.850 20 2 J 1.250 14 1 H 1.650 12 1 K 2.200 5.5 0.5 5.000 0.25
Fluxes for the non-ionising UV radiation shortward of the U-band have been taken from Rifatto, Longo & Capaccioli (1995a): the authors give total magnitudes for 2400 galaxies in three photometric bands centred at 1650Å (short-UV), 2500Å (medium-UV), 3150Å (long-UV). Data collected by several satellites (notably IUE), balloon and rocket-borne experiments with different apertures and sensitivities have been homogenised to a common scale. After dividing the sample in three morphological bins (E/S0, Sa/Sb, Sc/Sd), standard luminosity profiles in the B-band (Buta et al. 1995) have been fitted to the data in each of the three photometric band and the total magnitudes were derived.
Using the luminosity profiles for Sc/Sd galaxies, I have derived the UV magnitudes for NGC 6946 inside the aperture used for Optical and NIR data. Fluxes have been derived from magnitudes using the calibration described in Rifatto, Longo & Capaccioli (1995b). Errors in the fluxes are quite big, mainly arising from the aperture correction.
The flux at the Lyman limit (912Å) has been extrapolated after observing that in a versus plot the observed SED is flat for the short- and medium-UV. I have assumed that the same trend is valid down to the ionization limit. I haven’t included the ionising UV in the model: this will be justified later (Sect. 4.10.4).
4.2 The dust Spectral Energy Distribution
The FIR output of the code is compared to the SED of dust emission as measured from the IRAS and ISO maps of Alton et al. (1998a). The SED (in units of surface brightness) for a circular aperture equivalent to the half light radius is presented in Table 4.2, in the same units as for Table 4.1.
Shortward of 100m I have used IRAS High Resolution (HiRes) images. Original data from the IRAS satellite (Neugebauer et al. 1984) have a coarse resolution (FWHM 1.5’ x 5’ at 60 m). HiRes images are produced using a model of the response of IRAS detectors and a process called Maximum Correlation Method, to restore a resolution close to the diffraction limit (Rice 1993, and references therein). As an example, resolution of HiRes images is 45” x 60” and 80” x 100” (FWHM), at 60 m and 100 m, respectively (Alton et al. 1998c; a). Derived values have been colour corrected using the corrections for NGC 6946 derived by Rice et al. (1988) (18%, -14%, 7%, 4% at 12, 25, 60 and 100 m). Integrated values are consistent (within a 20% error, Engargiola 1991, Alton et al. 1998a) with the analogous data provided by Engargiola (1991), derived on previous enhanced resolution IRAS images.
Data at 200m comes from observations with the ISOPHOT instrument (Lemke et al. 1996) aboard the ISO satellite (Kessler et al. 1996), with a resolution of 117” (FWHM). Integrated values have an error of 15%, but the present calibration of the instrument may to be overestimated by about 30% (Alton et al. 1998a). The value in Table 4.2 is consistent, within the errors, with the measurements by Engargiola (1991) on 200m images taken by the air-born telescope KAO.
Finally, I have included in Table 4.2 data at 160m derived from the KAO telescope (Engargiola 1991), with a resolution of 45” (FWHM).
Iλ (5’/ ) m 106 L⊙ kpc-2 m-1 sterad-1 12 0.35 0.07 25 0.10 0.02 60 0.14 0.03 100 0.10 0.02 160 0.05 0.01 200 0.031 0.005 450 2 10-4 – 6 10-4 850 1.2 10-5 – 1.8 10-5
4.3 High resolution SCUBA observations of NGC 6946
NGC 6946 was observed by me using the Sub-millimetre Common User Bolometer Array (SCUBA) on the 15 m James Clark Maxwell Telescope in Hawaii. Observations were carried out on April 10, 11 and June 17, 18, 19, 20 1998, at 450m and 850m.
SCUBA consists of two bolometer arrays of 91 elements for the short wavelengths and 37 elements for the long wavelengths. The short-wavelength array is optimised for observing at 450-m and the long-wavelength array for observing at 850-m (Holland et al. 1999). The camera is mounted on the Nasmyth focus of the telescope. The arrays have a field of view of about 2.3 arcmin in diameter and can be used simultaneously, by means of a dichroic beamsplitter. The spacing between the bolometers does not produce instantaneously fully sampled images. Therefore, it is necessary to move the secondary mirror of the telescope according to specific patterns.
For sources smaller than 2.3 arcmin, the jiggle-map mode is used: the secondary mirror moves according to a 64-point pattern to fully sample the selected region of sky at both long and short wavelengths, and chops to off-source positions to remove the sky background. The telescope nods to remove slowly varying atmospheric gradients. The highly inclined galaxy NGC 7331 (Bianchi et al. 1998, see also Appendix A) and the edge-on NGC 891 (Alton et al. 1998b) have been observed using this mode111A more extensive description of observations with the jiggle-map mode is given in Appendix A.. The dimension of the arrays is suitable to contain the extent of the two galaxies along their minor axis. Chopping to relatively distant positions perpendicular to the major axes ensures the sampling of a source-free portion of the sky.
For sources larger than 2.3 arcmin, like nearby face-on galaxies, the jiggle-map mode is not suitable. The need for source-free observations would lead to very large chop throws, resulting in a degradation of the sky background subtraction and of the beam size. The scan-map mode is therefore used in this case. The telescope scans the source at a rate of 24 arcsec per second, along specific angles to ensure a fully sampled map. Meanwhile the secondary chops with a frequency of 7.8 Hz within the observed field. While this ensures a correct subtraction of the sky background, the resulting maps unfortunately have the profile of the source convolved with the chop. The profile of the source is restored deconvolving the chop from the observed map by mean of Fourier Transform analysis.
Scan-maps of NGC 6946 presented here are fully sampled over an area of 8’x8’. Each set of observations consisted of six scans, with different chop configurations: chop throws of 20”, 30” and 65” along RA and Dec are needed to retrieve the final image. Data have been reduced using the STARLINK package SURF (Jenness & Lightfoot 1999). Images were first flat-fielded to correct for different sensitivities of the bolometers. Noisy bolometers were masked and spikes from transient detections removed by applying a clip. A correction for atmospheric extinction was applied, using measures of the atmosphere opacities taken several times during the nights of observation. Zenith optical depth varied during the six nights, with and . The 450m opacity on the last night was too high () for the source to be detected and therefore the relative maps were not used for this wavelength. Because of the chopping in the source field and not along the scan direction, each bolometers sees a different background: a baseline, estimated from a linear interpolation at the edges of the scan, has been subtracted for each bolometer in each map.
Images have been corrected for systematic sky variation. Sky fluctuations could be derived by observing the time sequence of observations for bolometers with negligible source signal. However, for large objects observed in scan-map mode, it is difficult to disentangle the signal due to the sky from the source. This problem is overcome by subtracting from the data a model of the source, obtained from the data themselves. The sky variation for all the bolometers is then derived and subtracted.
Data taken with the same chop configuration were rebinned together into a map in an equatorial coordinate frame, to increase the signal to noise. Six maps with 3” pixels were finally obtained for each wavelength, combining 33 and 25 observations, at 850 and 450 m, respectively. In each of the six maps the signal from the source is convolved with a different chop function. The Fourier Transform (FT) of a map is therefore the product of the FTs of the source signal and of the chop. Since the latter is a sine wave, a simple division should retrieve the FT of the source and the deconvolved image, after applying an inverse FT back into image space. In principle, an observation with a single chop configuration would be needed for this purpose. However, problems arises near the zeros of the sine-wave of the chop function FT. At these frequencies, the noise is boosted up and the signal to noise of the final image is significantly reduced. Therefore, observation taken with different chop configurations are used, with chop throws selected in a way that the zeros of one chop FT do not coincide with those of another, except at zero frequency. The noise introduced in the source FT by the division with one chop FT are thus smoothed by coadding with another source FT with noise at different frequencies. This method is known as the Emerson II technique (Holland et al. 1999, Jenness et al. 1998). The six chop configurations described above are recommended for this technique.
Unfortunately the deconvolution introduces some artifacts in the images, like curved sky background. This may be due to residual, uncorrected, sky fluctuation at frequencies close to zero, where all the chops FT goes to zero. Work to solve this problem is ongoing (Jenness, private communication). To enhance the contrast between the sky and the source, I have modelled a curved surface from the images, masking all the regions were the signal was evidently coming from the galaxy. The surface has been then subtracted from the image.
Calibration was achieved from scan-maps of Uranus, that were reduced in the same way as the galaxy. Comparing data for each night I derived a relative error in calibration of 8 per cent and 17 per cent, for 850-m and 450-m respectively. From the planet profile, the beam size was estimated: a FWHM of 15.2” and 8.7” were measured for the beam at 850 and 450 m, respectively. To increase the signal to noise, the 850 m image has been smoothed with a gaussian of 9”, thus degrading the beam to a FWHM of 17.7”. The 450 m image has been smoothed to the same resolution as for the 850 m one, to facilitate the comparison between features present in both. The sky in the smoothed images is 3.3 mJy beam-1 at 850 m and 22 mJy beam-1 at 450 m. The final images, after removing the curved background and smoothing are presented in Fig. 4.2. For each wavelength, the grey scale shows all the features , while contours starts at and have steps of .
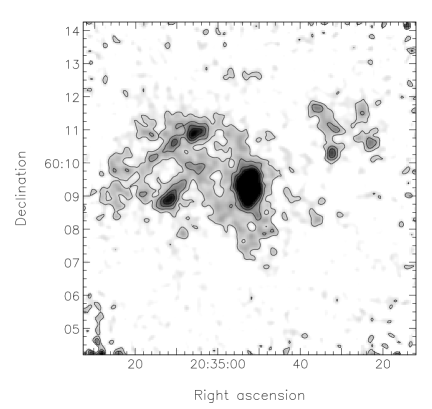
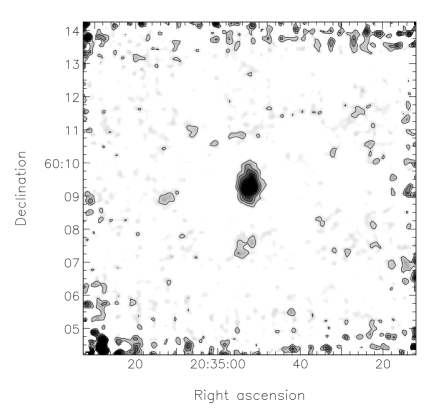
To reduce the size of this file, this figure has been omitted. The full version of this thesis, including the present figure, can be found at http://www.arcetri.astro.it/∼sbianchi/tesi/thesis.ps.gz
The 850m image shows a bright nucleus and several features that clearly trace the spiral arms (see Fig. 4.3, where a U-band image of the galaxy (Trewhella 1998b) is shown with the sub-mm contour overimposed). As already seen in optical images (Tacconi & Young 1990), the spiral arms originating in the northeast quadrant are more pronounced than the others, where only regions with bright HII regions have detectable emission. The 850m image presents a striking similarity to the CO (J=2-1) emission map in Sauty et al. (1998), observed with the IRAM 30m radiotelescope with a comparable resolution. This is hardly surprising, since the molecular gas is the dominant component of the ISM over the optical disk of NGC 6946 (Tacconi & Young 1986, Sect. 4.9). The nucleus is elongated in the direction north-south, as observed for the central bar of molecular gas (Ishizuki et al. 1990, Regan & Vogel 1995).
Emission associated with a more diffuse atomic gas component cannot be detected, for several reasons. First of all the face-on inclination of the galaxy: since dust is optically thin to its own emission a faint component can be observed only if the dust column density is large. This is the case for the highly inclined galaxies observed with the jiggle-map mode, i.e. NGC 7331 and NGC 891, where higher signal to noise were obtained coadding a smaller number of observations. The large face-on galaxy M51 has been observed using the scan-map mode and confirms the necessity of long integrations (Tilanus, private communication). Furthermore, chopping inside the source field removes not only the emission from the sky but also from possible components with a shallow gradient: this may be the case for dust associated with the flat HI distribution in NGC 6946 (Sect. 4.9). Finally, a faint diffuse emission could have been masked by the mentioned artifacts and subtracted together with the curved background.
The 450m image is much noisier than the 850m one, because of the larger sky emission in this wavelength. Only the nucleus can be clearly detected, although most of the features at a 3- level corresponds to regions emitting in the long wavelength image.
It is difficult to derive an integrated flux inside the half-light radius, as in Sect. 4.1 and 4.2, because the subtraction of the curved background and the chopping within the observation field are likely to remove faint emission. Assuming that the regions without evident signal have an undetected emission of about 1 , upper limits can be derived for the integrated values. The nuclear and most of the bright spiral arm emission at 850m is included within the optical half light radius. Regions brighter then 3 have a flux of 2 Jy at this wavelength. An upper limit of 3 Jy can be derived for the total emission inside the half light radius. At 450m, only the nucleus is detected above 3, with a flux of 9.3 Jy. Assuming a 1 emission for the rest of the half light radius aperture, the estimated upper limit is 27 Jy. These ranges, converted into the units used in this thesis, are shown in Table 4.2.
For the nucleus it is possible to derive a temperature from the two sub-mm fluxes. The 3- central region in the 450m image has a a flux of 1.2 Jy at 850m, resulting in a temperature of T=207 K, using the emissivity as in Eqn. (2.33). The large error comes from the calibration uncertainties. Because of the lower resolution of IRAS and ISO images, it is not possible to derive a temperature over the same small area from the 100 and 200 m data. The mean temperature of dust inside the half-light radius, derived from IRAS and ISO, is T=263, on the upper limit of that measured with SCUBA data. A similar temperature can be derived substituting one of the two FIR observations with the integrated flux of an 850m image smoothed to the same resolution.
The gas column density can be derived from the 850m flux, if the gas-to-dust ratio is known. Assuming a mean dust grain radius 0.1m and mass density =3 g cm-3 (Hildebrand 1983), the emissivity of Eqn. (2.33)222Using Eqn. (2.32) (i.e. at any wavelength) instead of Eqn. (2.33) will result in values 15% smaller than the one quoted here. with an extinction efficiency in the V-band of 1.5 (Casey 1991), a gas-to-dust ratio of 160 (Sodroski et al. 1994) and T=26K, a hydrogen column density cm-2 can be derived for the 1- level, cm-2 for the central peak and cm-2 for the two bright HII regions in the northeast spiral arms. Ishizuki et al. (1990) observed the CO(J=1-0) emission in the central 65” of the galaxy, using the Nobeyama Millimeter Array. They derived a total H2 mass of 108 M⊙. Integrating the 850m image over the same area, a column density cm-2 is retrived, resulting in a mass of 9 108 M⊙. The two values are quite close, especially if we consider that the gas-to-dust ratio is supposed to decrease towards the centre of a galaxy with respect to the mean value we used (Whittet 1992, Sodroski et al. 1994).
The derived column densities supports the idea of an optically thick dust distribution. For instance, the diffuse component of the north-east spiral arms at a 3- level would correspond to a V-band optical depth (Eqn. 2.10). The quite high optical depth corresponding to the sky noise () shows how difficult is to obtain sub-mm images of dust emission in the outskirts of face-on galaxies, even for the high sensitivity of instruments like SCUBA.
4.4 Working procedure
From the observed Stellar SED of Sect. 4.1, a continuous SED has been derived and then integrated over the 17 bands used in the model (Sect. 3.8): the energy emitted in each band (inside the B-band half light radius) is thus obtained.
For each of the bands a radiative transfer simulation is run, to produce an image seen from the same inclination as NGC 6946, i.e. i=34∘. The B-band image is then analysed to measure the half light radius for the simulation. Successively, the intrinsic unextinguished stellar energy emission for each band is derived assuming that the surface brightness measured within the half light radius aperture in the simulation is equal to the observed one. Because of this normalisation, all the models will have the same observed stellar SED for the images at 34∘. The intrinsic unextinguished energy emitted by stars is derived from the observed SED using the information about the fraction of energy absorbed and the distribution of emitted light in the solid angle, both provided by the Monte Carlo code. From the intrinsic unextinguished stellar energy it is possible to derive the observed stellar SED in a dust free case, assuming an isotropic emission and measuring the half light radius for a transparent model.
After the normalisation and the correction for the MIR emission (Sect. 2.5), dust temperatures are computed from the maps of absorbed energy. Knowing the temperature distribution in the galactic model, images of dust emission at FIR wavelength are produced, seen from the same inclination as the optical (Sect. 3.9). FIR images at several wavelengths are integrated inside the model half-light radius and the observed dust emission SED compared to the observed one described in Sect. 4.2. When comparing the model results to the observations, it would be more correct to smooth the images to the resolution of the instruments involved, to be sure to sample the same areas. This is effectively done when a single image is analysed. For the spectrum, instead, I have chosen to present integrations on images at their original resolution333As described in Sect. 3.7, a region of 12 is covered by 201 pixel, thus giving a pixel size of 5.7” (150 pc), for the adopted =95” (see Sect. 4.5). Therefore the ISO beam (117” FWHM) can be modelled by a gaussian of FWHM20 pixels.. Because of the large area of integration, the difference between integrating on images at full resolution or smoothed is generally small, 10%, smaller than the errors of observations.
The spatial distribution of dust emission in the models is also compared to the observed one. Alton et al. (1998a) measured optical and FIR scalelengths for a sample of seven spiral galaxy, after smoothing all the images to the poorest resolution of the 200m ISO images. The ratio between the scalelengths in the B-band, at 100m and 200m, measured by Alton et al. (1998a) on NGC 6946, is presented in Tab. 4.3. It is interesting to note that the scale length ratios for the seven spiral galaxies of Alton et al. sample are quite similar between each other, thus indicating similar dust heating scenarios in different galaxies. The images used in Alton et al. (1998a) are presented in Fig. 4.1.
B 145” 0.92 0.52
To compare the model results with the observations, I have therefore convolved both optical and FIR simulations with a gaussian of the dimension of the ISO beam. After the smoothing, scalelengths were measured in the same range as in Alton et al. (1998a), from 1.5’ to 3.5’ from the galactic centre.
4.5 Adopted scalelengths
For the sake of simplicity, the model presented in this chapter have all the same geometrical distribution of stars. I will study the properties of dust extinction and emission modifying the geometrical parameters of the dust distribution only. Only for a few test cases will I adopt different stellar distributions.
For the stellar component, I use an exponential disk distribution with the same radial scalelength for all the wavebands of the simulation. As for the vertical scalelength, I scale it using the ratio derived in Sect. 3.5. Again, a single vertical scalelength is used for all the wavebands.
The results of this chapter concerning optical, FIR surface brightnesses and temperature distributions do not depend on the absolute values of the scalelengths, as long as the quantities are plotted as functions of scaled galactocentric and vertical distances. However, absolute values are needed if we want to derive correct values for emitted and absorbed energies in each band.
Radial scalelengths have been derived from the images described in Trewhella (1998b; a) (Fig. 4.1). Profiles averaged over elliptical isophotes have been produced, using a position angle and an inclination (Garcia-Gomez & Athanassoula 1991). Under the assumption that the stellar radial scalelength is the same for any waveband, any value measured in the NIR should be closer to the intrinsic, unextinguished one, because of the small extinction in this spectral range. In a K-band image I have obtained , that correspond to 2.5 kpc, for an assumed distance of 5.5 Mpc. As a comparison, B-band scalelength is . Similar values (for the B-band) can be found in the literature (Engargiola 1991, Athanassoula et al. 1993, and references therein).
I therefore use kpc, and 170 kpc.
4.6 The standard model
In radiative transfer models of spiral galaxies, it is usually assumed that and , i.e. the dust disk is half as thick as the stellar one (Byun et al. 1994, Bianchi et al. 1996, Davies et al. 1997, and references therein). This choice of parameters is motivated by the presence of extinction lanes along the major axis of edge-on galaxies, that cannot be explained without a thin dust disk. Moreover, dust is supposed to form preferentially in a young stellar environment, the star distribution of which is thinner than the old stellar population (Sect. 3.5). Therefore I have first produced models with those geometrical parameters for the dust distribution, for four different values of the face-on optical depth in the V-band, 0.5, 1, 5 and 10.
In Fig. 4.4 I present the SED for the four models, both for the intrinsic unextinguished stellar radiation and for the FIR emission. The thick solid line represent the stellar output of the galaxy as derived from the observed data, that is used as an input (Sect. 4.4). Both in this models and in the ones presented later, the spike at 2000Å in the unextinguished SED is produced by the extinction bump at 2175Å characteristic of the Galactic extinction law (Sect. 2.2) to which correspond a flat observed SED.

intrinsic emitted absorbed fraction FIR emitted energy energy energy absorbed energy 1010 L⊙ % 1010 L⊙ 0.5 3.92 3.72 0.20 5 0.13 1.0 4.07 3.72 0.36 9 0.24 5.0 5.71 4.18 1.53 27 1.04 10. 7.57 4.68 2.89 38 1.98
Values for the total energy emitted by the galaxy are given in Table 4.4. Obviously, models with larger optical depths have a larger intrinsic energy output to produce the same amount of observed light. It is interesting to note that the stellar energy output changes with the optical depth as well. This depends on the fact that the model is normalised on the observed surface brightness, i.e. on the amount of stellar radiation that escapes the galaxy along a specific direction from a given aperture. In a transparent model, stellar emission would be isotropic, the amount of energy emitted per unit solid angle independent of the inclination from which the model is observed. In extinguished models, light escapes preferentially along lines of sight at low inclination, because of the reduced path through dust and the effectiveness of scattering with respect to the more inclined cases (Bianchi et al. 1996). The anisotropy of the stellar output increases with the optical depth. Therefore, in a model that emits a given amount of energy when observed at low inclination, a larger amount of energy is emitted over the whole solid angle for an optically thin (i.e. more isotropic) case. The aperture dimension to compute the surface brightness is defined photometrically and this makes it dependent on the optical depth of the model: in an opaque galaxy less radiation comes from the central regions with respect to more transparent cases, resulting in a larger half-light radius. For a given half-light radius surface brightness, optically thin models will require a smaller amount of energy emitted along the given inclination. In models with 0.5 and 1, this two competing effects determine the constancy of the emitted energy. For the larger optical depths, the increase in the half-light radius is the more important, and the emitted energy increases.

Table 4.4 gives the total absorbed energy in each model. The percentage contribution of energy absorbed from each band to the total absorbed energy is shown in Fig. 4.5 (solid line). I show the values for =0.5, since results for the other three models are quite similar. For these standard models, most of the radiation is absorbed from the Optical-NIR wavebands (60% for light at Å). This is quite in contrast with the results obtained by Xu & Buat (1995) carrying out an energy balance on a sample of 134 nearby spirals with available UV, B and IRAS fluxes. They found that 60% of the absorbed radiation comes from light in the non-ionising UV (912Å3650Å). It is difficult to compare this work with Xu & Buat, mainly because of the simplistic sandwich geometry they use. Apart from the geometry, the different result may be due to the assumption of isotropic scattering and smaller albedo for UV radiation with respect to the one used here, this increases extinction in UV, or to a selection effect in favour of bright UV galaxies, although Buat & Xu (1996) dismiss its presence. Trewhella (1998b) model of NGC6946 emission agrees with this work.
Applying the correction of Sect. 2.5, approximately 32% of the total absorbed energy is estimated to go into MIR emission the remaining 68% being available for thermal equilibrium processes and FIR emission. The percentage contribution of each optical band to the FIR emission only is also shown in Fig. 4.5 (dotted line). Since small-grains and PAHs responsible for not-equilibrium processes have an higher absorption efficiency at shorter wavelength, the contribution of absorption from Optical-NIR wavebands is higher after the MIR correction: now the radiation originally emitted at Å contributes 70% of the FIR emission. In the models of the next sections, MIR corrections are quite similar to the one for the standard model and therefore they will not be discussed separately. I will devote Sect. 4.10.5 to a comparison between the estimated and observed MIR emission. The total energy emitted in the FIR is given in Table 4.4.
The temperature distributions for each model are shown in Fig. 4.6, as a function of the galactocentric radius and height above the plane. Apart from the central region, the distributions are very similar. At a galactocentric distance of 3 (essentially the Sun position, for =8.5kpc and =3kpc, see Sect. 3.4), the dust temperature is 21K, as observed towards the poles in our Galaxy (Sect. 2.4.2).
For a dust distribution thinner than the stellar one, the stellar radiation field is expected to increase with the height above the plane in an optically thick model (Draine & Lee 1984, Rowan-Robinson 1986), because the stars closer to the plane are shielded. This is evident in the central regions () of the models: when the optical depth increases, dust at higher temperature is found at higher positions above the plane. In the models with higher extinction, the effect can still be followed at bigger galactocentric distances, the region at higher temperature approaching the galactic plane at large distances. Vertical gradients are very shallow, because of the greater extent of the galaxy in the radial direction with respect to the vertical and because the stellar distribution is smooth. For larger optical depths, the effect previously described contributes to make them even smaller.
The FIR spectrum produced by these temperature distributions is shown in Fig. 4.4. It is evident that only models with optical depth between =5 and 10 produce enough energy to match the observational data. This is a general property of all the models we are going to discuss: a substantial extinction is necessary to produce the observed SED in the FIR. The total amount of energy emitted in the FIR is 1-2 1010 L⊙, that correspond to a fraction 0.25-0.42 of the energy emitted by the galaxy in the UV-Optical-NIR (Table 4.4). Therefore, of the bolometric luminosity of the galaxy is absorbed by dust. An analogous result is obtained by Xu & Buat (1995) for their sample of 134 nearby galaxies.
The peak of the FIR emission is quite close to 100m, corresponding to an effective temperatures slightly smaller than 30K. The peak temperature is thus a reflection of the temperature of the central regions of the galaxy. Optically thick models have the maximum shifted towards longer wavelengths with respect to optically thin cases, because of the smaller temperatures (Fig. 4.6).
The ratio between scalelengths, measured on optical and FIR images as described in Sect. 4.4, are presented in Table 4.5. No one of the models is able to reproduce the observed ratios of Table 4.3. Increasing the optical depth, the FIR scalelengths increase, because of the smaller temperature in the centre. But at the same time the optical profiles become flatter, because of extinction. The increase in the ratio B/ is dominated by the second effect. Because the amount of dust colder than 20K is not large in any of the models, the emission at is caused by grains at the same temperature as for the emission at . Therefore the ratio is not sensitive to the optical depth.
0.5 1.44 0.81 1.0 1.47 0.81 5.0 1.88 0.84 10. 2.30 0.85
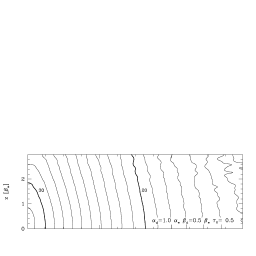
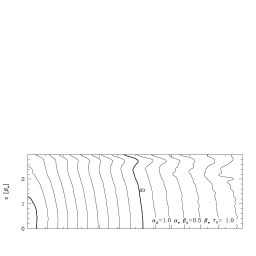


To summarise the results of this section, standard models can reproduce the observed temperature and the FIR spectrum (as long as the dust disk is optically thick). On the contrary, it is not possible to reproduce the spatial distribution of the emission: the FIR scalelengths are too small compare to the optical, while in the observations they are of the same order (Alton et al. 1998a). The large optical depths required to match the observed FIR spectrum concur in aggravating the problem, because of the increase of optical scalelengths with extinction.
Larger FIR scalelengths can be obtained with dust disks more extended than the stellar: I explore this possibility in the next Sections. But first two tests are presented, to study how the results of this work are influenced by the use of different stellar distributions.
4.7 Test: two different stellar distributions
As stated in Sect. 4.5, in the models of this thesis I analyse emission and extinction changing the parameters of the dust distribution but keeping the same disk stellar distribution in all the cases. Are the results dependent on this assumption? To answer this question, I present in this Section the results obtained using two different stellar distribution.
Different stellar populations have different scaleheights, the younger stars being distributed in a thinner disk than the older. As a result, vertical scalelengths at shorter wavelengths are smaller (Sect. 3.5). The first model has therefore a stellar distribution whose vertical scalelength changes with wavelength. From the Galactic vertical scalelengths in B and V as in Tab. 3.1, I have derived a mean value that I use for the simulations from EUV to the V-band. From the values for J, H and K-band, I derive , to be used for the remaining bands in the optical-NIR. As for the radial scalelength, I use again kpc, thus having pc and pc. The dust distribution of the model has the same scalelengths as the young stellar population.
The second stellar distribution includes a bulge, together with the same stellar disk as the standard model. In a late type galaxy such as NGC 6946, the contribution of the bulge to the observed optical properties is not big. Nevertheless the presence of a concentrated, almost point-like, source in the middle of the dust disk could alter the temperature distribution significantly, and the dust emission as well. For the bulge I have used an exponential distribution :
| (4.1) |
where is the central luminosity density, is the distance from the centre and the bulge scalelength. Actually, the exponential has been used to describe the surface brightness of bulges, i.e. the projection of Eqn. (4.1) on the plane of the sky (De Jong 1996b). De Jong (1996c) finds that the ratio between the observed scalelengths of bulge and disk in a sample of 86 face-on galaxies is approximately 1/10. To produce this observed , the intrinsic in Eqn. (4.1) needs to be times smaller, for a bulge truncated at 6. For the stellar disk kpc, pc. I have assumed a bulge to disk ratio of 0.1, suitable for late type galaxy bulges (De Jong 1996c, G. Moriondo, private communication).

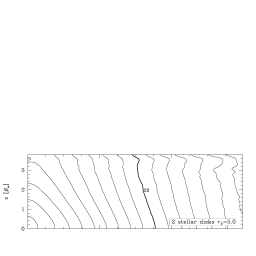

In Fig. 4.7 I present the SEDs of the two test cases, for . The SED of the standard model with the same optical depth is shown for comparison. The two test models have spectral energy distributions very similar to the standard one. Intrinsic, emitted and absorbed energy are quite similar as well, apart from small variation due to the different spatial distribution of dust and stars. The emitted FIR energy is 10.
The temperature distributions for the case are shown in Fig. 4.8. For the case with bulge, the pattern of the distribution out of the centre is very similar to the one observed for the standard case: this is not a surprise, since both have the same stellar and dust disk, with a bulge that extends only up to 0.5 . In the centre, the presence of the bulge introduce a stronger gradient, because of the more concentrated light emission. Temperatures in the core region reach higher values than for the standard model. As for the standard model, the shielding caused by dust makes central regions at higher hotter than those in the plane.
In the case of a disk with different scale heights, the shielding effect is not present, because for higher optical depths (shortward of the V-band) the stellar distribution is co-spatial with the dust. The centroidal pattern, with hotter regions closer to the centre of the galaxy, is typical of dust distributions with scale heights equal to or larger than the stellar (see Sect. 4.8). Temperature values are of the same order as for the previous models.
I have also tried models with smaller optical depths, the results for the energy output and temperature distributions showing the same trend as for the standard model.
The temperature distributions of the test models produce a FIR emission quite similar to the standard model, and similar ratios of optical and FIR scalelengths. Again, the B/ is smaller for smaller optical depth, the change with optical depth being dominated by the increase of the B scalelength with the optical depth. For the two stellar scaleheights model, B profiles are flatter, because in the B-band dust and stars have the same thickness, while in the model inclusive of bulge, B profiles are steeper, the bulge affecting the profile after smoothing to the ISO resolution. Nevertheless, these changes in the B profile are small. Similar results to the standard model are found also for the 100/200 scalelength ratio. The value for the disk model is the same as for the standard, while for the bulge, the presence of an hotter centre reduce the ratio by 6% only, not enough to justify the observed one.
In summary, the two (more realistic?) stellar distribution do not produce results significantly different from the stellar disk described in Sect. 4.5, this is therefore used in the rest of the thesis.
4.8 Extended disk models
As outlined in Sect. 1.6 and 3.6 there is evidence for dust distributions more extended than the stellar, both from optical and FIR observations. To analyse the effect of a large dust disk on the FIR emission, I have first ran models with a larger dust radial scalelength, , keeping the other parameters as for the standard model of Sect. 4.6.
The SED of an extended model with optical depth and (Davies et al. 1997, Xilouris et al. 1999) is shown in Fig. 4.9, together with the standard model of the same optical depth. As for models of Sect. 4.6, only optically thick cases are able to match the observed SED. For the same optical depth the extended model has an higher extinction (e.g. 44% of the energy is absorbed in the V-band against the 34% of the standard model). This is evident in the SED of FIR and intrinsic optical radiation shown in Fig. 4.9.

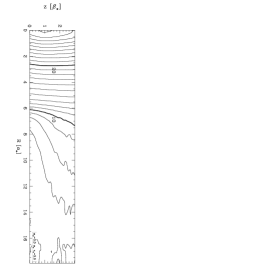
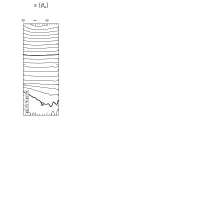
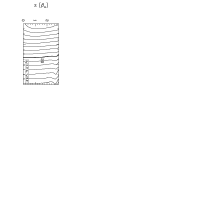
The temperature distribution for the extended model is shown in the central panel of Fig. 4.10. For ease of comparison, the temperature distribution of the standard model is shown again (in the right panel), with the same scale as for the new model. Within a radius of 6 (the extent of the stellar disk) the temperature pattern of the extended model is quite similar, apart from a small difference due to the normalisation. This is reflected in the peak of the FIR SED, that is essentially the same in both the models. Outside of the 6, the truncation of the stellar distribution, dust is colder and it does not modify the shape of the SED. The steeper gradient in the temperature distribution that can be observed in this and the other extended models at 6 is obviously due to the truncation of the stellar disk. A truncation is indeed suggested by counts of faint stellar sources in the Galaxy (Sect. 3.5). I have run a few tests with stellar distributions truncated at the same distance as the dust disks, to avoid having dust in regions without local stellar emission. The steeper gradient disappears and a larger distance is needed to reach the same temperature. However, the changes are small. The general trend in the temperature distributions is conserved and the maps of FIR emission are not modified sensibly. It is interesting to note that for , dust is colder on the plane than above, because starlight is seen through higher optical depths along the plane. The temperature distribution of extended models at smaller optical depths has the same general characteristics as for the case presented here.
With regard to scalelengths, the same problem as for the standard model is present in the extended model. Despite the increase of FIR scalelengths in a model with extended dust distribution, the effect is not as large to compensate for the increase of the B scalelength in optically thick models. Therefore, an optically thick models are necessary to have a FIR energy output that matches observations, while optically thin models have ratios of scalelengths closer to the observed. For models with , the ratio B/200 is 1.15 and it increases with the optical depth. The ratio 100/200 is 0.75, almost independent of the optical depth.
A further increase in the dust scalelength can solve the problem. The SED for a extended model with and =3 is also presented in Fig. 4.9. As already seen, extending the dust scalelength results in a larger fraction of energy absorbed, for the same optical depth. Therefore a smaller optical depth, but still in the optically thick regime, can provide the right amount of absorbed energy. The new model gives a fit to the SED as good as the previous one. The assumed dust scalelength is the same as the one that can be derived from the distribution of atomic gas, although a smaller optical depth is derived from HI observation, if the local gas-to-dust mass ratio is assumed (Sect. 4.9). The temperature distribution is presented in the left panel of Fig. 4.10. The behaviour of the temperature values is analogous to the one for the model, although a larger quantity of colder dust is present. The resulting FIR scalelengths are larger. This, together with the reduction in the optical depth, leads to a B/200 scalelengths ratio of 0.98, close to the observed value. The 100/200 scalelengths ratio is again bigger than the observed, with a value of 0.66.
Fitting the Galactic FIR emission observed by the instrument DIRBE aboard the satellite COBE, Davies et al. (1997) find that also the vertical scalelength of dust should be larger than the stellar. Following their results, I have studied the effects of increasing the ratio from 0.5 (standard model) to 2, for the extended model with . A model with a dust vertical scale height larger that that of the stars obviously suffers a bigger extinction (now 60% of the energy is absorbed in the V-band), because part of the dust distribution act as a screen in front of dust, i.e. the most effective distribution in extinguishing radiation. Despite the increase in extinction, optically thick models are still required to match the observed FIR emission (Fig. 4.9).
The temperature distribution for this model is shown in Fig. 4.11. Temperatures are generally higher than those for the previous models and this is reflected in the small displacement in the peak of the FIR SED in Fig. 4.9. The temperature pattern is centroidal, typical of source being less concentrated spatially than the absorbers. Outside of the stellar region, above 6, the vertical gradient reduces, becoming more similar to the models with a smaller dust scaleheight. This is because in this region scattered light contributes to the radiation field, and it is distributed with the dust.
For optically thin models, the extended vertical scalelength does not introduce changes in the ratio between optical and FIR scalelengths. In the optically thick case, though, the B-band scalelength is increased as an effect of extinction and the ratio B/200 becomes larger.
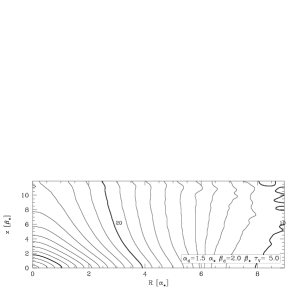
In conclusions, models with dust distribution more extended radially than the stars have ratios between optical and FIR scalelengths smaller than in standard models. As for standard models, optically thick cases are required to match the observed FIR SED. For the scalelengths ratio to be close to the observed value in optically thick model, it is necessary to have a dust distribution with . Such a scalelength is similar to that derived from HI observations (Sect. 4.9). The model with deduced from the works of Davies et al. (1997) and Xilouris et al. (1999), instead, can provide small values of the scalelength ratio only in the optically thin case, while the optically thick case is still required to match the observed FIR SED. Assuming does not improve the modelling.
4.9 A model with two dust disks
Tacconi & Young observed NGC 6946 both in the HI (1986) and in CO emission (1989). From the observations they derived the column densities of atomic and molecular hydrogen as a function of the galactocentric radius (Tacconi & Young 1986). H2 column density was observed to have a steep profile, with an exponential scalelength quite close to that of the optical emission ( 90”, i.e. 1 , according to the values adopted in Sect. 4.5). The atomic gas, instead, presents a dip in the centre, the column density reaching a maximum at 180” ( 2 ), then declining exponentially with a scalelength of 300” ( 3 ). Both molecular and atomic gas have the same column density ( H atoms cm-2) at 250”. HI and H2 have almost the same masses but the atomic gas is distributed on a much broader distribution. The gas morphology observed in NGC 6946, with a central peak and monotonically decreasing H2 column density and a much shallower HI profile, is typical of late type spiral galaxies (Young & Scoville 1991).
Since the H2 distribution follows closely the emission detected by IRAS, Davies et al. (1999b) suggest that cold dust associated with the atomic gas component could be responsible for the broader m profile. As shown in Sect. 4.8, broad distributions of dust have colder temperature than the standard one in the outer skirts: this affects the emission at longer wavelength producing broader profiles. Motivated by the observations, I have therefore introduced a second dust disk in the model, to represent the dust associated with HI. To mimic the column density of atomic gas, the dust density of this disk falls off exponentially with a scalelength of 3 at R , being flat for smaller radii. A standard disk as described in Sect. 4.6 has been used for the dust associated with the molecular component. Following the results of Sect. 4.8, a larger vertical scalelength does not improve significantly the modelling: I have thus used for both the disks.
As for the optical depth of the model, it has been derived from the gas column density of Tacconi & Young (1986), using the relation between E(B-V) and total hydrogen (atomic + molecular) column density of Eqn. (2.10), together with the mean Galactic extinction law (Sect. 2.1). Extrapolating from the column density at 250”, we derived a central face-on optical depth for the dust associated with the molecular disk and for the atomic gas disk. Using the central value given by Tacconi & Young (1986) a larger central optical depth would have been derived ( 18): the central region may be the site of a moderate starburst (Engargiola 1991) and have different characteristics with respect to the smooth medium. I have therefore preferred the extrapolated value. A high optical depth through the central region of the galaxy has also been derived by Engargiola (1991) and Devereux & Young (1993). Evans (1992) derived a central face-on optical depth of , using a TRIPLEX model (Sect. 3.1) and the energy balance method. The optically thick central region is also confirmed by the high resolution extinction maps of Trewhella (1998b; a).
The SED for this new model is presented in Fig. 4.12, together with the SED for the standard model with the same optical depth as the dust disk associated with the molecular component (). The FIR output is higher that than of the standard model, because of the extra dust disk. The temperature distribution inside the stellar disk is similar in the two models (as the peak of FIR emission shows) while the behaviour at larger radii is close to that of the extended model of Sect. 4.8 in the same region.
As seen in Sect. 4.8, an extended model with can produce large FIR scalelengths. However, in the model of this Section, the disk associated with the molecular component dominates the FIR emission. The behaviour of the model is close to that of a high optical depth standard model rather that to an extended model, with a B/200 ratio 1.86.

I have also ran double disk models reducing the optical depth of the disk associated with the molecular component. The simulations for 1 and 5 are also presented in Fig. 4.12. Like in the case of Sect. 4.8, a model with matches quite well the FIR emission, but the scalelengths ratio is higher than for an extended disk. The same for the model with , that is not able to fit the observed SED.
Therefore, it is not possible to explain the observed ratio of FIR and optical scalelengths with a double disk model inferred from the observed distributions of molecular and atomic gas.
4.10 Discussion
In this section I discuss a few aspects of the models presented up to this point, to provide an ensemble view of the variation of FIR scalelength, emission and dust temperature with the varying parameters of the dust distribution. Also discussed is the validity of the approximations of the model, namely, the assumption of smooth distributions for stars and dust, the neglect of the ionising UV in the stellar SED and the MIR correction, used to derive the FIR emission from the total energy absorbed by dust.
4.10.1 FIR scalelengths and SEDs
Once a model for the radiative transfer in a spiral galaxy is available, it is relatively simple to derive an optical depth comparing the stellar SED and the FIR emission from dust. This energy balance method has been applied on NGC 6946 by Evans (1992) and Trewhella (1998b; a), using essentially the same set of data as in this work. Both the authors used the TRIPLEX model of Disney et al. (1989), i.e. an analytical approximation for the radiative transfer, neglecting scattering, in a standard model. The neglect of scattering results in an underestimate of the optical depth, since the effective opacity decreases when dust is allowed to diffuse radiation (Bianchi et al. 1996): Trewhella (1998b; a) corrected for this effect assuming that a model inclusive of scattering can be simulated by a pure absorption TRIPLEX with optical depth reduced by a factor (1-). Their results are compatible with NGC 6946 being optically thick through its centre.
When I constrain the fit to the energy balance only, I obtain analogous results for the standard model: optically thick models with face-on optical depth 5 are necessary to match the observed SED. From a sample of 134 nearby spirals with the same ratio of bolometric luminosity absorbed by dust ( 1/3) as in NGC 6946, Xu & Buat (1995) derived a mean optical depth , compatible with the sample being optically thin. This is mainly because they used a plane parallel sandwich model and their optical depth is more representative of a mean opacity over the whole galactic disk rather than the central value.
However, the main aim of the model of this thesis is to describe both the SED of the FIR emission and its spatial distribution. Alton et al. (1998a) measured a value close to unity for the ratio between the scalelengths of images in the B band and at 200m, in a sample of seven galaxies including NGC 6946. The FIR scalelength increase with the optical depth, for any model and dust emission wavelength. Unfortunately, for the optically thick model necessary to match the SED, the B-band scalelength increases with the optical depth, because of the extinction. Therefore, the ratio B/200 is smaller in the optically thin cases.
Besides, the scalelength ratio measured on standard models is always larger than the observed, even for small values of the optical depth. Values close to unity can be explained only if the dust distribution is more extended radially than the stellar one (Davies et al. 1999b). Fits of surface brightness in edge-on galaxies (Xilouris et al. 1999) and models of FIR emission (Davies et al. 1997), suggest that the dust scalelength is 1.5 times the stellar. When such an extended model is adopted (Sect. 4.8) FIR scalelengths are indeed larger than those for the standard model, for any value of the optical depth and of the wavelength of emission. Now values closer to the observed can be reached, but still the increase of the B-band scalelength with the opacity is high enough to compensate for the increase in the FIR scalelengths. We are therefore in front of two mutually exclusive situations: optically thin extended models that have both B and 200m consistent with observations, but with a FIR output smaller than the observed; and an optically thick model with the required SED, but with 200m emission more concentrated than the optical one.
To obtain a value for the B/200 scalelengths ratio close to the observed, still being able to produce an adequate energy output in the FIR, it is necessary to increase further the dust scalelength. A optically thick model with and is indeed able to provide a good fit of both the B/200 scalelengths ratio and the dust emission SED. The dust distribution in this case has a scalelength similar to that observed for the atomic gas in NGC 6946, although a smaller optical depth is derived from HI observations, under the assumption of a gas-to-dust ratio as in the solar neighborhood (Sect. 4.9). In Sect. 4.9 I produced a model with two dust distributions, associated to both the gas components. As already said, the atomic gas requires an optically thin, extended disk, while the molecular gas suggest an optically thick standard distribution. Such a model fails to reproduce the observed properties, since it is the optically thick disk associated with the molecular component that dominates the model behaviour.
For NGC 6946 the scalelength derived from the 100m IRAS image is of that for the 200m ISO observation (Alton et al. 1998a, Davies et al. 1999b). For the models presented here, the ratio 100/200 is larger, always bigger than 0.7. As already outlined, this ratio depends mainly on the geometric properties of the dust distribution; for a specific model, the ratio 100/200 is almost constant with the optical depth, both the scalelengths increasing at the same rate with increasing opacity. This is because both emissions are due to dust at the same temperature. A larger scalelength for the 200m emission would be possible if there is a large amount of extended cold dust emitting in this wavelength but not at 100m. Indeed, when extended models are considered, the ratio 100/200 is smaller than for the standard model, because dust at temperatures lower than 15K is present. Nevertheless, the amount of colder dust is never enough to match the observed values.
On the other hand, the small value for 100/200 could also be due to more concentrated hot dust, this time contributing most to the 100m than to the 200m emission. This would be the case if dust is heated preferentially from hot stars in HII regions (See Sect. 4.10.3). Due to this uncertainty, it is better to use the B/200 scalelength ratio, rather than the 100/200, to discriminate between models.
4.10.2 Temperatures
In this section I compare the temperature distribution in the model with temperatures actually measured. As shown previously, the temperature distribution does not change substantially from one model to the other. In Fig. 4.13 I plot, for three representative models, the temperature along the galactic plane as a function of the galactocentric distance. I chose a standard model (Sect. 4.6), a model with dust vertical scalelength changing from the UV to the NIR (Sect. 4.7) and a model with . In all the three models and . Models with parameters different from the plotted ones have similar spans in the temperature distributions.

The best determination of temperatures for dust heated by the diffuse ISRF are those obtained for the Galaxy, because of the availability of high signal-to-noise spectra and images at m (mainly from instruments aboard the satellite COBE). Shorter wavelengths may trace hotter dust associated with star-forming regions and are certainly contaminated by non-thermal emission from very small grains. The latter seems to be the explanation of the relative constancy with longitude of the temperature along the Galactic plane derived from the use of 60m and 100m IRAS data only (Sodroski et al. 1989). When 140m and 240m images from the instrument DIRBE on board of COBE are used (Sodroski et al. 1994; 1997), derived temperatures decrease as a function of the Galactocentric distance, as predicted for the ISRF (that shows the same behaviour).
Determination of temperature in the Galaxy (as well as in other edge-on galaxies) is affected by a projection effect: when a single temperature is assumed to fit a spectrum or a flux ratio along a specific line of sight through the Galaxy, results are biased towards higher values of the temperature (Sodroski et al. 1994). The bias is not strong, since the radial gradients derived on the Galaxy are very shallow: Sodroski et al. (1994) compared the observed variation with longitude and latitude of the temperature derived from 140m and 240m DIRBE data and conclude that it is consistent with a model where the temperature varies exponentially with a radial scalelength of 21 kpc; a scalelength of 35.7 is derived by Davies et al. (1997), after fitting the temperature variation with longitude and latitude and the DIRBE fluxes at 140m and 240m with an extended dust model (Sect. 4.8). The slopes for these two exponentials at the Sun distance from the centre of the Galaxy are shown in Fig. 4.13.
The models previously described present very small variation of temperature with the height above the galactic plane. Therefore it is straightforward to derive a temperature for dust at the Sun distance, observing FIR emission at high latitudes. Using the temperature maps derived by Schlegel et al. (1998) from 100 m and 240 m DIRBE images, the mean temperature for a region of 20∘ diameter around the Galactic north pole is 21K, when the data are corrected for the emissivity law used in this work (Eqn. (2.33); see also Sect. 2.4.2). After an analogous correction, this temperature is consistent with the temperature of the warm component derived by Reach et al. (1995) using high latitude spectra at m observed by another instrument aboard COBE, the spectrophotometer FIRAS. This value is also presented in Fig. 4.13.
Sodroski et al. (1997) use three-dimensional HI and H2 maps (assuming a Galactic rotation curve to convert velocities into distances) and thermal radio-continuum observations to decompose the Galactic FIR emission observed by DIRBE into three components, associated with the atomic, molecular and the ionised gas phases. Several properties, among which the temperature, are retrieved for each of the dust component in four annuli at different distances from the centre. The component associated with the atomic gas is supposed to be heated by the diffuse ISRF. I plot in Fig. 4.13 the temperature of the dust associated with the atomic gas for each annulus, after scaling the distances to a Galactic scalelength kpc and correcting the temperature for the emissivity law used in this work. The vertical error bar represent the error in the temperature determination, while the horizontal the width of each annulus. From Fig. 4.13 it seems that models with a larger ratio between the vertical scalelength of dust and stars describe better the temperature profile. However, the decomposition of Sodroski et al. has large errors. Furthermore, the mean temperatures for each annulus are biased towards the higher values and thus are more representative of a point inner in the circle, rather than the mid-point for which they have been plotted. Therefore, on the basis of their temperature profiles, none of the models in Fig. 4.13 can be excluded, all of them being consistent with the observed data.
More difficult is to derive temperature gradients in external galaxies, because of the lack of resolution and of the low signal-to noise. When IRAS fluxes at 60m and 100m are used, the temperature distributions are flat (Devereux & Young 1992; 1993), as observed in the Galaxy. This is the case also for NGC 6946: 60m and 100m radial profiles have the same gradient up to 3 scalelength from the centre (Alton et al. 1998a, Davies et al. 1999b).
Deriving a gradient for the temperature of the dust component in thermal equilibrium with the ISRF is even more difficult, because of the poorer resolution at 200m. To compare model results with observations, I have smoothed to the ISO resolution (Sect. 4.4) both 100m and 200m images for the same models as in Fig. 4.13. The temperature profiles derived from the ratio of fluxes at this two wavelengths are shown in Fig. 4.14. Davies et al. (1999b) derived the temperatures from 100m IRAS and 200m ISO fluxes at two different position on NGC 6946, in the centre and on the disk, at a distance of 3 arcmin from the centre (). I have plotted in Fig. 4.14 their data derived for ; this temperature should be close to those that would have been derived using the emissivity law of this thesis, since in this spectral range it has a slope , turning to a steeper for m (Eqn. 2.33). The errors on the temperature have been derived from the errors on ISO and IRAS fluxes quoted in Sect. 4.2, while the error bars on the positions reflect the wide aperture (of the dimension of an ISO resolution element), for which the temperature have been derived.

Again, all the models are consistent with the observations, within their large errors.
4.10.3 The dust heating mechanism: ISRF vs hot stars
The present models make use of smooth distributions for stars and dust. Therefore, the model is appropriate to describe dust heated by a smooth, diffuse ISRF. Instead, dust close to hot stars in star-forming regions is heated by a more intense radiation field and reaches higher temperatures.
There is a debate about which of these two heating mechanisms is dominant in a spiral galaxy. If dust heated by hot-star in star forming regions contributes to the majority of the FIR emission, then it is possible to use FIR fluxes to measure the recent star-formation in a galaxy. Devereux & Young in a series of papers (Devereux & Young 1990b; 1991; 1992; 1993) suggest that the FIR luminosity is dominated by warm dust that absorb radiation from OB stars. They argue that the ISRF can only heat dust to temperatures of 15-20K, rather than the 30-40K usually observed in spiral galaxies (Devereux & Young 1991). I have shown here that higher temperatures are compatible with realistic models of the ISRF. Moreover, their warm dust temperatures are derived from 60 and 100m IRAS fluxes, that may be contaminated by small grains (Sodroski et al. 1989). Xu & Helou (1996a) derived the fraction of the total FIR luminosity associated with star-formation, using observations of IRAS-resolved bright HII regions. A value of 3014% is found.
When COBE observations of the Galaxy at 140m and 240m are used, a different picture emerges: most of the FIR emission (70%) arises from dust associated with the atomic gas (Sodroski et al. 1994). The longitude and radial gradients (Sodroski et al. 1997) of the temperature are consistent with this dust being heated by the ISRF. 20% of the FIR is emitted by dust associated with the molecular component. Dust associated with the molecular gas is heated primarily by embedded OB stars and secondarily by the ISRF (Sodroski et al. 1997). Nevertheless its temperature is similar to that of the dust associated with the atomic gas. Finally, only 10% is due to hot dust associated with the HII phase.
It is not easy to evaluate how the results of this chapter depend on the assumption about smooth distributions. If hot stars emitting mainly in the UV are subject to a larger and localised extinction, as it would be the case for newly born stars still located in HII regions embedded in molecular clouds, their contribution to the FIR output would be higher than in my model, both because of the larger absorbed energy and higher temperature of the dust. Therefore the derived optical depths for the smooth medium may be overestimated in this work.
As a test, I can try to add the emission from hot-stars to the FIR spectrum derived by the model. In Fig. 4.15 I plot the FIR spectrum for a standard model with . The radiation from dust heated by OB stars can be simulated by a grey-body spectrum with a temperature of 40K, as derived from the temperature of dust associated with the HII phase in the inner Galaxy (Sodroski et al. 1997) using the emissivity of Eqn. 2.33. The hot dust spectrum has been normalised to contribute to the 30% of the total FIR (as from Xu & Helou (1996a) work).
Adding the hot component emission obviously results in an stronger FIR emission, especially around the peak of hot dust emission. Nevertheless, the difference between the new SED and the original is within the errors in the observation. Thus, for the accuracy with which FIR fluxes are presently observed, the determination of the optical depth is not severely affected by the smooth distribution assumption. Moreover, the contribution of the hot dust is overestimated, the spectrum of the standard model already including the contribution to the FIR output of light absorbed from the UV, although absorbed by the smooth medium only.
A proper description will be possible only with the inclusion of clumping in the model, necessary both for dust and stars. The core of a dense clump of dust, in fact, is shielded from the stellar radiation and the dust temperature is lower than for dust in the smooth medium. On the other hand, it is inside denser regions of gas (and dust) than star formation occurs. Therefore a clumping model should take into account the presence of sources embedded in dust. In this case dust in the clump would be at higher temperatures than in the smooth medium and the contribution of hot stars to the FIR emission could be evaluated.

4.10.4 The ionising ultraviolet
As outlined in Sect. 4.1, I do not consider the contribution of absorption of ionising UV photons (Å) to the dust emission. In this section I evaluate the impact of this assumption.
The shape of the spectrum heavily depends critically on the assumed parameter for the evolution model (Fioc & Rocca-Volmerange 1997), I estimate it from H observations, the H flux being related to the strength of the ionising radiation. Kennicutt & Kent (1983) measured a H flux for NGC 6946
| (4.2) |
The flux is contaminated by [NII] lines, but they derived a correction from a sample of galaxies with available spectroscopy: for spiral galaxies, 75% of that emission is due to H only. Similar values for the flux are measured by Devereux & Young (1993). Galactic extinction in the direction of NGC 6946 is corresponding to . Applying those corrections the flux is
| (4.3) |
The intrinsic H flux can be derived if the internal extinction in the galaxy is known: for a standard model with , 30% of the radiation is absorbed in the R-band (in whose spectral range the H line is located), the intrinsic flux being therefore
| (4.4) |
From the H flux, assuming a standard ionisation condition in HII regions, the luminosity in the ionising (Lyman) continuum can be found (Lequeux 1980). Following Xu & Buat (1995), the Lyman continuum flux can be derived as
| (4.5) |
where 75% of the ionising radiation is assumed to be absorbed by gas and converted in emission lines at larger wavelengths (see also Mezger 1978, DeGioia-Eastwood 1992). If the remaining 25% is entirely absorbed by dust, the ionising flux converted into infrared radiation is
| (4.6) |
In the Far UV the extinction law is dominated by small grain absorption, therefore most of the energy absorbed from the ionising flux goes into MIR radiation from stochastically heated grains (Sect. 2.5). Assuming that 28% of the energy absorbed goes into thermal radiation in the FIR444This is an upper limit, derived from the MIR correction of the EUV band, Table 2.1. In the ionising UV the contribution of absorbed photons to the non-equilibrium heating is higher, the ionising flux contributes to the FIR emission with a luminosity
| (4.7) |
where a distance of 5.5 Mpc has been assumed. In a standard model with =5 the total FIR luminosity is
| (4.8) |
and the contribution from ionising UV would then be 2%. As a comparison, the contribution to FIR from the EUV band for the same model is 3.6%. I have used in this section the standard model because it provides the same amount of FIR energy as the observed. In models with higher extinction, like those of Sec. 4.8, the contribution of the ionising UV is smaller, the FIR energy output increasing faster with extinction than the infrared emission arising from Lyc photons (Eqn. 4.6). On the contrary, models with smaller extinction have higher ionising UV contribution. In a standard model with =1, for example, 6% of the total absorbed energy is coming from ionising photons, while only 4% comes from the EUV band. In any case, the energy output of this model does not match the observed one (Sect. 4.6).
Therefore, I conclude that disregarding the contribution of the ionising UV to the total absorbed energy does not modify substantially the results obtained in this chapter. Xu & Buat (1995) argue that the ionising UV contributes as much as 20% to the total FIR emission in a sample of 23 late type galaxies. Their UV contribution includes direct absorption of Lyc photons and indirect (via emission lines). It is difficult to compare this result to the one derived here, since in the present model the absorption of emission line photons is taken care of in the spectral band where the emission occurs (e.g. in the R-band as in this section for the H line), the eventual contribution of re-combination summed up to the stellar SED for each band. Nevertheless, the ratio between Lyc emission and total absorbed energy (their FIR, including MIR radiation) is similar to the one derived for the standard =5 model.
4.10.5 Estimated and observed MIR emission
To compute the dust temperature at the thermal equilibrium (Sect. 3.9) I have excluded from the total absorbed energy the fraction that goes into non-equilibrium heating. This energy is essentially re-emitted in the MIR spectral range. In this section I compare the derived MIR energy output with the one observed in NGC 6946.
The fraction of absorbed energy that goes into MIR emission depends essentially on the absorption of light from the short wavelength spectrum, since the absorption efficiency of small grains responsible for non-equilibrium processes is higher in the UV (Sect. 2.5). For models where the dust scaleheight is smaller than the stellar, the amount of energy absorbed from UV bands does not increase very much with the optical depth (The saturation effect, Bianchi et al. 1996). The MIR corrections for these models are therefore quite constant, 32% of the total absorbed energy being re-emitted in the MIR. In optically thin models this fraction is still constant when more extended vertical distributions are concerned. Optically thick models with vertically extended distributions have a higher efficiency in extinguishing radiation (they are closer to a screen model) and therefore the fraction of energy absorbed in bands with higher optical depth is larger. As an example, for a model with and (Sect. 4.8), the amount of energy absorbed in the band UV2 changes from 58% to 69% when the vertical scalelength is doubled, while the absorption in the J band changes only from 24% to 25%. The MIR correction therefore increases, but not by a large amount, being 41% for the model with both radial and vertical extended dust distributions.
For a local Interstellar Radiation Field (Désert et al. 1990) the contribution of small grain emission to the 60 m IRAS band is 62%, while at 200 m it is only 14% and at 200 m 4%. Therefore, the fraction of energy emitted in non equilibrium heating can be roughly estimated measuring the MIR emission shortward of 60 m. After integrating a continuous SED interpolated from the data points in Table 4.2, the MIR energy is derived to be 34% of the total infrared energy emitted by dust. The same value is found when the data provided by Engargiola (1991) for the whole galaxy, rather than for the half light radius, are used.
The value derived from observation is very close to the model one. This justifies the use of Désert et al. (1990) dust model as described in Sect. 2.5. It is interesting to note that the infrared galactic spectrum used in the Désert et al. (1990) model is different from the one of NGC 6946. As an example, the ratio between fluxes at 60 m and 100 m is 0.2, while it is 0.5 with our NGC 6946 data. This does not necessarily mean that the dust model of Désert et al. (1990) cannot be applied to NGC 6946. The different ratio could be due to the different heating condition in the local interstellar radiation field, with respect to the mean radiation field in NGC 6946. Larger ratios between 60 m and 100 m can be derived from Désert et al. (1990) model when the ISRF is larger than the local.
4.11 A halo of dust
Yet another possible distribution for dust remain to be explored: a spherical halo. A reasonable amount of cold dust at large distance above the galactic plane can provide a FIR emission at larger scalelengths than those obtained for the extended disk seen in Sect. 4.8 and 4.9.
A significant fraction of the total mass of dust produced by a galaxy during its lifetime can be injected into the halo because of the imbalance between the radiation pressure and the galactic gravitational force (Davies et al. 1999a). Unfortunately, information about the density and distribution of a putative dusty halo are by far more uncertain than those for the dusty disks. A dust halo would act as a screen distribution for the galaxy and therefore will not produce a substantial differential extinction on different parts of the galaxy, unless it has a steep gradient. Thus it would be impossible to detect it fitting the optical appearance with a radiative transfer model, as in the works of Xilouris et al. (1997; 1998; 1999). Zaritsky (1994) analyses the difference in colours of background galaxies between fields at different distances from the centre of two nearby galaxies; he find that fields at a projected galactocentric distance of 60 kpc have a B-I colour excess of 0.067 with respect to fields at a distance of 220 kpc. This suggests the presence of a halo of dust, although a better statistical determination is required since there is only a 2 difference. Comparing his result with observations of the mean opacity through the centre of spiral galaxies (=1.0) he derives a halo scalelength of 318 kpc. Since the halo dust component may be unrelated to the dusty disk, he argues that this leads to a lower limit for the scale length, provided the central optical depth is not severely underestimated.
Due to the lack of reasonable constrains, the parameters with which I describe the halo dust distribution in this section do not have a physical justification. However, the models I will present can be regarded as an exercise, to show what the influence of such a distribution could be on the FIR emission. The parameters are chosen on the basis of the results of the model presented earlier. Obviously the halo cannot be the only dust component in a galaxy, since observations of edge-on galaxies clearly show the existence of a flat dust distribution that produces the extinction lane. In this section I will use a standard dust disk. As for the dusty halo, I use a constant density spherical distribution, that extends up to the boundaries of the dust disk. This means a radius of 6=15kpc, the maximum radius of the dust disk.
As seen in the previous sections, an optical depth =5 for the dusty disk is necessary to produce the same amount of FIR emission as observed. A constant dust halo, acting as a screen, will be very effective in extinguishing radiation, therefore I chose for this structure an optically thin status, =0.1, not to alter significantly the energy output. The SED in the FIR is shown in Fig. 4.16; as predicted, the dust halo does not introduce a big difference in extinction and emission. The temperature distribution for this model is shown in Fig. 4.17. It shows a centroidal pattern, as already seen for models with stellar emission completely inside the dust distribution (Sect. 4.7 and 4.8). For the inner part of the disk, the temperature has the same gradient as for a standard disk only, although the actual scaling depends on the different normalisation of the model. Since the halo has a constant density, there is now a larger quantity of dust at lower temperature. However, for the chosen geometrical and optical parameters, the mass of the halo, has only 1/4 of the mass of the dust in the disk, and the latter dominate the behaviour of the scalelength ratio, that is similar to a standard model.

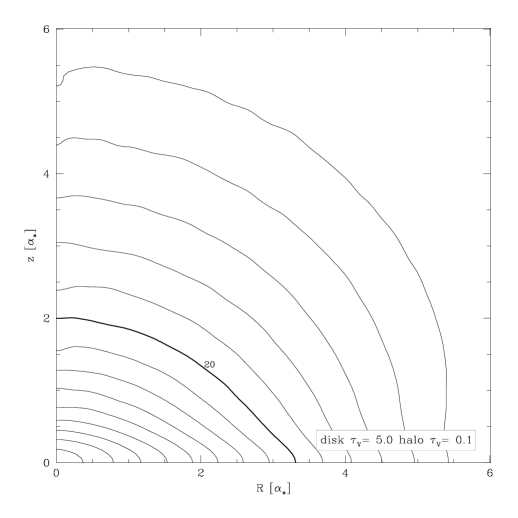
A possible solution would be to use a more massive dust halo, responsible for a larger part of the dust extinction and emission and a more transparent disk. An increase in the FIR scalelengths would thus correspond to only a marginal increase in the optical scalelength, and the ratio would be closer to that observed. For a model where both halo and disk have the same optical depth , the mass of dust in the halo would be 12 times larger than for the disk. The SED for such a model is also displayed in Fig. 4.16, while the temperature distribution has a quite similar pattern as for the previous model and is not shown. It is interesting to note that, despite the total FIR output of the model with halo is nearly the same as for a standard model with (also plotted for reference in Fig. 4.16), the surface brightness is about 1/2. This is because the FIR scalelength are larger than for the standard model, and a larger part of the FIR radiation is emitted outside the half-light radius. Indeed, within this model the scalelength ratios are remarkably close to those observed, being 0.9 for B/200 and 0.6 for 100/200.
Would such a halo be observed in edge-on galaxies? Alton et al. (1998c) used resolution enhanced HiRes IRAS maps to study the FIR emission in 24 edge-on galaxies, including starburst and quiescent objects. None of the object was found to be resolved along the minor axis. HiRes images at 100m have a resolution of and a typical 3 level of 0.75 MJy sterad-1. When the disk+halo model with is observed at 90∘, almost all of the emission, extending up to 5 IRAS resolution elements from the centre, is at a flux larger then the 3 level.
Therefore a dust halo model that could explain the scalelength ratio and marginally the FIR emission would be easily resolved in IRAS images. It is not observed.
4.12 Summary
The radiative transfer and dust emission model described in Chapter 3 has been applied to the spiral galaxy NGC 6946. The stellar SED for the galaxy has been derived from literature data, requiring the UV, Optical and NIR radiation, after being processed through dust, to be the same as observed, for any dust distribution. Various aspects of the dust FIR emission have been simulated, i.e. temperature distributions, FIR spectra and images at specific wavelengths. I have explored several optical and geometrical parameters for the dust distribution, to reproduce the observational results in the FIR.
It was relatively easy to find a model with a FIR spectrum able to match the observations. While the temperature distribution (and therefore the peak of spectral emission) does not vary substantially for any dust disk parameters and optical depth, an optically thick dust distribution is required to reproduce the emitted energy (, the exact value depending on the geometrical details of the dust distribution). Using a dust scalelength , as suggested by models of surface brightness in edge-on galaxies and other FIR simulations, it is not possible to produce optically thick models that simulate the observed spatial distribution of optical and FIR light. Under this assumption, only optically thin models have the observed ratio between optical and FIR scalelengths, but they do not have the required energy output.
To produce a good fit, both to the FIR energy output and to the B/200 scalelenths ratio, with an optically thick model (), it is necessary to extend further the dust scalelength to . The dust distribution would be similar to that of the HI, althougth the atomic gas column densities suggest a lower optical depth. A model with a dust component for each gas phase, however, fails to reproduce the observed properties.
It is possible, in principle, to reproduce scalelength ratios and (although only marginally) the energy output of the galaxy by including a halo of dust to a disk model. However, such an halo would be easily detected in FIR images, which it is not.
A further discussion will be presented in Chapter 5.
Chapter 5 Conclusions
In the last Chapter I have applied the radiative transfer and FIR emission model described in Chapter 3 to the spiral galaxy NGC 6946. Several models for different dust geometries and optical depths were tested against the observations, to explain the fluxes and spatial distribution of the FIR emission. This Chapter presents a resume of the work done for the Thesis. A brief summary of the model characteristics and of the results on NGC 6946 is presented in Sect. 5.1 and 5.2. A discussion of the implication of the findings is given in Sect. 5.3. Finally, a summary of the Thesis can be found in the last Section.
5.1 Outline of the model
The model of this Thesis has been derived from the Monte Carlo radiative transfer code for spiral galaxies of Bianchi, Ferrara & Giovanardi (1996). The main quality of the Monte Carlo technique consists in the exact treatment of multiple scattering in the radiative transfer. The original code included polarisation, a distribution of sizes and materials for the dust grains and optical properties, like albedo and phase functions, derived from the Mie theory for spherical grains. In this work, the code has been simplified, omitting the polarisation calculations and assuming albedo and phase functions derived empirically from observations of reflection nebulae (Sect. 2.2). The code has then been made able to store the amount of energy absorbed from dust, as a function of the distance from the galactic centre and height above the galactic plane (Sect. 3.7).
Once the geometry of the dust distribution relative to the stars and its optical depth in the reference V-band are chosen, the (monochromatic) radiative transfer code is run for 17 different photometric bands, to cover the spectral range of stellar emission. For each band, the output of the code (i.e. optical image and absorbed energy map) is scaled on the observations of the galaxy to be modelled, in such a way that the flux measured inside a specific aperture (I use the half-light radius) in the simulated image matches that really observed. As a result, the SED of the stellar radiation in the model is the same as the observed (for the chosen aperture). Finally, the 17 maps of energy absorbed by dust from starlight in each band are summed together, to produce a map of the total energy absorbed by dust. For each position inside the galaxy I therefore know the amount of energy that is absorbed by dust illuminated by an ISRF that is consistent with the radiative transfer itself, without any other assumption (Sect. 3.8 and 3.9). This is one of the original points in the present code. To my knowledge, only the Monte Carlo radiative transfer code of Wolf et al. (1998) combines this characteristic with a proper treatment of the radiative transfer. However, their model has been implemented only for star formation environments and not for spiral galaxies.
Absorbed radiation can go into heating of small grains, a process not occurring at the thermal equilibrium resulting in MIR emission. Since the models of this Thesis are restricted to the FIR emission from grains emitting at thermal equilibrium, a correction to the absorbed energy maps is applied (Sect. 2.5). Using the dust emissivity derived in Sect. 2.4, the corrected map of absorbed energy is converted into a map of temperature. Hence, a final map of FIR emission can be easily obtained for any wavelength, integrating along a specific line of sight (Sect. 3.9). The FIR scalelengths and SED are derived from the maps, and compared to the observed data. The dust distribution parameters are then modified and the procedure repeated until a match is achieved between simulated and real data.
The model devised for this work is essentially a sophisticated version of the energy balance technique (Sect. 3.2). Not only the amount of energy emitted in the FIR is compared to the stellar radiation to derive the galactic opacity, but also the spatial information is used, to see if the chosen star-dust geometry is consistent with the FIR emission.
5.2 Summary of the results
Several models have been explored in Chapter 4. Most of the models are able to fit the SED inside the half-light radius for NGC 6946, if the dust distribution has a face-on optical depth 5. The amount of energy absorbed by dust depends on the dust geometry. For a standard model with optical depth , 27% of the total stellar radiation is absorbed, with a V-band extinction (Sect. 4.6). A model with the dust distribution more extended radially than the stellar () has an higher extinction , and 36% of the intrinsic starlight is absorbed (Sect. 4.8).
However, the models of this Thesis were also required to describe the observed spatial distribution of the FIR emission. In a sample of seven galaxies, including NGC 6946, Alton et al. (1998a) find that the 200m radial scalelength is larger than the B-band one, by a mean factor of 1.3 for the whole sample. For NGC 6946 the scalelength ratio 200/B is (Sect. 4.4). As already foreseen (Alton et al. 1998a, Davies et al. 1999b), the standard model is not able to provide a FIR scalelength larger than the optical. Alton et al. (1998a) and Davies et al. (1999b) proposed an extended dust distribution. Extended dust models derived from the surface-brightness of edge-on galaxies (; Xilouris et al. 1999) were tryed. But even with such extended dust distributions the scalelength ratio is different from the observed, if the dust disk is optically thick (Sect. 4.8). An increase in the dust radial scalelength indeed increase the FIR scalelengths with respect to the standard model. The FIR scalelengths increase also with the optical depth, although by a minor amount. Unfortunately, the optical scalelengths increases as well with . Therefore, for the optically thick case required by the match with the observed SED, the increase in the 200m scalelength is compensated by the increase in the B-band one, and the ratio 200/B is always smaller than the observed. Only for optically thin cases, the scalelengths ratio approaches unity (Sect. 4.8). When the dust scalelength is extended further, to the values observed for the atomic gas, a fit to the 200/B ratio can be provided, in the optically thick case necessary to the match the energy output. The model, with and 3, have an extinction , with 37% of the intrinsic stellar radiation re-processed by dust.
The temperature distributions are quite similar, for any of the dust disk models. Temperature values in the models are compatible with those observed in the Galaxy and in NGC 6946 as well (Sect. 4.10.2). Alton et al. (1998a) also measured the ratio between scalelenghts at 100 and 200m. For NGC 6946 the scalelengths ratio 100/200 is (Sect. 4.4). The 100/200 scalelengths ratio for the disk models of Chapter 4 varies less than the 200/B ratio, being always in the range 0.7-0.9, for any model, with the lower value for extended dust distributions. Extended distributions of dust could in principle decrease the ratio to the observed values, if large amounts of cold dust emitting at 200m but not at 100m are present in the external part of the galaxy. This does not happen in the disk models explored here, and the emission at 100m and 200m is essentially due to dust at the same temperature (Sect. 4.10.1).
An optically thick disk with a homogeneous spherical halo of optical depth could fit the data, emitting enough FIR radiation to match the observed SED and having both 200/B and 100/200 scalelengths ratio similar to the observed (Sect. 4.11). However, such a halo would be easily detected in FIR observations of edge-on galaxies, even with the poor resolution of instruments like IRAS and ISO. It is not.
5.3 Discussion
As already said, an optically thick disk with is necessary to explain the SED observed in the FIR for NGC 6946. Evans (1992) and Trewhella (1998b) apply the energy balance method to the stellar and dust emission of NGC 6946, using a TRIPLEX model with dust scaleheight half of the stellar. This is the same as using a standard model (Sect. 4.6) and limiting the match to the observations to the SED only. They both derived high optical depths for the disk, using the data inside the half light radius. Evans (1992) measured , while Trewhella (1998b) . A high optical depth is also suggested by the high-resolution sub-mm images from SCUBA described in Sect. 4.3: the diffuse inter-arm emission in the NE spiral arms at a distance of 2’ () is compatible with .
The high optical depth of NGC 6946 contrasts with the recent determination of optical depth of Xilouris et al. (1999), based on fits of the surface brightness of edge-on galaxies using a suitable radiative transfer model for spiral galaxies. For a sample of seven edge-on spirals they find optically thin dust disks, with a mean central face-on optical depth =0.5. The higher opacity of NGC 6946 may be a result of the galaxy being very gas-rich (Alton et al. 1999b); Or it may be due to the clumping of the ISM, affecting in a different way FIR and optical determination of the optical depth. While FIR observations would detect all of the dust (at least when the temperature of the clump and inter-clump medium are similar), optical observations may be affected preferentially by the extinction of the smoother, lower density (and optical depth) inter-clump medium.
Only two models available in literature include clumping in a proper radiative transfer for spiral galaxies. Kuchinski et al. (1998) use preliminary results from a Monte Carlo model to derive opacities of edge-on galaxies from their colour gradients along the minor axis. After dividing the space occupied by dust in a three-dimensional grid, some cell are assigned randomly a clumping status, assuming a constant filling factor for the high density cells all over the galaxy, and adopting a ratio of 100 between densities in clumps and in the nearby smooth medium (thus following the formalism developed by Witt & Gordon (1996) for clumping in an homogeneous sphere illuminated by a central point source). Although a few aspects of the inclusion of clumping are presented in the work, the authors defer a detailed discussion to a forthcoming paper.
The other model is that of Bianchi et al. (1999b), based, as the work of this Thesis, on a simplified version of the Monte Carlo radiative transfer code of Bianchi et al. (1996) for spirals (Sect. 3.7). Simulations are conducted in the V-band, for a stellar disk similar to the one adopted here. Dust is described with two components: a smooth one, associated with the neutral gas, with a double exponential distribution and parameters as for a standard model; a clumpy one, associated with molecular clouds. A few values of the fraction of gas (dust) mass distributed in clumps are explored. A three-dimensional grid covering the whole dust volume is first filled with the homogeneous dust distribution, then clumpy cells are randomly selected according to the radial and vertical distribution of molecular gas in the Galaxy. Cell dimensions and the mass of each clump are chosen to match those observed for Giant Molecular Clouds. As a result of the choice of the parameters, the cubic cells have a fixed optical thickness through each side. As already found for clumpy models in simpler geometries, the main effect of clumping consists of reducing the amount of energy absorbed by dust, with respect to a homogeneous model of the same dust mass. The increase in the fraction of energy that can escape the galaxy is moderate, resulting in surface brightness profiles that are less than one magnitude brighter than those for homogeneous models. Minor and major axis profiles of the simulated disks reveal that clumping effects are higher in the edge-on case. This contrasts with the claims of Kuchinski et al. (1998) for edge-on profiles not being modified by the clumpy structure. It is shown how the difference in the models behaviour results from the different parametrisation adopted for the dust distribution. This is unfortunate, however, as it indicates a strong dependence of the observed brightness profiles on the detailed internal and spatial distribution properties of clumps which makes the interpretation of the data very difficult.
Since the Giant Molecular Clouds simulated by each cell host star-forming regions, it is logical to assume that part of the galactic stellar radiation comes from within the clouds. Bianchi et al. (1999b) study this possibility allowing a fraction of the stellar radiation to be emitted from inside the clumpy cells. When embedded stellar emission is considered, extinction increases with respect to the case with only dust distributed in clumps. Extinction in a model including clumping also for stellar radiation can be even higher than that for a homogeneous case with the same dust mass.
It is instructive to compute the gas-to-dust mass ratio for the models of this Thesis. NGC 6946 has a total gas mass of M⊙ (Devereux & Young 1990a, rescaled to the distance of 5.5 Mpc used in this Thesis). The dust mass of an homogeneous disk can be easily computed from the radial scalelength and the V-band face-on optical depth using the formula given by Bianchi et al. (1999b). Optically thick models with have gas-to-dust mass ratios of the same order of the Local Galactic value (Sodroski et al. 1994) of 160 (the =5 standard model has 360, while the =5 model 160). The optically thin model with the same scalelengths, necessary to explain the optical-FIR scalelengths ratio, contains less dust, with a gas-to-dust ratio higher than the local of an order of magnitude, 1600 (=0.5 ). On the other hand, the only model able to provide a simultaneous fit to the SED and the scalelength ratio, that with and 3, has a smaller gas-to-dust ratio of about 70. This may suggest that, despite the better fit, the dust quantity is overestimated. Therefore, if the Galactic gas-to-dust mass ratio is to be considered a common value for spirals, optically thick models with not only are necessary to provide a good fit to the FIR SED, but they also have the right amount of dust.
A model with two disk distributions was tested in Sect. 4.9. The model included a standard, optically thick distribution of dust, derived from the radial profile of the H2 column density, and an extended () optically thin disk associated to the atomic component. Adopting for the standard disk and for the extended distribution, a good fit was provided for the FIR SED. It was hoped that such a model would have provided a good fit to the scalelength ratio as well, because of the extended distribution. However, the dust emission is dominated by the dust associated with the molecular disk, the amount of colder dust at larger radii being insufficient to modify the scalelengths. Both the standard and extended distribution have a similar dust mass for the parameters listed before, leading to a gas-to-dust ratio of 180.
What would happen if the dust associated with the H2 gas component were to be distributed in clumps? Predictions are not easy. Bianchi et al. (1999b) results cannot be easily used in this case, because they have been derived for a different configuration, with the H2 and its associated dust being distributed in a ring like structure and not in an centrally peaked distribution, like in NGC 6946 (Tacconi & Young 1986). Furthermore, the disk of diffuse dust in Bianchi et al. (1999b) is a standard one, while the dust associated with HI in the double disk model has a radial scalelength three times the stellar. One may hypothesise the following scenario: the diffuse extended dust is responsible for the behaviour of the scalelength, and for the optically thin face-on derived from edge-on profiles, as measured by Xilouris et al. (1999). The clumpy dust associated with H2 may be responsible for the bulk of the FIR emission, if stellar sources are present within the clouds. This scenario favours the hypothesis of a substantial contribution of localised sources to the dust heating, rather than a diffuse ISRF. Would this scenario be valid? For the models of Bianchi et al. (1999b) it is difficult to make a dust disk appear optically thin, if the dust mass is high, since clumping does not modify a great deal the shape of the profiles. In the conclusion they show that a clumpy model with optical depth unity may look the same as an homogeneous distribution with =0.5, when seen edge-on. For the models here discussed, a dust mass corresponding to a distribution with 5, would have to look as if it has =0.5. This is not possible for the models of Bianchi et al. (1999b), although the hypothesis cannot be in principle disregarded for NGC 6946, because of its different distributions of atomic and molecular gas. I have then based the predictions of the FIR emission on the assumptions that the behaviour of the diffuse dust disk is unchanged when high density clumps are interspersed. A simple test in Sect. 4.10.3 showed that it is unlikely that, under these assumptions, the dust optical depth is overestimated when carrying out the energy balance. However, the temperature distribution, the shape of the SED and the spatial distribution of emission are likely to change in a way difficult to predict. Clumps with embedded stellar emission would act as hot spots in the dust distribution. The way this would influence the FIR emission depends on the clumps distribution. If clumps are more concentrated towards the centre of the galaxy, the FIR emission at shorter wavelength may be steeper. This could explain why the observed 100/200 scalelength ratio is smaller than any value derived from the models (Sect. 4.10.1).
Two recent models include clumping of dust and embedded stellar emission to describe the radiative transfer and FIR emission of NGC 6946 (Silva et al. 1998, Sauty et al. 1998). However, it is not easy to use these works to address the problems raised in the last paragraph. The large number of parameters involved in the modelling prevents an isolation of the effect of the dust distribution on the FIR heating. Furthermore, the complexity of the models forces the authors to sacrifice a correct treatment of the scattering (Silva et al. 1998) or a complete description of the ISRF in the whole wavelength range of stellar radiation (Sauty et al. 1998).
The energy balance is used by Silva et al. (1998) to calibrate the results of a complex photometric evolution model for galaxies. The galactic disk is described by three exponential distributions: a distribution of spherical molecular clouds with embedded stars, a distribution of stars that have escaped molecular clouds, and a distribution of diffuse dust and atomic gas. The stellar SED is derived from a spectral synthesis and galactic evolution model. For each evolution stage, the residual gas mass is used to find the dust mass of the galaxy. The radiative transfer for the diffuse medium is carried out in an approximate way, rigorous only for an infinite homogeneous medium and isotropic scattering. A specific radiative transfer model is adopted for the molecular clouds. The dust emission is predicted from the computed ISRF. The several parameters of the model are chosen to fit the stellar and dust SED. The code does not produce maps but only total integrated values for the luminosity.
Among the other objects, they apply the model to NGC 6946. Assuming that radial and vertical scalelengths are the same in each component, they derive a total extinction in the B-band (as derivable from their “average” optical thickness), with 60% of dust residing in molecular clumps and the rest in diffuse ISM. For an homogeneous medium with the same scalelengths, their B-band extinction would correspond to a face-on optical depth . Since part of the emission occur inside regions of higher opacity (the molecular clouds), the diffuse medium in the Silva et al. model may have . A comparison with the results of the Bianchi et al. (1996) code, as presented in the database of Ferrara et al. (1999), shows how the extinction is likely to be overestimated by the Silva et al. approximate treatment of radiative transfer of a 10-15% in the B and V band, for inclinations close to face-on (G. L. Granato, private communication). The choice of dust vertical scalelengths equal to the stellar increase the extinction too, with respect to the standard model with the same dust mass. However, it is unlikely for their geometry and radiative transfer model to underestimate substantially the extinction in the galaxy. Therefore, their model is consistent with an optically thin () diffuse dust component. They also claim that young stars soon escapes from their parent clouds, thus contributing considerably to the FIR radiation from diffuse dust in spiral galaxies. Thus the star-formation rate could be derived from FIR radiation.
A complex model for the radiative transfer within NGC 6946 is also presented by Sauty et al. (1998). They describe the ISM as a two phase medium, constituted by molecular clouds and a diffuse constant density distribution associated with the atomic gas. The molecular clouds have a distribution in space and in size derived from models of the gravitational potential of the galaxy and of cloud formation. OB association are created inside the molecular gas. The dust is scaled on the gas, using a constant dust-to-gas mass ratio. The radiative transfer is carried out with a Monte Carlo method, but only for wavelengths smaller then 2000m, to avoid the contribution of stars not included in their simulations. The ISRF is estimated on each cell of a three-dimensional grid. For cells not reached by UV radiation, like in the interarm regions, the ISRF at Å is used, derived from a R-band map of the galaxy, scaled on the Galactic local ISRF. The UV flux is scaled on the observed. Dust emission is computed and maps can be produced. A fit is achieved for the integrated emission in the four IRAS bands and at 200m (KAO observation).
It is difficult to compare their results to the present work, because they use a different dust distribution from the exponentials, both for the atomic and molecular gas. They derive a total extinction at 2000Å =0.76. As a comparison, a standard model in the UV4 band (1900Å2090Å; Sect. 3.8) has , while for the model =0.28. The work also support the hypothesis of dust heated preferentially by young stars, the UV radiation contributing to 72% of the total FIR. However, the greater care in the treatment of the UV radiation at Å dictated by the desire to model the UV excited H and C+ lines, rather than for the Optical and NIR ISRF, may have biased their results towards the shorter wavelengths. Unfortunately, no radial profiles are presented for wavelengths m. It is therefore impossible to test the model output with the observation suggesting an extended dust distribution.
A proper analysis of the effects of clumping on the FIR emission needs, however, a model focussed mainly on dust extinction and heating mechanisms. A correct treatment of the radiative transfer in the whole spectral range of stellar emission is necessary. Such a model would help not only to ascertain if the observed optical/FIR scalelength ratio can be produced by model with the required FIR energy output, but will also answer the debated question of which is the main contributor to the dust heating (Sect. 1.5). If indeed UV radiation from young objects is the main contributor to the dust heating, recent star formation rates can be derived from the FIR emission, for a large number of galactic objects. Unfortunately, results from a models including clumping are highly dependent on the description chosen for the clumps distribution (Bianchi et al. 1999b). The advent of high-resolution FIR and sub-mm instrument, will surely help to provide a better description of the dust distribution. Current instrumentation permit such observation only on large nearby objects, like the Galaxy and M31. For those objects, the diffuse ISRF is the main contributor to the heating (Sect. 1.5).
One of the points raised in favour of young stars as the major source of dust heating is the impossibility of the diffuse ISRF to heat dust to temperatures higher than 20K (Devereux & Young 1991). I have shown in this Thesis how temperatures higher than 20K are compatible with models with only smooth distributions of dust and stars, i.e. with ISRF heating only. Temperatures in the galactic centre can reach values K. When the temperature is derived from integrated FIR fluxes, values are smaller, because of the temperature gradient with the galactocentric distance. However, values are always biased towards hotter dust. As an example I can use the extended model with and =5, to compute the temperature from fluxes integrated inside the half light radius. The temperature distribution goes from 30K, in the centre, to 18K, at 1.6, the half light radius (Fig. 4.10). When the integrated 100m and 200m fluxes are used, the derived temperature is 26K, still higher than 20K. Temperatures higher than 20K are therefore compatible with ISRF heating of dust.
The radial gradients of the temperature in the models are compatible with those observed in the Galaxy and in NGC 6946 (Sect. 4.10.2). Values of the temperature at a distance corresponding to the Sun Galactocentric distance are quite close to the values measured from Galactic high-latitude FIR emission (Reach et al. 1995, Schlegel et al. 1998). Using the 60m DIRBE image as a template for the FIR emission from diffuse cirrus clouds in the Galaxy, Lagache et al. (1998) isolate high-latitude regions of sky with excess emission at the longer wavelengths observed by DIRBE. For regions with no FIR excess, they measured a temperature of 17.5K (using ; for the emissivity used in this work, Eqn. 2.33, the temperature would be of K; see Sect 2.4.2). A significant excess is measured in regions covering 3.7% of the sky. Two temperature components are necessary to describe the emission in those regions, a warmer component with T=17.8, analogous to the one measured in the absence of the long wavelength excess, and a colder component with T=15.0. The coldest component measured on the Galaxy has T=13K. Again the temperature of the warm component is similar to those of the models of the Thesis. The colder component is identified with dense molecular clouds. Regions with negative excess are present as well, indicating hotter dust in molecular clouds with embedded massive young stars. However, the temperature variations are quite small, corresponding to local variation of the ISRF of only 30%. This may suggest that the effect of clumping on the ISRF and on the dust heating is not heavy.
In the smooth distribution of the current models, colder temperatures can result from the shielding of stellar radiation along the plane in optically thick models (Sect. 4.6). However this does not produce appreciable differences in the temperature distributions. Colder temperatures can be obtained also for dust at large distance from the galactic centre (). At such distance, in fact, dust is immersed in a reduced (or null, as in the extended models of this Thesis) local ISRF, the heating coming mostly (if not completely) from stars in the inner galaxy (Sect. 4.8). For the standard models and for extended models in regions where dust and stars are mixed, the minimum temperature is T14K. In extended models dust at larger radii is colder. This is shown also by the larger scalelengths of the FIR emission. Another geometrical configuration with dust present in region of scarce or null stellar emission is the one including the halo (Sect. 4.11).
After reviewing the little indirect evidence for the existence of unseen baryonic matter, Gerhard & Silk (1996) consider the possibility that part of the dark matter in spiral galaxies may be in the form of gas. They produce a model for an extended flattened halo of cold gas clouds and defined the parameter range that will permit the halo to be unseen and stable. Two mechanisms are suggested to provide stability to each cloud against collapse and star-formation: the self-gravity of the gas may be reduced by the presence of a minicluster of particles inside the cloud; or dust grains associated with the gas and heated by the galactic and intergalactic radiation field may provide sustain through collisions with the gas. They propose several empirical tests to verify this hypothesis, among which deep FIR and sub-mm observations of dust halo emission. Such a halo of baryonic matter would play a major role in the galaxy star-formation history. Indeed, large amounts of baryonic matter have been recently observed by Valentijn & Van Der Werf (1999), from ISO Short-Wavelength Spectrometer (SWS) observations of H2 rotational line emission along the disk of NGC 891. A cool molecular component is found to dominate the emission at larger radii, outweighting the atomic gas by a factor of . Such gas could account for the dark mass in the galaxy.
Unfortunately, the parameters of a putative halo are poorly constrained. In Sect. 4.11 I tried a few halo configuration, together with a disk distribution of dust, choosing the parameters on the basis of the observed behaviours in optically thin and thick models previously explored. I found a disk+halo model able to provide a SED reasonably close to the observed and the required scalelength ratio. However, the halo would have had a FIR emission easily detectable in the available FIR and sub-mm observations, which it is not. The limited number of models explored obviously does not rule out the presence of a dust halo of lower density. Indeed, an optically thin halo would be currently undetected. However, it will not be able to explain the observed FIR properties, that are dominated by the disk distribution (Sect. 4.11).
In this Thesis I have assumed that the scalelength of the intrinsic stellar distribution does not change as a function of the wavelength, dust extinction being responsible for the shallower profile observed in the optical bands. However, different scalelengths at different may be caused by intrinsic colour variation of the stellar distribution with the distance from the galactic centre. Bluer light at larger distances from the centre may trace a population of stars younger than in the central part of the disk. Peletier et al. (1995) studied the variation of the ratio of B and K-band disk scalelengths with inclination for a sample of 37 Sb-Sc galaxies. Larger scalelength ratios are expected in edge-on galaxies, with respect to face-on objects, if dust is responsible of the observed colour gradient. On the other hand, if the colour gradient is caused by a gradient in the stellar population, the ratio should remain constant, regardless of the galaxy inclination. They find that goes from 1.3 for face-on galaxies to 1.7 for edge-on, while a change in the stellar population, estimated from the observed metallicity gradients, can produce a ratio of 1.17 only. These results suggest that dust extinction is the main contributor to the observed colour gradients. An opposite conclusion is drawn by De Jong (1996a), on a sample of 86 face-on galaxies. Comparing the observed colour gradients in colour-colour plots with those derived from a Monte Carlo radiative transfer model, he concludes that, for reasonable models, the observed ratio between optical and NIR scalelengths is caused by a change in stellar population. This definition does not seem to include models with dust disks more extended that the stellar, that are shown to produce such large gradients as the observed. This may be considered a further hint for the existence of extended dust.
Because of the uncertainty in the intrinsic stellar colour gradient, it is difficult to evaluate its effect in the present modelling. The stellar output is calibrated on the observed SED inside the half-light radius. If the shallower B profile is caused mainly by a change in stellar population, the SED at larger distance may be stronger in the short-wavelength side than the central one. Since extinction is larger for small , a smaller optical depth will be sufficient in the external part to produce the same FIR output. However, the effect is likely to be small, because most of the absorbed radiation comes from the higher extinction regions inside the half-light radius, for which I use the correct stellar SED.
The mean dust properties derived in the Local Galactic environment have then been used for any position in the dust distribution. Dust grain composition and size distributions may vary along the disk. Given the high uncertainties on the properties of the local dust distribution itself, it is not easy to assess the influence of such variation on the model. Davies et al. (1999a) constructed a numerical model to study the expulsion and retention of dust grains in galactic disks, as a result of the radiation pressure, gravitational potential and friction with the gas. They conclude that larger grains (0.1m) are likely to move from the outer galaxy to the centre, for reasonable disk opacities. On the contrary, smaller grains (0.01-0.001m) remain relatively close to their formation sites. A reservoir of large grains would therefore accumulate in the central regions. Smaller grains can be heated to higher temperatures, for the same ISRF (Draine & Lee 1984). An overabundance of smaller grains at larger radii with respect to the centre would result therefore in a shallower temperature gradient and FIR profiles. However, the effect is likely to be small and it is difficult that it can account for the observed large FIR scalelengths.
As already stated, an extended distribution of dust is needed to explain the FIR scalelengths. If this distribution is confirmed, our observations of the universe may be severely affected by dust extinction. (Alton et al. 1999b) assessed the impact of this hypothesis, with a universe populated by galaxies with dust distributed as in a model of NGC 6946. The chosen model is the same as in Sect. 4.9, with a standard optically thick disk derived from the H2 distribution and an extended optically thin disk associated to the atomic gas. The fraction of light emitted at redshift that fails to reach instruments observing in the B-band, as a result of the intervening disks extinction, is then computed. It is found that 30-40% of the light emitted at would fail to reach us. Most of the extinction would be due to the extended optically thin disk, rather than the one associated with the molecular gas. This because the geometric cross section (9 times bigger for the dust disk associated with the atomic gas) is a more critical parameter than the central optical depth. Therefore the result will hold even if the molecular gas is distributed in clumps, thus reducing its extinction. However, note the authors caveat on NGC 6946 being very gas rich. When dust modelled on the gas distributions and gas-to-dust ratio of the two separate phases of NGC 891 is used, only a fraction of 5% of the light will not reach us, for the same redshift of emission as before.
Clearly, the knowledge of the dust distribution in a spiral galaxy is still at its preliminary stages. More work need to be done, both on the observational and theoretical side. From the discussion above, it emerges that the inclusion of clumping in proper radiative transfer and emission model is necessary. This will clarify the impact of ISM and stellar dishomogenities of the FIR emission and solve the debated problem of the source of the dust heating. However, it has been shown that clumpy models depend heavily on the assumptions about the clumps distribution. Future high resolution and sensitivity instrumentation will therefore be essential to define the dust distribution and limit the number of parameters in the model.
For this Thesis, I have tried to fit the FIR emission of one galaxy only, to assess the feasibility of the method and test the model. However, NGC 6946 may have characteristics different from those of a ‘mean’ galaxy. Our group possess a lot of optical and FIR data for several spirals (Trewhella 1998b). Furthermore, new FIR data is becoming available through the ISO mission Data Archive. When this Thesis analysis has been conducted on other spirals, more general conclusions about the dust distribution and its extinction could be drawn.
5.4 Summary of the Thesis
In this Thesis I have devised a model to simulate the FIR emission in spiral galaxies and I have applied it to the observations of NGC 6946. An introduction to the influence of dust in astrophysical observations, a review of the studies of extinction and FIR emission in spiral galaxies, and a list of the observational evidences for extended dust distribution is presented in Chapter 1. The basic dust properties used in the modelling are given in Chapter 2. The model is described in Chapter 3, with details on the adopted stellar and dust geometries and on the implementation of the radiative transfer. Chapter 4 is devoted to a fit of the observed FIR properties of NGC 6946. Conclusions have been drawn in this Chapter.
In the following list I summarize the major works done for this Thesis, together with a few other ancillary projects carried out during my PhD:
-
•
Modification of a Monte Carlo radiative transfer code previously developed by myself and creation of FIR emission model for spiral galaxies (Chapter 3 and 4). The main features of the model are:
-
–
full treatment of multiple scattering in realistic geometries;
-
–
use of empirically derived dust properties;
-
–
derivation of the absorbed energy and temperature from an ISRF consistent with the radiative transfer;
-
–
creation of maps of FIR emission and dust temperature distribution.
-
–
-
•
Application of the model to NGC 6946 (Chapter 4). Main findings are:
-
–
observed temperatures are consistent with ISRF heating;
-
–
optically thick disks are necessary to explain the observed SED of FIR emission;
-
–
optical-FIR scalelengths ratio can be explained by extended disks;
-
–
a model with face-on optical depth and spatial distribution similar to that of the atomic gas provide a good fit to both the observed SED and the optical-FIR scalelengths ratio.
-
–
- •
-
•
SCUBA observations of dust associated with spiral arms and diffuse dust in NGC 6946 (Sect. 4.3)
- •
- •
Appendix A SCUBA imaging of NGC 7331 dust ring
To reduce the size of this file, this section has been omitted. However, its content has been published integrally in
Bianchi S., Alton P. B., Davies J. I., Trewhella M., 1998, MNRAS, 298, L49.
Appendix B Search for dust in the halos of spiral galaxies
To reduce the size of this file, this section has been omitted. The full version of this thesis, including the present appendix, can be found at
http://www.arcetri.astro.it/∼sbianchi/tesi/thesis.ps.gz
References
- Agladze et al. (1996) Agladze N. I., Sievers A. J., Jones S. A., Burlitch J. M., Beckwith S. V. W., 1996, ApJ, 462, 1026
- Alton et al. (1998a) Alton P. B., Trewhella M., Davies J. I., Evans R., Bianchi S., Gear W., Thronson H., Valentijn E., Witt A., 1998a, A&A, 335, 807
- Alton et al. (1998b) Alton P. B., Bianchi S., Rand R. J., Xilouris E. M., Davies J. I., Trewhella M., 1998b, ApJ, 507, L125
- Alton et al. (1998c) Alton P. B., Davies J. I., Trewhella M., 1998c, MNRAS, 296, 773
- Alton et al. (1999a) Alton P. B., Davies J. I., Bianchi S., 1999a, A&A, 343, 51
- Alton et al. (1999b) Alton P. B., Xilouris E. M., Bianchi S., , Davies J. I., Kylafis N., 1999b, A&A, submitted
- Athanassoula et al. (1993) Athanassoula E., Garcia-Gomez C., Bosma A., 1993, A&AS, 102, 229
- Bahcall & Soneira (1980) Bahcall J. N., Soneira R. M., 1980, ApJS, 44, 73
- Bahcall & Soneira (1984) Bahcall J. N., Soneira R. M., 1984, ApJS, 55, 67
- Beckman et al. (1996) Beckman J. E., Peletier R. F., Knapen J. H., Corradi R. L. M., Gentet L. J., 1996, ApJ, 467, 175
- Beichman (1987) Beichman C. A., 1987, ARA&A, 25, 521
- Berlind et al. (1997) Berlind A. A., Quillen A. C., Pogge R. W., Sellgren K., 1997, AJ, 114, 107
- Bertin & Arnouts (1996) Bertin E., Arnouts S., 1996, A&AS, 117, 393
- Bianchi et al. (1996) Bianchi S., Ferrara A., Giovanardi C., 1996, ApJ, 465, 127
- Bianchi et al. (1998) Bianchi S., Alton P. B., Davies J. I., Trewhella M., 1998, MNRAS, 298, L49
- Bianchi et al. (1999a) Bianchi S., Davies J. I., Alton P. B., 1999a, A&A, 344, L1
- Bianchi et al. (1999b) Bianchi S., Ferrara A., Davies J. I., Alton P. B., 1999b, MNRAS, accepted
- Block et al. (1994) Block D. L., Witt A. N., Grosbol P., Stockton A., Moneti A., 1994, A&A, 288, 383
- Bohlin et al. (1978) Bohlin R. C., Savage B. D., Drake J. F., 1978, ApJ, 224, 132
- Bohren & Huffman (1983) Bohren C. F., Huffman D. R., 1983. Absorption and Scattering of Light by Small Particles. Wiley, New York
- Boissé & Thoraval (1996) Boissé P., Thoraval S., 1996. In Block D. L., Greenberg J. M., eds., New Extragalactic Perspectives in the New South Africa. Kluwer, Dordrecht, p. 187
- Boroson (1981) Boroson T., 1981, ApJS, 46, 177
- Bosma (1981) Bosma A., 1981, AJ, 86, 1825
- Boulanger et al. (1996) Boulanger F., Abergel A., Bernard J.-P., Burton W., Désert F.-X., Hartmann D., Lagache G., Puget J.-L., 1996, A&A, 312, 256
- Braine & Hughes (1999) Braine J., Hughes D. H., 1999, A&A, 344, 779
- Bruzual et al. (1988) Bruzual A. G., Magris G., Calvet N., 1988, ApJ, 333, 673
- Buat & Xu (1996) Buat V., Xu C., 1996, A&A, 306, 61
- Burstein et al. (1991) Burstein D., Haynes M. P., Faber M., 1991, Nature, 353, 515
- Buta et al. (1995) Buta R., Corwin, H. G. J., De Vaucouleurs G., De Vaucouleurs A., Longo G., 1995, AJ, 109, 517
- Byun et al. (1994) Byun Y. I., Freeman K. C., Kylafis N. D., 1994, ApJ, 432, 114
- Calzetti (1997) Calzetti D., 1997. In Waller W. H. e. a., ed., The Ultraviolet Universe at Low and High Redshift, vol. 408 of AIP Conference Proceedings. American Institute of Physics, New York, p. 403
- Calzetti et al. (1994) Calzetti D., Kinney A. L., Storchi-Bergmann T., 1994, ApJ, 429, 582
- Casey (1991) Casey S. C., 1991, ApJ, 371, 183
- Cashwell & Everett (1959) Cashwell E. D., Everett C. J., 1959. A Practical Manual on the Monte Carlo Method for Random Walk Problems. Pergamos, New York
- Chini & Kruegel (1993) Chini R., Kruegel E., 1993, A&A, 279, 385
- Chini et al. (1995) Chini R., Kruegel E., Lemke R., Ward-Thompson D., 1995, A&A, 295, 317
- Cimatti et al. (1997) Cimatti A., Bianchi S., Ferrara A., Giovanardi C., 1997, MNRAS, 290, L43
- Clegg et al. (1996) Clegg P. E. et al., 1996, A&A, 315, L38
- Clements et al. (1993) Clements D. L., Andreani P., Chase S. T., 1993, MNRAS, 261, 299
- Corradi et al. (1996) Corradi R. L. M., Beckman J. E., Simonneau E., 1996, MNRAS, 282, 1005
- Cowan et al. (1994) Cowan J. J., Romanishin W., Branch D., 1994, ApJ, 436, L139
- Cox & Mezger (1989) Cox P., Mezger P. G., 1989, A&AR, 1, 49
- Dahlem et al. (1994) Dahlem M., Dettmar R. J., Hummel E., 1994, A&A, 290, 384
- Davies et al. (1993) Davies J. I., Phillips S., Boyce P. J., Disney M. J., 1993, MNRAS, 260, 491
- Davies et al. (1995) Davies J. I., Jones H., Trewhella M., 1995, MNRAS, 273, 699
- Davies et al. (1997) Davies J. I., Trewhella M., Jones H., Lisk C., Madden A., Moss J., 1997, MNRAS, 288, 679
- Davies et al. (1999a) Davies J. I., Alton P. B., Bianchi S., Trewhella M., 1999a, MNRAS, 300, 1006
- Davies et al. (1999b) Davies J. I., Alton P. B., Trewhella M., Evans R., Bianchi S., 1999b, MNRAS, 304, 495
- De Geus et al. (1993) De Geus E. J., Vogel S. N., Digel S. W., Gruendl R. A., 1993, ApJL, 413, L97
- De Grijs & Peletier (1997) De Grijs R., Peletier R., 1997, A&A, 320, L21
- De Grijs & Van Der Kruit (1996) De Grijs R., Van Der Kruit P., 1996, A&AS, 117, 19
- De Grijs et al. (1997) De Grijs R., Peletier R. F., Van Der Kruit P. C., 1997, A&A, 327, 966
- De Jong (1996a) De Jong R., 1996a, A&A, 313, 377
- De Jong (1996b) De Jong R., 1996b, A&AS, 118, 557
- De Jong (1996c) De Jong R., 1996c, A&A, 313, 45
- De Vaucouleurs (1959) De Vaucouleurs G., 1959. Handbuck der Physik, vol. 53. Springer, Berlin, p. 275
- De Vaucouleurs (1979) De Vaucouleurs G., 1979, ApJ, 227, 729
- De Vaucouleurs & Pence (1978) De Vaucouleurs G., Pence W. D., 1978, AJ, 83, 1163
- De Vaucouleurs et al. (1991) De Vaucouleurs G., De Vaucouleurs A., Corwin, Herold G. J., Buta R. J., Paturel G., Fouque P., 1991. Third Reference Catalogue of Bright Galaxies. Cambridge University Press, Berlin
- DeGioia-Eastwood (1992) DeGioia-Eastwood K., 1992, ApJ, 397, 542
- Désert et al. (1990) Désert F. X., Boulanger F., Puget J. L., 1990, A&A, 237, 215
- Devereux (1995) Devereux N. A., 1995. In Davies J. I., Burstein D., eds., The Opacity of Spiral Disks, vol. 469 of NATO ASI Series C. Kluwer Academic Publishers, Dordrecht, p. 269
- Devereux & Young (1990a) Devereux N. A., Young J. S., 1990a, ApJ, 359, 42
- Devereux & Young (1990b) Devereux N. A., Young J. S., 1990b, ApJ, 350, L25
- Devereux & Young (1991) Devereux N. A., Young J. S., 1991, ApJ, 371, 515
- Devereux & Young (1992) Devereux N. A., Young J. S., 1992, AJ, 103, 1536
- Devereux & Young (1993) Devereux N. A., Young J. S., 1993, AJ, 106, 948
- Devereux et al. (1994) Devereux N. A., Price R., Wells L. A., Duric N., 1994, AJ, 108, 1667
- Di Bartolomeo et al. (1995) Di Bartolomeo A., Barbaro G., Perinotto M., 1995, MNRAS, 277, 1279
- Digel et al. (1994) Digel S., De Geus E., Thaddeus P., 1994, ApJ, 422, 92
- Disney et al. (1989) Disney M., Davies J., Phillipps S., 1989, MNRAS, 239, 939
- Draine & Lee (1984) Draine B. T., Lee H. M., 1984, ApJ, 285, 89
- Draper (1998) Draper P. W., 1998. Starlink User Note 139.7
- Draper & Eaton (1996) Draper P. W., Eaton N., 1996. Starlink User Note 109.8
- Driver (1994) Driver S., 1994. PhD thesis, University of Wales Cardiff
- Dumke et al. (1997) Dumke M., Braine J., Krause M., Zylka R., Wielebinski R., Guelin M., 1997, A&A, 325, 124
- Eales et al. (1989) Eales S. A., Wynn-Williams C. G., Duncan W. D., 1989, ApJ, 339, 859
- Eastman et al. (1996) Eastman R. G., Schmidt B. P., Kirshner R., 1996, ApJ, 466, 911
- Engargiola (1991) Engargiola G., 1991, ApJS, 76, 875
- Evans (1992) Evans R., 1992. PhD thesis, University of Wales Cardiff
- Fall & Pei (1993) Fall S. M., Pei Y. C., 1993, ApJ, 402, 479
- Fendt et al. (1998) Fendt C., Beck R., Neininger N., 1998, A&A, 335, 123
- Ferguson et al. (1998a) Ferguson A. M. N., Gallagher J. S., Wyse R. F. G., 1998a, AJ, 116, 673
- Ferguson et al. (1998b) Ferguson A. M. N., Wyse R. F. G., Gallagher J. S., Hunter D. A., 1998b, ApJ, 506, L19
- Ferrara (1998) Ferrara A., 1998, Berlin Springer Verlag Lecture Notes in Physics, 506, 371
- Ferrara et al. (1991) Ferrara A., Ferrini F., Barsella B., Franco J., 1991, ApJ, 381, 137
- Ferrara et al. (1996) Ferrara A., Bianchi S., Dettmar R. J., Giovanardi C., 1996, ApJL, 467, L69
- Ferrara et al. (1999) Ferrara A., Bianchi S., Cimatti A., Giovanardi C., 1999, ApJS, 124, in press
- Fioc & Rocca-Volmerange (1997) Fioc M., Rocca-Volmerange B., 1997, A&A, 326, 950
- Fitzpatrick & Massa (1988) Fitzpatrick E. L., Massa D., 1988, ApJ, 328, 734
- Franco et al. (1991) Franco J., Ferrini F., Barsella B., Ferrara A., 1991, ApJ, 366, 443
- Freeman (1970) Freeman K. C., 1970, ApJ, 160, 811
- Fux & Martinet (1994) Fux R., Martinet L., 1994, A&A, 287, L21
- Garcia-Gomez & Athanassoula (1991) Garcia-Gomez C., Athanassoula E., 1991, A&AS, 89, 159
- Garwood & Jones (1987) Garwood R., Jones T. J., 1987, PASP, 99, 453
- Gerhard & Silk (1996) Gerhard O., Silk J., 1996, ApJ, 472, 34
- Giovanelli et al. (1994) Giovanelli R., Haynes M. P., Salzer J. J., Wegner G., Da Costa L. N., Freudling W., 1994, AJ, 107, 2036
- González et al. (1998) González R. A., Allen R. J., Dirsch B., Ferguson H. C., Calzetti D., Panagia N., 1998, ApJ, 506, 152
- Gordon et al. (1997) Gordon K. D., Calzetti D., Witt A. N., 1997, ApJ, 487, 625
- Guélin et al. (1993) Guélin M., Zylka R., Mezger P. G., Haslam C. G. T., Kreysa E., Lemke R., Sievers A. W., 1993, A&A, 279, L37
- Guelin et al. (1995) Guelin M., Zylka R., Mezger P. G., Haslam C. G. T., Kreysa E., 1995, A&A, 298, L29
- Haas et al. (1998) Haas M., Lemke D., Stickel M., Hippelein H., Kunkel M., Herbstmeier U., Mattila K., 1998, A&A, 338, L33
- Handa et al. (1992) Handa T., Sofue Y., Ikeuchi S., Kawabe R., Ishizuki S., 1992, PASJ, 44, L227
- Haywood et al. (1997a) Haywood M., Robin A., Crézé M., 1997a, A&A, 320, 428
- Haywood et al. (1997b) Haywood M., Robin A., Crézé M., 1997b, A&A, 320, 440
- Henyey & Greenstein (1941) Henyey L. G., Greenstein J. L., 1941, ApJ, 93, 70
- Hildebrand (1983) Hildebrand R. H., 1983, QJRAS, 24, 267
- Holland et al. (1999) Holland W. S. et al., 1999, MNRAS, 303, 659
- Holmberg (1958) Holmberg E., 1958, Medn. Lunds Astr. Obs., Ser. II, 136, 1
- Holmberg (1975) Holmberg E., 1975. In Sandage A., Sandage M., Kristian, J., eds., Stars and Stellar Systems, vol. IX. University of Chicago
- Howk & Savage (1997) Howk J. C., Savage B. D., 1997, AJ, 114, 2463
- Howk & Savage (1999) Howk J. C., Savage B. D., 1999, AJ, 117, 2077
- Hughes et al. (1998a) Hughes D. H. et al., 1998a. In The Birth of Galaxies, Xth Rencontres de Blois. p. in press
- Hughes et al. (1998b) Hughes S. M. G. et al., 1998b, ApJ, 501, 32
- Ishizuki et al. (1990) Ishizuki S., Kawabe R., Ishiguro M., Okumura S. K., Morita K. I., Chikada Y., Kasuga T., Doi M., 1990, ApJ, 355, 436
- James & Casali (1998) James P. A., Casali M. M., 1998, MNRAS, 301, 280
- Jenness & Lightfoot (1999) Jenness T., Lightfoot J. F., 1999. Starlink User Note 216.5
- Jenness et al. (1998) Jenness T., Lightfoot J. F., Holland W. S., 1998. In Phillips T. G., ed., Advanced Technology MMW, Radio, and Terahertz Telescopes, vol. 3357 of Proc. SPIE. pp. 548–558
- Jones et al. (1981) Jones T. J., Ashley M., Hyland A. R., Ruelas-Mayorga A., 1981, MNRAS, 197, 413
- Kennicutt & Kent (1983) Kennicutt, R. C. J., Kent S. M., 1983, AJ, 88, 1094
- Kent et al. (1991) Kent S. M., Dame T. M., Fazio G., 1991, ApJ, 378, 131
- Kessler et al. (1996) Kessler M. F. et al., 1996, A&A, 315, L27
- Krügel et al. (1998) Krügel E., Siebenmorgen R., Zota V., Chini R., 1998, A&A, 331, L9
- Kuchinski et al. (1998) Kuchinski L. E., Terndrup D. M., Gordon K. D., Witt A. N., 1998, AJ, 115, 1438
- Kylafis & Bahcall (1987) Kylafis N. D., Bahcall J. N., 1987, ApJ, 317, 637
- Lagache et al. (1998) Lagache G., Abergel A., Boulanger F., Puget J. L., 1998, A&A, 333, 709
- Lagache et al. (1999) Lagache G., Abergel A., Boulanger F., Désert F. X., Puget J. L., 1999, A&A, 344, 322
- Landolt (1992) Landolt A. U., 1992, AJ, 104, 340
- Lemke et al. (1996) Lemke D. et al., 1996, A&A, 315, L64
- Lequeux (1980) Lequeux J., 1980. In Appenzeller I., Lequeux J., Silk J., eds., Star Formation, Proceedings of 10th Advanced Course of the Swiss Society of Astronomy and Astrophysics. SaasFee, Geneva
- Lequeux & Guelin (1996) Lequeux J., Guelin M., 1996. In Block D. L., Greenberg J. M., eds., New Extragalactic Perspectives in the New South Africa. Kluwer, Dordrecht, p. 422
- Lequeux et al. (1995) Lequeux J., Dantel-Fort M., Fort B., 1995, A&A, 296, L13
- Lequeux et al. (1996) Lequeux J., Fort B., Dantel-Fort M., Cuillandre J. C., Mellier Y., 1996, A&A, 312, L1
- Madau et al. (1996) Madau P., Ferguson H. C., Dickinson M. E., Giavalisco M., Steidel C. C., Fruchter A., 1996, MNRAS, 283, 1388
- Maddox (1989) Maddox S. J., 1989. PhD thesis, Institute of Astronomy & Queens College, Cambridge
- Malhotra (1997) Malhotra S., 1997, ApJ, 488, L101
- Masi et al. (1995) Masi S., Aquilini E., Boscaleri A., De Bernardis P., De Petris M., Gervasi M., Martinis L., Natale V., Palumbo P., Scaramuzzi F., 1995, ApJ, 452, 253
- Metcalfe et al. (1991) Metcalfe N., Shanks T., Fong R., Jones L. R., 1991, MNRAS, 249, 498
- Mezger (1978) Mezger P. O., 1978, A&A, 70, 565
- Mie (1908) Mie G., 1908, Ann. Phys., 25, 377
- Mihalas & Binney (1981) Mihalas D., Binney J., 1981. Galactic astronomy: Structure and kinematics. W. H. Freeman and Co., San Francisco
- Moriondo et al. (1998) Moriondo G., Giovanelli R., Haynes M. P., 1998, A&A, 338, 795
- Neininger et al. (1996) Neininger N., Guelin M., Garcia-Burillo S., Zylka R., Wielebinski R., 1996, A&A, 310, 725
- Nelson et al. (1998) Nelson A. M., Zaritsky D., Cutri R. M., 1998, AJ, 115, 2273
- Neugebauer et al. (1984) Neugebauer G. et al., 1984, ApJ, 278, L1
- Odenwald et al. (1998) Odenwald S., Newmark J., Smoot G., 1998, ApJ, 500, 554
- Ohta & Kodaira (1995) Ohta K., Kodaira K., 1995, PASJ, 47, 17
- Ostriker & Heisler (1984) Ostriker J. P., Heisler J., 1984, ApJ, 278, 1
- Peletier & De Grijs (1997) Peletier R., De Grijs R., 1997. In Mamon G. A., Trinh Xuân Thuân, Trân Than Vân J., eds., Extragalactic Astronomy in the Infrared. p. 1
- Peletier et al. (1994) Peletier R., Valentijn E., Moorwood A., Freudling W., 1994, A&AS, 108, 621
- Peletier et al. (1995) Peletier R., Valentijn E., Moorwood A., Freudling W., Knapen J., Beckman J., 1995, A&A, 300, L1
- Persic et al. (1996) Persic M., Salucci P., Stel F., 1996, MNRAS, 281, 27
- Phillips (1993) Phillips A. C., 1993, AJ, 105, 486
- Pogge (1989) Pogge R. W., 1989, ApJS, 71, 433
- Porcel et al. (1998) Porcel C., Garzón F., Jiménez-Vicente J., Battaner E., 1998, A&A, 330, 136
- Puget et al. (1996) Puget J. L., Abergel A., Bernard J. P., Boulanger F., Burton W. B., Désert F. X., Hartmann D., 1996, A&A, 308, L5
- Rand et al. (1992) Rand R. J., Kulkarni S. R., Rice W., 1992, ApJ, 390, 66
- Reach et al. (1995) Reach W. T. et al., 1995, ApJ, 451, 188
- Regan & Vogel (1995) Regan M. W., Vogel S. N., 1995, ApJL, 452, L21
- Regan et al. (1997) Regan M. W., Vogel S. N., Teuben P. J., 1997, ApJ, 449, 576
- Rice (1993) Rice W., 1993, AJ, 105, 67
- Rice et al. (1988) Rice W., Lonsdale C. J., Soifer B. T., Neugebauer G., Koplan E. L., Lloyd L. A., De Jong T., Habing H. J., 1988, ApJS, 68, 91
- Rieke & Lebofsky (1985) Rieke G. H., Lebofsky M. J., 1985, ApJ, 288, 618
- Rifatto et al. (1995b) Rifatto A., Longo G., Capaccioli M., 1995b, A&AS, 109, 341
- Rifatto et al. (1995a) Rifatto A., Longo G., Capaccioli M., 1995a, A&AS, 114, 527
- Robin et al. (1992a) Robin A. C., Crézé M., Mohan V., 1992a, ApJ, 400, L25
- Robin et al. (1992b) Robin A. C., Crézé M., Mohan V., 1992b, A&A, 265, 32
- Rowan-Robinson (1986) Rowan-Robinson M., 1986, MNRAS, 219, 737
- Rowan-Robinson (1992) Rowan-Robinson M., 1992, MNRAS, 258, 787
- Rudy et al. (1997) Rudy R. J., Woodward C. E., Hodge T., Fairfield S. W., Harker D. E., 1997, Nature, 387, 159
- Ruphy et al. (1996) Ruphy S., Robin A., Epchtein N., Copet E., Bertin E., Fouque P., Guglielmo F., 1996, A&A, 313, L21
- Sackett et al. (1994) Sackett P. D., Morrison H. L., Harding P., Boroson T. A., 1994, Nature, 370, 441
- Sandage & Tammann (1974) Sandage A., Tammann G. A., 1974, ApJ, 194, 559
- Sandell (1997) Sandell G., 1997. Starlink Cookbook 11.1
- Sauty et al. (1998) Sauty S., Gerin M., Casoli F., 1998, A&A, 339, 19
- Schlegel et al. (1998) Schlegel D. J., Finkbeiner D. P., Davis M., 1998, ApJ, 500, 525
- Schoniger & Sofue (1994) Schoniger F., Sofue Y., 1994, A&A, 283, 21
- Sievers et al. (1994) Sievers A. W., Reuter H. P., Haslam C. G. T., Kreysa E., Lemke R., 1994, A&A, 281, 681
- Silva et al. (1998) Silva L., Granato G. L., Bressau A., Danese L., 1998, ApJ, 509, 103
- Smith (1998) Smith B. J., 1998, ApJ, 500, 181
- Smith & Harvey (1996) Smith B. J., Harvey P. M., 1996, ApJ, 468, 139
- Sodroski et al. (1994) Sodroski T. J. et al., 1994, ApJ, 428, 638
- Sodroski et al. (1987) Sodroski T. J., Dwek E., Hauser M. G., Kerr F. J., 1987, ApJ, 322, 101
- Sodroski et al. (1989) Sodroski T. J., Dwek E., Hauser M. G., Kerr F. J., 1989, ApJ, 336, 762
- Sodroski et al. (1997) Sodroski T. J., Odegard N., Arendt R. G., Dwek E., Weiland J. L., Hauser M. G., Kelsall T., 1997, ApJ, 480, 173
- Sofue (1987) Sofue Y., 1987, PASJ, 39, 547
- Sofue et al. (1994) Sofue Y., Wakamatsu K. I., Malin D. F., 1994, AJ, 108, 2102
- Soifer et al. (1987) Soifer B. T., Sanders D. B., Madore B. F., Neugebauer G., Danielson G. E., Elias J. H., Lonsdale C. J., Rice W. L., 1987, ApJ, 320, 238
- Spitzer (1978) Spitzer L., 1978. Physical Processes in the Interstellar Medium. Wiley, New York
- Swaters et al. (1997) Swaters R. A., Sancisi R., van der Hulst J. M., 1997, ApJ, 491, 140
- Tacconi & Young (1986) Tacconi L. J., Young J. S., 1986, ApJ, 308, 600
- Tacconi & Young (1989) Tacconi L. J., Young J. S., 1989, ApJS, 71, 455
- Tacconi & Young (1990) Tacconi L. J., Young J. S., 1990, ApJ, 352, 595
- Telesco et al. (1982) Telesco C. M., Gatley I., Stewart J. M., 1982, ApJ, 263, L13
- Tosaki & Shioya (1997) Tosaki T., Shioya Y., 1997, ApJ, 484, 664
- Trewhella (1998a) Trewhella M., 1998a, MNRAS, 297, 807
- Trewhella (1998b) Trewhella M., 1998b. PhD thesis, University of Wales Cardiff
- Trewhella et al. (1998) Trewhella M., Madore B. F., Kuchinski L. E., 1998, BAAS, 193, 7010
- Trewhella et al. (1999) Trewhella M., Madore B. F., Davies J. I., Alton P. B., Bianchi S., 1999, in preparation
- Tully (1988) Tully R. B., 1988. Nearby galaxies catalog. Cambridge University Press, Cambridge
- Valentijn (1990) Valentijn E. A., 1990, Nature, 346, 153
- Valentijn & Van Der Werf (1999) Valentijn E. A., Van Der Werf P. P., 1999, ApJ, 522, L29
- Van De Hulst (1946) Van De Hulst H. C., 1946, Rech. Astron. Obs. Utrecht, 11, 1
- Van De Hulst (1957) Van De Hulst H. C., 1957. Light Scattering by Small Particles. Wiley, New York
- Van der Kruit (1986) Van der Kruit P. C., 1986, A&A, 157, 230
- Van Der Kruit (1988) Van Der Kruit P. C., 1988, A&A, 192, 117
- Van Der Kruit & Searle (1981) Van Der Kruit P. C., Searle L., 1981, A&A, 95, 105
- Van Der Kruit & Searle (1982) Van Der Kruit P. C., Searle L., 1982, A&A, 110, 61
- Van Driel et al. (1995) Van Driel W. et al., 1995, AJ, 109, 942
- Von Linden et al. (1996) Von Linden S., Reuter H. P., Heidt J., Wielebinski R., Pohl M., 1996, A&A, 315, 52
- Wainscoat et al. (1989) Wainscoat R. J., Freeman K. C., Hyland A. R., 1989, ApJ, 337, 163
- Wainscoat et al. (1992) Wainscoat R. J., Cohen M., Volk K., Walker H. J., Schwartz D. E., 1992, ApJS, 83, 111
- Walterbos & Greenawalt (1996) Walterbos R. A. M., Greenawalt B., 1996, ApJ, 460, 696
- Webster et al. (1995) Webster R. L., Francis P. J., Peterson B. A., Drinkwater M. J., Masci F. J., 1995, Nature, 375, 469
- Whitcomb et al. (1981) Whitcomb S. E., Gatley I., Hildebrand R. H., Keene J., Sellgren K., Werner M. W., 1981, ApJ, 246, 416
- White & Keel (1992) White R. E., Keel W. C., 1992, Nature, 359, 129
- Whittet (1992) Whittet D. C. B., 1992. Dust in the Galactic Environment. Institute of Physics Publishing, Bristol
- Witt (1977) Witt A. N., 1977, ApJS, 35, 1
- Witt & Gordon (1996) Witt A. N., Gordon K. D., 1996, ApJ, 463, 681
- Witt & Gordon (1999) Witt A. N., Gordon K. D., 1999, ApJ, in press
- Witt et al. (1992) Witt A. N., Thronson, Harley A. J., Capuano, John M. J., 1992, ApJ, 393, 611
- Witt et al. (1993) Witt A. N., Petersohn J. K., Holberg J. B., Murthy J., Dring A., Henry R. C., 1993, ApJ, 410, 714
- Wolf et al. (1998) Wolf S., Fischer O., Pfau W., 1998, A&A, 340, 103
- Wood (1997) Wood K., 1997, ApJ, 477, L25
- Wright (1993) Wright E. L., 1993. In Holt S. S., Verter F., eds., Back to the Galaxy. AIP, New York, p. 193
- Wright et al. (1991) Wright E. L. et al., 1991, ApJ, 381, 200
- Xilouris et al. (1997) Xilouris E. M., Kylafis N. D., Papamastorakis J., Paleologou E. V., Haerendel G., 1997, A&A, 325, 135
- Xilouris et al. (1998) Xilouris E. M., Alton P. B., Davies J. I., Kylafis N. D., Papamastorakis J., Trewhella M., 1998, A&A, 331, 894
- Xilouris et al. (1999) Xilouris E. M., Byun Y. I., Kylafis N. D., Paleologou E. V., Papamastorakis J., 1999, A&A, 344, 868
- Xu & Buat (1995) Xu C., Buat V., 1995, A&A, 293, L65
- Xu & Helou (1996a) Xu C., Helou G., 1996a, ApJ, 456, 152
- Xu & Helou (1996b) Xu C., Helou G., 1996b, ApJ, 456, 163
- Xu et al. (1997) Xu C., Buat V., Boselli A., Gavazzi G., 1997, A&A, 324, 32
- Young & Scoville (1982) Young J. S., Scoville N., 1982, ApJ, 260, L41
- Young & Scoville (1991) Young J. S., Scoville N. Z., 1991, ARA&A, 29, 581
- Zaritsky (1994) Zaritsky D., 1994, AJ, 108, 1619
- Zombeck (1990) Zombeck M. V., 1990. Handbook of space astronomy and astrophysics. Cambridge: University Press, Cambridge