Near-Infrared Emission Line Searches for High-Redshift Galaxies
Abstract
In this article I review recent developments in near-infrared emission line searches for star-forming galaxies at high redshift. Using the -, - & -bands we can potentially chart the history of star formation over the range using the prominent rest-optical nebular emission lines alone, filling in the “redshift desert” at where most common emission lines lie outside the optical bands. Studying the rest-frame optical at also allows a fair comparison to be made with the local Universe – the rest-optical lines are vastly more robust to extinction by dust than the rest-UV, with the resonantly-scattered Ly line particularly unreliable. I discuss the recent history of near-infrared emission-line searches using narrow-band imaging and spectroscopy, and look to the future in this era of 10 m telescopes: such work gives us the potential to push to , the next frontier in the Hy-Redshift Universe.
Dept. of Astronomy, University of California, Berkeley
CA 94720
email: bunker@ast.cam.ac.uk
1. Introduction
This conference celebrates some of the research interests of Hyron Spinrad on his 65th birthday. Hy’s career has been synonymous with the discovery of the most distant galaxies, and in recent years this field has undergone a renaissance. Galaxies at 90% of the look-back time are now being successfully hunted with a broad armory of observational techniques. In this article I will review recent developments in near-infrared emission-line searches.
The observational study of galaxy evolution aims to follow the star formation, gas consumption, metal enrichment and merging rates of the components which have combined to form today’s galaxies. In the last four years, our knowledge of high redshift ‘normal’ (non-AGN) galaxies has blossomed. The photometric selection technique of Steidel, Pettini & Hamilton (1995), using the intrinsic Lyman limit continuum break at nm and the blanketing effect of intervening Lyman- absorbers below nm, has proven a robust way to select star-forming galaxies through broad-band optical imaging at (the ‘-drops’, Steidel et al. 1996a,b) and now at (the ‘-drops’, Steidel et al. 1999 and Chuck Steidel’s contribution to this conference proceedings). In addition, after many years of largely fruitless searches for Ly 121.6 nm (e.g., Pritchet & Hartwick 1990; de Propris et al. 1993; Thompson, Djorgovski & Trauger 1995), a number of field galaxies have now been identified at through this emission line (e.g., Dey et al. 1998; Hu, Cowie & McMahon 1998; Chen et al. 1999; Steidel et al. 2000 – see also the articles by Ken Lanzetta, George Djorgovski, Esther Hu and Hy Spinrad in this volume).
Observations in the optical are now, at last, revealing large numbers of high-redshift galaxies. Why, then, should we be interested in searches in the near-infrared at all when the optical is so ‘easy’ by comparison (in terms of the low sky background and the mature detector technology)? The motivation of moving to the near-infrared is three-fold:
-
•
to fill in the redshift desert at , where most common emission lines lie outside the optical;
-
•
to study the rest-frame optical at in order to make a fair comparison with local Universe – the rest-optical lines are vastly more robust to extinction by dust than the rest-UV, with Ly particularly unreliable;
-
•
the near-IR gives us the potential to push to the highest redshifts yet ().
In this article, I will concentrate on near-infrared search techniques for actively star-forming galaxies. In their contributions to this proceedings, Adam Stanford, Peter Eisenhardt and Jim Dunlop discuss infrared methods of finding and studying high-redshift galaxies with evolved stellar populations, both in clusters and in the field. Andrew Blain and Len Cowie describe far-infrared/sub-mm surveys. Throughout I will consider a cosmology with a vanishing cosmological constant (), and unless otherwise stated.
2. Line Emission as an Indicator of Star Formation
Most high- emission line searches for field galaxies have focused on Ly, and until the recent advent of 10-m telescopes have been uniformly unsuccessful. With the benefit of hindsight, it appears the large path-length for the resonant Ly line in typical neutral hydrogen columns of greatly enhances the absorption cross section with only modest dust (e.g., Chen & Neufeld 1994), depending sensitively on the geometry and kinematics of the gas. This selective quenching of Ly is observed in low- star-bursts (e.g., Kunth et al. 1998), and at high redshift Ly emission is typically weak in the Lyman-limit selected galaxies of Steidel et al. (1996ab,1999) – indeed this line is actually seen in absorption in half their sample. Put simply, the substantial effort in Ly searches has yielded mainly upper limits of essentially no interest for constraining the underlying star-formation rates, as the extinction of this line is extremely difficult to quantify.


Right: The predicted (unobscured) line fluxes as a function of redshift for several emission lines indicative of star formation. The thick lines indicate the range of redshifts at which these appear in the -window of the near-infrared. The Kennicutt (1983) relation between H luminosity and star formation rate is adopted, and [O II] is assumed to have a comparable intensity to H (Kennicutt 1992), and [O III] in the most actively star-forming systems rivals H (e.g., Mannucci & Beckwith 1995), although the scatter is large. The left-hand axis shows the line fluxes for a star formation rate of , which may be typical of an -galaxy progenitor, and the right-hand axis is for (from Bunker 1996).
A natural progression is to look for lines of longer rest-frame wavelength, less affected by extinction than the rest-UV and immune to the effects of resonant scattering. The Balmer hydrogen recombination emission lines, H 656.3 nm & H 486.1 nm, and the collisionally de-excited forbidden lines of oxygen, [O III] 495.9,500.7 nm & [O II] 372.6,372.9 nm, are fairly good indicators of the intrinsic rest-UV continuum from the hottest, most massive and shortest-lived stars (, Myr, K), and hence the near-instantaneous star formation rate (SFR). The most fruitful indicator of star formation at modest redshifts has been the [O II] line. However, there is a ‘dead-zone’ between (beyond which [O II] leaves the optical) and (below which Lyman-break photometric selection is ineffective). Yet some theories currently in vogue predict this to be the crucial epoch of maximal merger activity and star formation. Using the atmospheric transmission windows in the near-infrared – the (m), (m) and (m) pass-bands – gives access to the full redshift range through the four prominent rest-frame optical nebular emission lines (H, [O III], H & [O II] – see Fig. 1). The conversion of the nebular line luminosities to star formation rates is also better understood than that for the sub-mm continuum, which is an indirect measure of UV flux reprocessed as thermal grain emission in the far-infrared and depends on a number of factors including the temperature of the dust, changing by as much as a factor of four over the range K (Barger et al. 1999).
3. Search Strategies for Emission Lines
A search for line emission objects is typically complete to a given line flux and/or equivalent width limit, in contrast to a survey based on broad-band imaging, which is complete to a given broad-band magnitude. The goal of such emission line searches is to trace star formation over a range of redshifts. While faint magnitude-limited redshift surveys can address this to some extent, the issue is muddied: selecting on broad-band magnitudes is not the same as selecting on star formation activity. The rest-frame optical colours only provide very limited information on the star formation history. Even the rest-frame UV suffers badly and unpredictably from dust extinction, and below 121.6 nm it is gradually eroded by intervening absorbers. There may also exist a population of star-forming galaxies with very large equivalent width emission lines which would be missing from magnitude-limited surveys on account of their faint continua, despite high star formation rates (e.g., Curt Manning’s poster paper in this volume). The great advantage of emission line searches over broad-band magnitude-limited surveys is that they cleanly pick out star forming galaxies at a single redshift, rather than having to disentangle galaxies at all redshifts down to very different absolute magnitude limits. The SFR is also measured directly from the nebular emission lines, with smaller dust corrections than any optical/IR method.
When constructing a survey for high-redshift star-forming galaxies, there are six main considerations which must be balanced (e.g., Koo 1986; Djorgovski 1992; Pritchet 1994):
-
•
Redshift Coverage: Does the survey range cover redshifts where star formation activity is thought to be high? Is the spread in look-back time adequate to test various models?
-
•
Solid Angle: Is sufficient area on the sky covered to intercept several galaxies?
-
•
Clustering: What density enhancement above the average for the field can be expected by targeting the search on known objects at high-?
-
•
Discrimination Against Foreground Objects: How effectively can the high-redshift sheep be separated from low-redshift goats? Is there any foreground contaminant population?
-
•
Sensitivity: Can faint enough line fluxes be attained to reach cosmologically interesting star formation rates?
-
•
The Scientific Goals: How cleanly is the star-forming population at a particular redshift isolated?
Unlike broad-band imaging and spectroscopy, narrow-band work samples a very small wavelength range (and so a small dispersion in redshifts). This has the advantage of reducing the background noise by cutting the spectral extent of sky the detector is exposed to, but has the major drawback that little depth in redshift space is probed (although targetted searches for clusters may offset this disadvantage: Mauro Giavalisco and Ray Carlberg discuss the evolution of clustering properties at high- in their articles in this proceedings). Untargetted (“blank-sky”) long-slit spectroscopy can cover a larger redshift range, but over a very restricted solid angle. Although covering a large volume, and despite recent advances in photometric redshift estimation from multi-waveband colours, broad-band imaging does not offer precise redshift information. It is also relatively insensitive to line emission due to the high background – as is also the case with ground-based slitless spectroscopy (but see § 5.1.).
One of the advantages of high- searches for H in particular is the lack of lower-redshift interlopers to mimic this line emission: should an object with a single emission line be detected in a -band search, the most conservative interpretation would be H at ; as there are no comparably-strong emission lines at rest-wavelengths longward of 656.3 nm, it is unlikely that the redshift is actually less than two (and with plausible higher-redshift degeneracies of H or [O III] 500.7 nm at or [O II] 372.7 nm at ). This is in stark contrast to searches for Ly, where there is frequent confusion between the high-redshift (Ly-line) interpretation, with a continuum break at the line attributed to the H I forest absorption, and a low-redshift galaxy with [O II] 372.7 nm emission accompanied by the 4000 Å + Balmer continuum break. Neither Ly nor [O II] have strong nearby lines with which to differentiate the two interpretations through low-dispersion spectroscopy (see Stern et al. 2000 for a detailed discussion).
4. Near-Infrared Narrow-Band Imaging
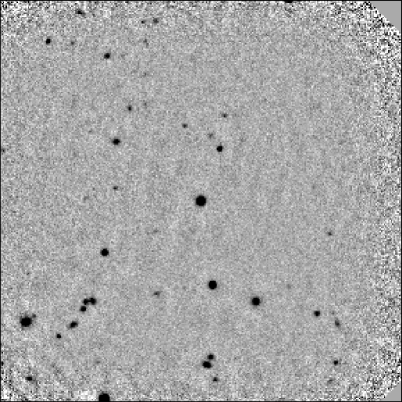
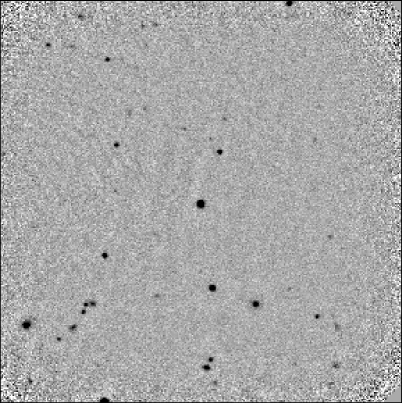
Infrared searches using narrow-band filters (typically “1% filters” with a velocity width of ) have become popular in the last seven years. The technique is to search for objects which have excess flux in the narrow-band filter when compared to an off-band, which could be attributable to an emission line being redshifted into the bandpass (see Figs. 2 & 3). In practice, a broad-band filter is commonly used as the ‘off-band’, as the sensitivity to the continuum is much greater than with simply using an adjacent narrow-band filter (Pat Hall’s paper in this volume describes a QSO companion detected by this technique).
4.1. Pilot Studies on 4 m-Class Telescopes
One of the first surveys was undertaken on the 3.8-m UK Infrared Telescope (UKIRT) by Parkes, Collins & Joseph (1994). This involved -band imaging with IRCAM-1 (a pixel InSb array), intended to search for Ly at very high redshift () but also potentially sensitive to H at (Collins, Parkes & Joseph 1996). However, there were no confirmed line-emission candidates within the area surveyed to a limiting flux111Throughout, I convert the limits quoted for various surveys to a threshold in a 3′′-diameter aperture. of . Reaching a comparable flux limit in the -band, Thompson, Djorgovski & Beckwith (1994) surveyed with a similar array on the Palomar 5-m. This search was targetted on [OII] 372.7 nm from objects clustered around three QSOs, but did not detect any line-emission companion galaxies.


Right: The H (top-right panel) and [O III] 500.7 nm emission (top-left panel) from C1 (UKIRT/CGS 4 spectroscopy from Bunker et al. 1999). The dot-dash lines are the noise per pixel, and the lower panels show the fractional atmospheric transmission (dotted line) and the sky spectrum scaled down by a factor of 1000 (short-dash line).
These pilot studies demonstrated that potentially significant cosmological volumes and star formation rates could be probed at high- through near-infrared narrow-band imaging. However, it was also clear that deeper surveys covering larger areas were required to unveil any population of star-forming galaxies.
What should be the minimum survey volume to stand a realistic chance of intercepting several field galaxies at high-? At a redshift of , where H appears in the middle of the -window, a narrow-band survey with a filter of width and a detector of area will cover a co-moving volume of:
Locally, the density of field galaxies is (Loveday et al. 1992)222This is the same number density as for the Lyman break galaxies of Steidel et al.(1996ab,1999), although this is probably coincidence: there is unlikely to be a one-to-one correspondence between today’s galaxies and their presumed Lyman break progenitors, as merging will play a major rôle.. In the idealized case of no evolution in the co-moving number density, there should be on average one galaxy brighter than in a volume of . In order to have a 95% chance of intercepting at least one such galaxy, a volume three times as large should be surveyed (i.e., Mpc3). This corresponds to 20 arcmin2 with a 1% filter for . The number of field galaxies brighter than and per square arcminute are plotted in Fig. 1 as a function of redshift. Any clustering or inclusion of volumes surveyed through higher-redshift (shorter rest-wavelength) lines serve only to increase the predicted numbers.
What star formation rates/line fluxes should we expect? Deep redshift surveys (e.g., Lilly et al. 1996) suggest that galaxies have been mostly assembled by , with evolution since then mainly associated with lower-mass systems (the ‘down-sizing’ of Cowie et al. 1996). We concern ourselves here with the quest for the high-redshift progenitors of the present-day galaxies, in the process of forming a large fraction of their stars: these used to be loosely referred to as ‘primæval galaxies’ (or ‘proto-galaxies’) before it was recognised that the star formation history of galaxies was actually a rather extended and non-coeval process.
At the current epoch, most of the luminous baryonic matter in the Universe is contained in galaxies with luminosities around . If and a typical stellar mass-to-light ratio is (Faber & Gallagher 1979) then to manufacture the mass in stars of an galaxy by the current epoch would require an average star formation rate of over Gyr (the Hubble time at for ). This is an unobscured line flux of at (Fig. 1).
This model is, of course, rather simplistic – both and will evolve. If merging is important, then we might expect the high- progenitors of galaxies to be in many pieces. This hierarchical scenario would increase the surface density of galaxies, but reduce the average star formation rate per sub-unit – which would favour depth rather than area as the pivotal survey consideration. However, if star formation at high- is episodic rather than continuous, then only a fraction of the population may be detectable in line emission at any given epoch. This has the effect of reducing the number density of actively star-forming systems, but because the star formation is concentrated in short bursts interspersed with quiescent phases, the star formation during a burst must be much greater than the average value calculated in the simplistic model. If the star formation history of a galaxy is indeed episodic, this would drive the survey considerations in the other direction – towards a larger area/volume, to maximize the chances of intercepting the luminous (but infrequent) star-bursts.
4.2. The First Searches with Near-IR Arrays
The early 1990s saw the emergence of InSb and HgCdTe near-infrared arrays with low readout noise and background-limited performance even with narrow-band filters. With these, several groups undertook surveys which, for the first time, attained the flux limits and/or volumes required to test viable models of galaxy formation. An early 10-m Keck program with NIRC placed strong constraints (Pahre & Djorgovski 1995), reaching over 4 arcmin2, but did not yield emission-line candidates. The first narrow-band imaging detections of line emission from high- objects came soon after. Bunker et al. (1995) imaged in H emission a companion of the damped Ly- (DLA) QSO absorption system towards the quasar PHL 957 (Figs. 2 & 3). Malkan, Teplitz & McLean (1995) also detected H emission from the companion of another QSO absorption system at (using NIRC/Keck) and subsequently found a cluster (Malkan, Teplitz & McLean 1996). In both these cases, the line emission is unlikely to be solely due to star formation: the presence of strong high-ionization lines such as C IV 154.9 nm suggests an AGN contribution.
Figs. 4 & 5 show the constraints on galaxy evolution from the null results of a typical recent narrow-band survey (Bunker 1996). A wider-area search by Thompson, Mannucci & Beckwith (1996) used the Calar Alto 3.5-m to survey around QSOs, finding one line-emission source to – an unusual object with broad H of , once again probably powered by an AGN (Beckwith et al. 1998). However, there seems to be large variance: undertaking a comparably-sized survey around absorption-line systems detected candidates (Mannucci et al. 1998). Using NIRC/Keck to reach fainter limiting fluxes () but over a smaller area (), Teplitz, Malkan & McLean (1998) report 13 further candidates.
Despite surveying , narrow-band searches have not as yet yielded a large population of star forming objects – there are candidates, of which have been spectroscopically confirmed so far. Over a similar area (), -drop Lyman-break selection by Steidel and collaborators has yielded 750 spectroscopically-confirmed galaxies. Why is this? First, only a thin sliver of redshift-space is sampled within a narrow-band, compared with that for broad-band colour selection; second, the infrared searches to date are at the “tip of the iceberg” in terms of the luminosity function if dust extinction is modest – only the most actively star-forming systems and some AGN are being selected from current near-IR surveys. For a typical galaxy in Steidel’s sample ( at Å), the rest-UV would have to be suppressed by a factor of relative to H for it to be detected in at (assuming a typical narrow-band flux limit of ). This corresponds to a fairly extreme obscuration of mag ( mag appears more typical). Given the small number of galaxies detected so far in H searches, there appears not to be a large population of galaxies with moderately-heavy obscuration. However, narrow-band searches going a factor of deeper over a much wider area are required to comprehensively test this; the large-format near-infrared arrays on the new 8-m telescopes make this viable.


Right: the cumulative co-moving volumes sampled (left axis) and limits on the line luminosities (bottom axis, assuming no extinction and ). The right axis plots the number density which would yield on average 3 galaxies in the survey volume: such models are excluded at 95% confidence if they lie above and to the left of the line denoting the survey limit for each line (H at ; [O III] & H at , [O II] at ; and Ly at ).


Right: The upper-limits on the star formation rates derived from the luminosity limits of various emission lines as a function of number density (see Fig. 4), from the narrow-band survey of Bunker (1996). Standard case B unextinguished line ratios have been adopted – Ly is 8 times stronger than H, so the star formation rates probed are comparable although the redshift is much higher ( vs. ).
5. Near-Infrared Spectroscopy
5.1. Slitless Spectroscopy with HST/NICMOS
The installation of NICMOS on HST offered an unprecedented opportunity to chart star formation at . The low-background in the - and -bands compared to ground-based observatories with their bright atmospheric OH airglow lines, coupled with wavelengths outside the usual atmospheric windows being accessible, made near-infrared slitless spectroscopy a truly effective tool for the first time. Comparable flux limits to the deeper narrow-band searches could be attained in a few orbits, but the comoving volume surveyed was much greater: the entire -band was accessible in a single exposure (a range of for H). Pat McCarthy, Lin Yan and colleagues have analysed the many orbits of parallel-time data obtained with the grisms on the NIC 3 array (). Surveying several fields totalling , McCarthy et al. (1999) found single-line emission objects down to a limiting flux of . Based on this, Yan et al. (1999) derive an SFR for from H which is a factor of higher than that deduced from 280 nm continua, attributable to dust extinction (see Lin Yan’s contribution to this proceedings for more details).
5.2. Near-IR Spectroscopy of Photometrically-Selected Targets
A parallel approach to emission-line searches to determine the global star formation history is to use photometric redshift estimates from deep multi-colour imaging, for example the Hubble Deep Fields, to preselect galaxies likely to be at a suitable redshift (particularly the ‘redshift desert’ in the optical at ), and then use near-infrared spectroscopy to target these and search for the rest-optical line emission. This technique is potentially very powerful, as spectroscopy is much more sensitive to line emission than the narrow-band searches because of the finer resolution element.
With typical resolving powers of , the latest near-IR spectrographs can resolve out the OH sky, enhancing the sensitivity between these lines (particularly in -band, where the sky continuum is quite dark at wavelengths much shorter than the thermal infrared).
Glazebrook et al. (1999) targetted field galaxies of known redshift from the CFRS survey (Lilly et al. 1996) at , and from UKIRT/CGS 4 -band spectroscopy inferred a star formation rate from H higher than from the rest UV continuum, consistent with the NICMOS grism results (§ 5.1.).
This technique of obtaining near-infrared spectroscopy of galaxies with previously-established redshifts has recently been extended to the Lyman-break selected population at . Pettini et al. (1998) obtained UKIRT/CGS 4 spectroscopy with UKIRT on five -drops. The recent availability of NIRSPEC on Keck (e.g., James Larkin’s paper in this volume), and the imminent appearance of similar instruments on the new 8-m telescopes, have the potential to revolutionize this study: near-infrared spectroscopy of a sample of known galaxies will shed light on their stellar populations, abundances, true star formation rates, dust content and kinematics.
The velocity widths measured from the nebular lines are likely to provide much more reliable kinematic information than Ly, which is resonantly broadened and typically exhibits a P Cygni-like profile with the blue wing severely absorbed by outflowing neutral hydrogen. However, the profile of the nebular lines may not be broadened by the full gravitational potential of the host galaxy; their width may instead reflect just the velocity dispersion and outflows within the star-forming H II region (c.f., Pettini et al. 1998).
5.3. Near-Infrared Studies of Damped Absorbers
An extension of the method of taking a near-infrared spectrum of a known high- galaxy to determine its true star formation rate is to study QSO absorption line systems. We know a priori that there is a large gas column density at a particular redshift (causing Ly absorption of the continuum of the background QSO) which is presumably associated with a foreground galaxy. Therefore, a good strategy may be to target where you think a galaxy is. In this volume, Varsha Kulkarni describes a narrow-band search in with HST/NICMOS for line emission from a damped Ly system, and several groups have used ground-based narrow-band imaging in to search for H emission from DLAs (e.g., Bunker et al. 1995; Mannucci et al. 1998).
The measurement of quasar absorption lines allows an independent approach to studying the history of galaxies than the traditional flux-limited selection. The highest hydrogen column density absorbers seen in the spectra of background QSOs, the damped Ly systems (DLAs), contain most of the neutral gas in the Universe at (Lanzetta et al. 1991). The global history of star formation in the Universe can be inferred from the evolution in the co-moving density of neutral gas (derived from the DLA statistics) as it is consumed in star formation; Pei & Fall (1995) model this in a self-consistent manner accounting for dust pollution in the DLAs as star formation progresses. The average star formation rate in each DLA depends then on their space density. One school of thought has DLAs being thick gaseous disks, the progenitors of massive spirals (e.g., Wolfe 1986 and this proceedings). Alternatively, DLAs could be more numerous gas-rich dwarfs, potentially sub-galactic building blocks. To differentiate between these, my colleagues and I have conducted a search for H emission from star formation in damped systems (Bunker et al. 1999), using near-infrared spectroscopy with CGS 4 on UKIRT and building on the previous work of Hu et al. (1993). The absence of any detectable emission at the faint fluxes probed runs counter to the predictions of the large disk hypothesis (Fig. 5) – adding further weight to hierarchical scenarios where today’s massive galaxies were in pieces at high-.
5.4. The Next Frontier: Lyman- at ?
As we push to even greater redshifts, the optical becomes less and less useful: the opacity of the intervening H I absorbers effectively extinguishes most of the flux below nm at , forcing a move to the near-infrared. The continuum break at Ly redshift to the near-IR is a potential way to get to , although spectroscopy of the most promising ‘-drop’ in the HDF-N was inconclusive (Dickinson et al. 1999). Despite its poor track-record, Ly emission may be a better signature of star formation in the very early Universe, when chemical enrichment and dust obscuration were less advanced. The various -band emission line searches (§ 4. and Figs. 4 & 5) already constrain star formation at immense redshift (); as Avi Loeb’s article in this volume suggests, deep integrations on a 10-m may detect Ly even before the onset of the Gunn-Peterson effect, with the red-side of the resonantly-scattered line emission emerging unextinguished.
6. Conclusions
There are two primary considerations in the formation and evolution of galaxies: the assembly of mass (structure formation and the merging history); and the rate of conversion of neutral gas into stars (the star formation rate). Both of these are poorly understood, and may be regulated by various feedback mechanisms as well as being cloaked by dust. The current observational constraints are very weak at high redshift.
Detection of the rest-optical emission lines in galaxies at is important to measure the true star formation rates, to correct for dust and to eliminate systematics in the diagram of evolution in the global star formation rate (Madau et al. 1996; Lilly et al. 1996). This necessitates moving to the near-infrared -, - and -bands. The brightness of the infrared sky background and the immature technology (compared to optical CCDs) has previously been a deterrent to using these windows. However, the advent of modern detectors with low read-noise and large format make near-infrared searches for ‘primæval’ galaxies viable. Near-infrared spectroscopy is about to be revolutionized through the imminent availability of instruments on 10 m-class telescopes, and the latest generation of arrays with large fields-of-view mean that narrow-band searches may at last fulfill their potential. To push to – the next frontier in the Hy-redshift Universe – demands that we abandon the optical.
Acknowledgments.
I am indebted to my main collaborator, Stephen Warren, for his many insights into the high-redshift Universe. Steve Rawlings, Mark Lacy, Gerry Williger, Paul Hewett & Dave Clements have all been involved in the near-infrared searches undertaken by the Oxford group. While at Oxford, my research was supported by a PPARC studentship, and I received financial support at Berkeley from a NICMOS postdoctoral fellowship (NASA grant NAG 5-3043). I gratefully acknowledge enlightening discussions with Harry Teplitz, Lin Yan, Fillipo Mannucci, Mike Pahre & Dave Thompson about their surveys. Stephen Warren, Mark Lacy, Francine Marleau, Daniel Stern & Leonidas Moustakas gave helpful comments on this manuscript. The hard work of George Djorgovski, Ivan King & Daniel Stern made this meeting a reality, and what made it possible is (of course) the illustrious research career of Hyron Spinrad – happy 65th birthday, Hy!
References
Barger, A. J., Cowie, L. L., Sanders, D. B., et al. 1998, Nature, 394, 248
Beckwith, S. V. W., Thompson, D., Mannucci F., & Djorgovski, S. G. 1998, ApJ, 504, 107
Bunker, A. J., Warren, S. J., Hewett, P. C., & Clements, D. L. 1995, MNRAS, 273, 513
Bunker, A. J. 1996,
D.Phil. Thesis, University of Oxford, “Searches for Distant
Galaxies”, abstract in 1997, PASP, 109, 628.
WWW address http://astro.berkeley.edu/~bunker/thesis.html
Bunker, A. J., Warren, S. J., Clements, D. L., Williger, G. M., & Hewett, P. C. 1999, MNRAS, 309, 875
Chen, H.-W., Lanzetta, K. M., & Pascarelle, S. 1999, Nature, 398, 586
Chen, W. L., & Neufeld, D. A. 1994, ApJ, 432, 467
de Propris, R., Pritchet, C. J., Hartwick, F. D. A., & Hickson, P. 1993, AJ, 105, 1243
Collins, C. A., Parkes, I. M., & Joseph, R. D. 1996, MNRAS, 282, 903
Cowie, L. L., Songaila, A., Hu, E. M., & Cohen, J. G. 1996, AJ, 112, 839
Dey, A., Spinrad, H., Stern, D., Graham, J. R., & Chaffee, F. H. 1998, ApJ, 498, L93
Dickinson, M., Hanley, C., Elston, R., et al. 2000, ApJ, in press astro-ph/9908083
Djorgovski, S. G. 1992, in de Carvalho, R., ed., ASP Conf. Ser. Vol. 24, “Cosmology and Large-Scale Structure in the Universe”, Astron. Soc. Pac., San Francisco, p. 73
Faber, S. M., & Gallagher, J. S. 1979, ARA&A, 17, 132
Glazebrook, K., Blake, C., Economou, F., Lilly, S., & Colless, M. 1999, MNRAS, 306, 843
Hu, E. M., Songaila, A., Cowie, L. L., & Hodapp, K.-W. 1993, ApJ, 419, L13
Hu, E. M., Cowie, L. L., & McMahon, R. G. 1998, ApJ, 502, L99
Kennicutt, R. C. 1983, ApJ, 272, 54
Kennicutt, R. C. 1992, ApJ, 388, 310
Koo, D. C. 1986, in Chiosi, C., & Renzini, A., eds., ‘Spectral Evolution of Galaxies”, Reidel – Dordrecht, p. 419
Kunth, D., Mas-Hesse, J. M., Terlevich, E., Terlevich, R., Lequeux, J., & Fall, S. M. 1998, A&A, 334, 11
Lanzetta, K. M., Wolfe, A. M., Turnshek, D. A., Lu, L., McMahon, R. G., & Hazard, C., 1991, ApJS, 77, 1
Lilly, S. J., Le Fèvre, O., Hammer, F., & Crampton, D. 1996, ApJ, 460, L1
Lowenthal, J. D., Hogan, C. J., Green, R. F., Caulet, A., Woodgate, B. E., Brown, L., & Foltz, C. B. 1991, ApJ, 377, L7
Loveday, J., Peterson, B. A., Efstathiou, G., & Maddox, S. J. 1992, MNRAS, 390, 338
Madau, P., Ferguson, H. C., Dickinson, M. E., Giavalisco, M., Steidel, C. C., & Fruchter, A. 1996, MNRAS, 283, 1388
Malkan, M. A., Teplitz, H. I., & McLean, I. S., 1995, ApJ, 448, L5
Malkan, M. A., Teplitz, H. I., & McLean, I. S., 1996, ApJ, 468, L9
Mannucci F., & Beckwith S. V. W. 1995, ApJ, 442, 569
Mannucci F., Thompson D., Beckwith S. V. W., & Williger G. M. 1998, ApJ, 501, L11
McCarthy, P., Yan, L., Freudling, W., et al. 1999, ApJ, 520, 548
Pahre, M. A., & Djorgovski, S. G. 1995, ApJ, 449, L1
Parkes, I. M., Collins, C. A., & Joseph, R. D. 1994, MNRAS, 266, 983
Pei, Y. C., & Fall, S. M. 1995, ApJ, 454, 69
Pettini, M., Kellogg, M., Steidel, C. C., Dickinson, M., Adelberger, K. L., & Giavalisco, M. 1998, ApJ, 508, 539
Pritchet, C. J., & Hartwick, F. D. A. 1990, ApJ, 355, L11
Pritchet, C. J. 1994, PASP, 106, 1052
Steidel, C. C., Pettini, M., & Hamilton, D. 1995, AJ, 110, 2519
Steidel, C. C., Giavalisco, M., Dickinson, M., & Adelberger, A. 1996a, AJ, 112, 352
Steidel, C. C., Giavalisco, M., Pettini, M., Dickinson, M., & Adelberger, A. 1996b, ApJ, 462, L17
Steidel C. C., Adelberger K. L., Giavalisco M., Dickinson M. E., & Pettini M. 1999, ApJ, 519, 1
Steidel C. C., Adelberger K. L., Shapley, A. E., Pettini M., Dickinson M. E., & Giavalisco M. 2000, ApJ, in press astro-ph/9910144
Stern, D., Bunker, A. J., Spinrad, H., & Dey, A. 2000, AJ, submitted
Teplitz, H. I., Malkan, M. A., & McLean, I. S., 1998, ApJ, 506, 519
Thompson, D., Djorgovski, S. G., & Beckwith, S. V. W. 1994, AJ, 107, 1
Thompson, D., Djorgovski, S. G., & Trauger, D. 1995, AJ, 110, 963
Thompson, D., Mannucci F., & Beckwith, S. V. W. 1996, AJ, 112, 1794
Wolfe, A. M., Turnshek, D. A., Smith, H. E., & Cohen, R. D. 1986, ApJS, 61, 249
Yan, L. McCarthy, P., Freudling, W., et al. 1999, ApJ, 519, 47