Obtaining Galaxy Masses Using Stellar Absorption and [O II] Emission-Line Diagnostics in Late-Type Galaxies
Abstract
The [O II] 3727 emission lines and absorption features from stellar Balmer and Ca H&K lines are the most accessible kinematic diagnotics in galaxies at . We investigate the kinematics of 22 local late-type galaxies using these spectral features and we compare the results to 21-cm neutral hydrogen spectra in order to assess the utility of each diagnostic for measuring galaxy masses. In order to simulate data at high redshift where only 1-dimensional velocity profiles are normally available, we study spatially integrated as well as spatially-resolved spectra. Although the studied galaxies span a wide range of morphological types, inclinations, and star formation rates, we find that the gaseous and stellar kinematic tracers yield comparable kinematic line widths and systemic velocities. The [O II] and H I line widths correlate most strongly, showing an intrinsic dispersion of 20 km s-1, or for a typical galaxy with a kinematic width of 200 km s-1. In a few extreme cases, the [O II] line widths underestimate the neutral hydrogen width by 50%. Reliable velocity widths can also be obtained from the stellar Balmer and Ca H&K absorption lines, even for some of the very late–type galaxies which have strong emission lines. The intrinsic dispersion is 10% between the stellar absorption and H I line widths. We provide a prescription for using these strong stellar absorption and [O II] emission features to measure the kinematics, and thus masses, of galaxies in the distant universe.
Subject headings:
Galaxies: individual: — galaxies: fundamental parameters — galaxies: kinematics and dynamics — galaxies: ISM — galaxies: structure1. Introduction
Kinematic studies of distant galaxies reveal their structure at early times and help trace their evolution to the present day. Measurements of the most important kinematic properties, the velocity widths and rotation curves, are now becoming routine for galaxies at cosmologically significant distances. Conclusions are mixed regarding whether distant field galaxies are consistent with local Tully-Fisher (T-F) relations out to . The results are consistent with modest evolution in the T-F relation, in the sense that galaxies of a given rotational amplitude are 0.2-1.5 magnitudes brighter at earlier epochs (Forbes et al. 1995; Vogt et al. 1996, 1997; Simard & Pritchet 1998; Rix et al. 1997). In these studies, the bluest galaxies deviate most strongly from the T-F relation suggesting that the conclusions are sensitive to target selection effects (Bershady et al. 1998). Since current studies rely on the brightest and largest galaxies which have well-defined rotation curves, the samples are small and may be biased by including only the most massive spirals. For early-type galaxies, the velocity dispersions and luminosities provide an estimate of evolution in the fundamental plane. Recent work indicates luminosity evolution for both cluster and field ellipticals. Cluster ellipticals show modest evolution—about 0.8 magnitudes of brightening for a fixed kinematic width at z compared to (Kelson et al. 1997; van Dokkum & Franx 1996; van Dokkum et al. 1998; Treu et al. 1999). This evolution in the fundamental plane is consistent with very early, single-burst, formation scenarios. Field ellipticals show more brightening, 1.5 magnitudes (Gebhardt et al. 2000), suggesting a fairly recent formation epoch.
Measuring the dynamics of galaxies at cosmologically significant redshifts is observationally challenging because traditional kinematic indicators are redshifted to wavelengths inaccessible from the ground for many redshift regimes of interest. For the early-type galaxies at intermediate–to–high redshift, traditional stellar dynamical tracers like H emission, Mg II and G-band absorption features at , and the Ca II triplet shift out of the optical window. They fall within near-IR atmospheric windows or between night sky lines only for specific redshifts. At redshifts of , the stellar Ca H&K and Balmer lines become the only absorption lines accessible with optical spectrographs. For late type galaxies, the [O II] 3727 Å doublet is the most promising emission line for kinematic measurements. It is important to investigate the utility of both spectral features for measuring galaxy masses by comparing the [O II] velocity widths with those of other trusted emission lines (H or 21-cm). Early results are encouraging for the [O II] widths. There is an excellent correlation between optical H rotation curves and 21-cm profiles (e.g., Mathewson, Ford, & Buchhorn 1992; Raychaudhury et al. 1997; Courteau 1997 and references therein). Courteau & Faber (2000) show a tight correlation between [O II], H, and HI kinematics in a sample of Sc galaxies.
Another obstacle for mass estimates at intermediate is that most galaxies are smaller than a typical 1′′ ground-based seeing disk, resulting in unresolved rotation curves. For this reason, it is important to investigate the effects of degraded spatial resolution on kinematic measurements in distant galaxies by comparing global 1-dimensional (i.e., spatially integrated) galaxy spectra with spatially-resolved spectra.
In this paper we present kinematic measurements for 22 local galaxies covering a range of morphological types, from blue compact and irregular, to spiral and active galaxies. We explore whether kinematics derived from [O II] 3726,3729 doublet profiles yield the same results as H and 21-cm neutral hydrogen data. We also compare the velocity widths derived from global emission line and 21-cm profiles with those derived from Balmer and Ca H&K lines to explore the utility of stellar absorption features for measuring masses in late type galaxies where absorption features have not traditionally been used. We find good agreement between different dynamical tracers. In a small fraction of extreme objects, or in data with low S/N, the [O II] line widths may underestimate the kinematic widths by up to 50%.
2. Spectroscopic Observations of Local Galaxies
We obtained optical longslit spectroscopy of 22 local ( km s-1) galaxies over the wavelength range 3650 Å - 4600 Å with the Kitt Peak National Observatory 2.1 m telescope and GoldCam spectrograph during 1999 February 15–19. Table 1 summarizes the targets, their morphological types, and their basic physical properties. Targets were selected to include a diverse assortment of morphological types from blue compact to Sb spiral galaxies. We include 8 objects from the nuclear starburst study of Lehnert & Heckman (1995): NGC 2146, NGC 2798, NGC2966, NGC 3044, NGC 3593, NGC 4527, NGC 4666, and NGC 4818. Most targets have absolute magnitudes in the range with inclinations . Thus, the sample includes objects similar to galaxies used for kinematic studies at intermediate redshifts (Forbes et al. 1995; Vogt et al. 1996, 1997; Simard & Pritchet 1998; Rix et al. 1997).
The observed spectral range includes the [O II] 3727 emission line to measure the kinematics of the ionized gas, and the stellar Balmer and the Ca H&K 3970, 3932 lines to measure the kinematics of the underlying stellar population. Other prominent features in this spectral range include H and H which may be seen either in emission from ionized gas or in absorption from stellar atmospheres. The KPNO grating #47, used in second order with a slitwidth of 2.5′′ and a CUSO4 filter to block first order, yielded a spectral dispersion of 0.47 Å pix-1 and a mean spectral resolution of 1.57 Å (126 km s-1) FWHM at 3727 Å (2.35 Å 156 km s-1 at 4500 Å). The spatial scale of the CCD was 0.78′′ pixel-1, and seeing averaged 2′′. Calibration included corrections for bias, flatfield, slit illumination and cosmic ray rejection. Frequent exposures of an HeNeAr arc lamp provided a wavelength calibration accurate to 0.05 Å RMS (4 km/s). The spatial and spectral characteristics of the spectrograph remained constant from night-to-night and from position to position on the sky, varying by pixel (0.47 Å) throughout the run. Furthermore, the dispersion vector was aligned nearly perfectly with the CCD rows so that the wavelength solution (dispersion and zero point) changed by less than 1 pixel over the entire usable detector area. Based on the frequency and stability of the arc lamp exposures, we estimate that relative radial velocities from exposure to exposure are accurate to 0.25 pixels (10 km s-1). All velocities reported here correspond to the heliocentric reference frame. Occasional cirrus clouds prohibited photometric calibration, but relative fluxes based on spectrophotometric standard stars and radial velocity calibrations based on frequent arc lamp exposure were not affected.
For each galaxy we obtained total integration times of 40 to 60 minutes, broken into multiple exposures to aid cosmic ray rejection. We oriented the 5′ slit along the major axis of each galaxy at the position angle listed in Table 1 and as illustrated in Figure 1. For most of the objects, we also obtained several exposures while the telescope drifted across the galaxy in a direction perpendicular to the slit. These exposures produce a “global” spectrum most closely approximating the spectra being acquired of high-redshift galaxies with typical ground-based resolution elements (several kpc). Generally the drift scans have lower signal-to-noise than the fixed exposures since a smaller fraction of the integration is spent on the high surface brightness portion of the galaxy. Table 1 records the spatial amplitude of the drift for applicable galaxies. Images of the target galaxies appear in Figure 1 along with markers showing the location of the fixed slit exposures and the extent of the drift scan exposures.
We observed 12 stars with well-known spectral types from Leitherer et al. (1996) and Lick IDS spectra from Worthey et al. (1994) in order to construct templates for the measurement of stellar absorption features in the program galaxies. The template stars span a range of spectral types, A2 through K2, and a range of luminosity classes, dwarf through supergiant. Table 2 lists these template stars.
Comparable exposures of the same galaxy were averaged to reject cosmic rays and then background subtracted to remove night sky emission lines. Background subtraction was also necessary to remove the solar spectrum which contamination from a young moon. To simulate most accurately the types of kinematic data being acquired for high-redshift galaxies, we summed the CCD rows over the observable spatial extent of each galaxy to produce a 1-dimensional spectrum. Several extraction apertures of varying size were tested, and produced essentially identical results except in the rare cases where bright H II regions at large radii generate much of the emission line luminosity. In these cases, care was taken to include the entire galaxy in the 1-D spectrum for both the fixed-slit exposures and the drift scan exposures, even though the larger extraction apertures produce 1-D spectra with lower signal-to-noise. We ultimately used the 1-D spectra with smaller extraction windows for analysis. Since the 1-D spectra are effectively intensity-weighted global spectra, the high surface brightness regions at small radii produce most of the kinematic signature. Our results for the small and large apertures yield comparable kinematic measurements, but the smaller extraction window yields more robust results due to the higher signal-to-noise.
In the analysis that follows, we convert all velocities to the heliocentric frame of reference. All velocities and velocity widths discussed in this work refer to projected velocities (in the plane of the sky). In order to compare observable quantities most directly, no assumptions or corrections for galaxy inclination have been made.
3. Analysis
3.1. Two-D [O II] Emission Line Rotation Curves
Courteau (1997) discusses the merits and shortcomings of several methods for extracting rotation curves from spectral data. Here we adopt a straightforward approach, constructing a rotation curve by fitting the centroids of the [O II] emission features along the spatial dimension. The size of each spatial bin was varied to ensure approximately equal number of counts in each bin. At each spatial bin we fit the [O II] doublet using a Gaussian broadening function convolved with the instrumental profile. Calibration lamp exposures provided a measurement of the instrumental spectral profile. Based on Gauss-Hermite polynomial fitting, the instrumental profile has very little skewness () and tail weight (), allowing us to model it as a single Gaussian shape with Å (126 km s-1 at 3727 Å). Since the rotation curve estimates require only knowledge of the velocity centroid, a slight misreprentation of the instrumental or broadening function does not significantly affect the results. Allowing the relative strengths of the [O II] doublet to vary over reasonable values () produced the same rotation curve to within the formal uncertainties.
The resulting rotation curves appear in Figure 2. NGC 3044 is an example of a classical spiral galaxy rotation curve that is well-defined along many spatial resolution elements. He 2-10 is an example of a compact galaxy and shows little detectable rotation at this spatial and spectral resolution. Table 3 lists the (projected) velocity of maximum rotation, , as measured from the data in Figure 2. This estimate, and its uncertainty reflects the mean and standard deviation of the last points in the rotation profile, where the number n ranges from 1 to 5. As discussed in Courteau (1997), the best estimate results from parameter fitting, but the differences from our approach are not significant for the goals of this paper.
3.2. 1-D [O II] Emission Line Profiles
The integrated 1-D spectra result from a convolution of the [O II] doublet profile with the line-of-sight Doppler velocity profile. A deconvolution analysis is required to reconstruct the intrinsic velocity profile. Since the velocity profile shapes range from the classic double-horn to a unimodal shape, the deconvolution must accommodate this large variety. We use maximum-penalized likelihood techniques to determine a non-parametric estimate of the velocity profile. The approach taken here is similar to that used in Saha & Williams (1994), Merritt (1997), and Gebhardt et al. (2000). As a first step, we construct the un-broadened [O II] doublet profile based on the instrumental spectral profile which is well-characterized by a Gaussian function with Å (53 km s-1 for [O II]). We begin the deconvolution with a trial velocity profile composed of 54 km s-1–wide velocity bins. We then convolve that profile with the measured [O II] instrumental doublet profile, and compare to the galaxy spectrum. The program varies the bin heights of the trial velocity profile to converge upon the best convolved galaxy spectrum, assessed using the statistic. The addition of a penalty function to the ensures smoothness in the velocity profile. The integrated squared second derivative represents the penalty function (as in Merritt 1997). We choose a smoothness parameter that weights the penalty function relative to the . This choice is partly subjective, however, a broad range of smoothing values exists over which there is little change in the derived velocity profile. More rigorous techniques for optimizing the smoothing parameter involve generalized cross validation (Wahba 1990; Silverman 1986), but are not important for our needs. The ratio of the [O II] doublet, was allowed to vary from the low density limit of 1.4 to a high density limit of 0.5 in order to achieve a best fit. In most cases, ratios less than 1.2 (electron densities greater than ) produced unacceptable fits, consistent with observations that most HII regions exhibit line ratios indicating low electron densities (Osterbrock 1989).
Table 3 summarizes the derived velocity parameters, including the widths at 20% of the peak flux, , and systemic velocities, (defined as the midpoint between the 20% velocities). Where the profile is Gaussian, can be compared to other width measurements such as the full width at half maximum (FWHM) and velocity dispersion, , using
| (1) |
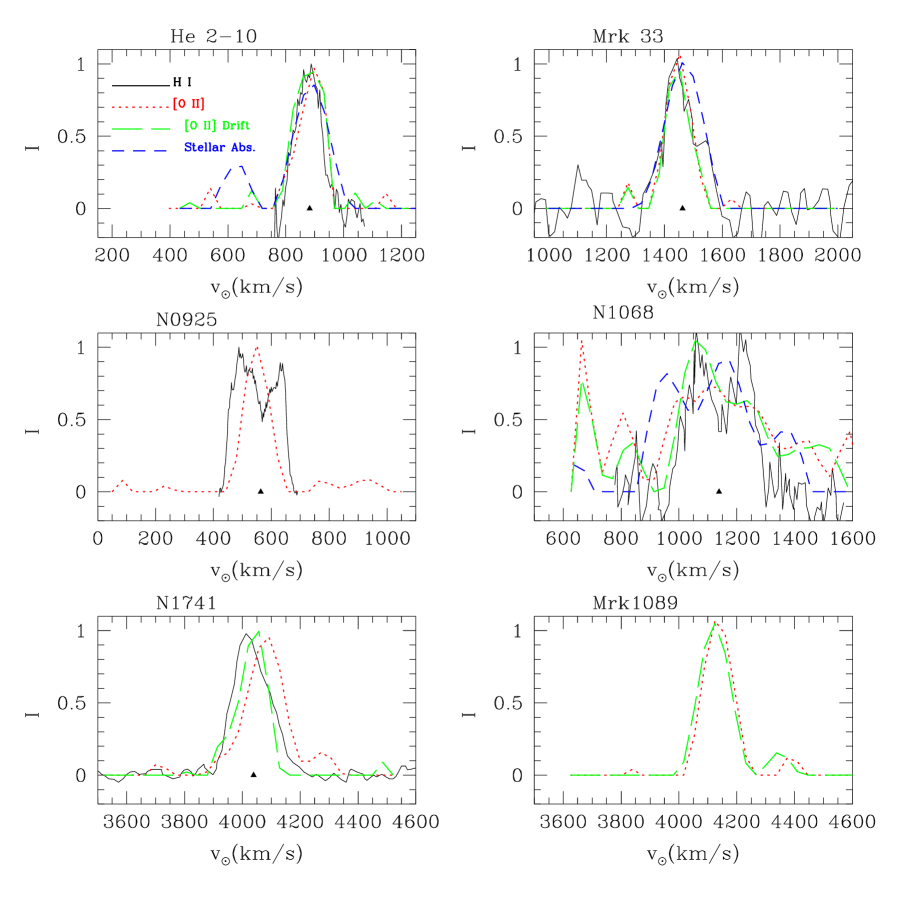
Figure 3 displays the deconvolved [O II] velocity profiles for each galaxy. Profiles from the fixed slit spectra appear in dotted lines, and the drift scan spectra appear in long dashed lines. Although the lower signal-to-noise of the drift scan spectra results in slight differences between the line profiles, the correspondence between the fixed slit and drift scan spectra is generally excellent. Exceptions are NGC 1741 where the fixed slit seems to have been offset from the dominant emission line region. More anomalies and exceptions are discussed in § 4 below.
We estimate uncertainties on the emission line velocity centers and widths using a Monte-Carlo code which adds Gaussian noise to the best-fit velocity profile convolved with the instrumental profile and re-fits the profile. We generate 100 such realizations to characterize the distribution of probable values and estimate confidence limits. Table 3 includes 1 uncertainties on the line centers and widths based on the Monte Carlo simulations.
3.3. 1-D Stellar Absorption Line Profiles
As another probe of galaxy kinematics, we use the stellar Ca H&K and Balmer absorption lines to measure the stellar velocity profile of each galaxy. The procedure uses the same maximum-penalized likelihood approach as the emission-line analysis. The only difference is that we must use stellar templates instead of an instrumental profile since the intrinsic widths of the absorption features are broader than the instrumental profile. Furthermore, galaxies consist of a range of stellar populations that have dramatically different spectral features and shapes, making absorption line work more complicated than emission line studies. To obtain reliable kinematic measurements, one must separate the effects of a mixed stellar population from the effects of broadening due to bulk stellar motions within the galaxy. This separation is particularly difficult in the Ca H&K region, and is why these features have not been widely used for kinematic measurements.
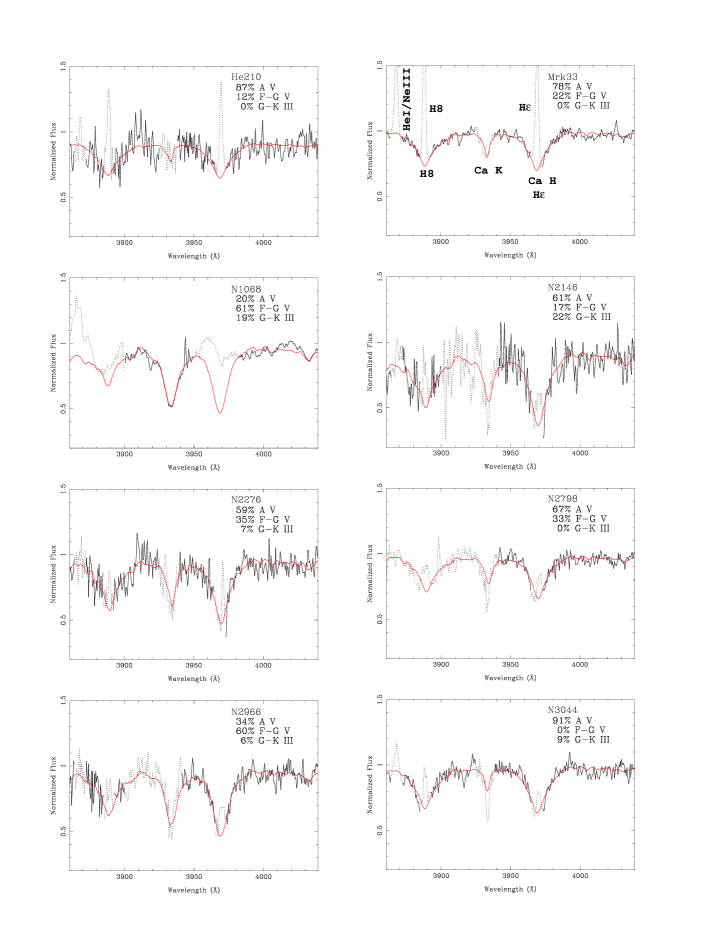
Since the targets encompass a broad range of morphological types, we must adequately sample the full range of stellar types in the host galaxies. The spectra of 12 Galactic A main–sequence through K giant stars served as templates (see Table 2). The maximum-likelihood technique simultaneously determines the best velocity profile and the relative contribution each stellar type. As before, we use the integrated squared second derivatives as the penalty function. The analysis software adjusts the velocity profile bin heights and the relative weight to minimize the chi-squared fit to the data. Due to the prominent, but narrow, emission lines in some galaxies in the Ca H and H vicinity, the emission line regions are excised from the spectrum before the fit. Figure 4 shows the 3850 Å – 4040 Å region of each galaxy spectrum with prominent absorption features. Three strong emission lines are present in this range including the blended [Ne III] 3868/He I 3867, He I 3889 bended with H8, and the H blended with [Ne III] 3967. Figure 4 shows the raw spectrum, along with with the best fit synthesis of template stars convolved with the estimated velocity profile overplotted in solid lines. Dashed lines show excised regions contaminated by emission features. Some galaxies with strong emission lines such as NGC 4214 require that extensive regions be ignored in the fit. This leads to larger uncertainties on the derived kinematic parameters. The choice of excised regions often depends on the particulars of the spectrum. In general we can fix the excised regions: if emission lines are present, we exclude them (3864 Å – 3872 Å, 3885 Å – 3892 Å, 3965 Å – 3973 Å).
One spectral region was consistently difficult to fit with any combination of template star spectra. The region from 3900 Å – 3940 Å showed significant residuals in the best fit synthesis spectra. Two different problems occur. The galaxies He 2-10, NGC 2276, NGC 2798, NGC 4214, and NGC 5248 show strong positive residuals near 3910 Å resembling emission features. The origin of these weak emission features in some galaxies is not clear. Such stellar features do not appear in any of our template spectra, nor are there any known nebular emission lines in this region. One possible source of extraneous lines in this portion of the spectrum is chromospheric emission from giants and binary systems (Stencel 1975; Strassmeier et al. 1993). However, these features are usually weak and would probably not appear at a significant level in the integrated spectrum of an entire galaxy. Another possibility is CN molecular bands in giant stars, but this effect should produce a larger signature in late type galaxies, contrary to the observed trend. We have not been able to find a satisfactory explanation for the origin of these features. We decided on a case-by case basis whether to exclude this region. When no emission lines are present, we use the full spectral range (e.g., NGC 4527, NGC 4666). Another difficulty involves fitting template spectra to galaxies like NGC 2798, NGC 3044, NGC 4218, and NGC 4818, where the Ca K line is narrower and deeper than any combination of template stars can match. Either of these difficulties are plausibly due to metallicity mismatches between the template stars and the galaxies studied. The stellar templates in Table 2 do not include metal-poor stars which are probably common in some of the smaller star-forming galaxies like NGC 4214.
Figure 3 plots the resulting absorption line velocity profiles for each galaxy. We record in Table 3 the velocity width at 20% of the maximum profile depth, and the systemic velocity defined here as the midpoint between the 20% velocities. We estimate uncertainties on the velocities and widths using the same Monte-Carlo technique described in § 3.2.
Sixteen of the 22 targets had sufficient signal-to-noise and measurable absorption line features for analysis. Five of the six galaxies without detectable absorption features (NGC 1741, Mrk 1089, NGC 5253, UM 439, and UM 462) exhibit strong nebular emission which dominates the spectrum. The low continuum signal-to-noise combined with a strong background solar spectrum from the crescent moon precluded a meaningful measurement for NGC 925.
3.4. 21-cm Neutral Hydrogen Spectra
We compiled from the literature the single-dish 21-cm neutral hydrogen spectrum for each galaxy. When more than one profile was available, we selected the one with the best combination of signal-to-noise and velocity resolution, (typically km s-1). Most single-dish observations are based on data with the 92 m NRAO Greenbank radio-telescope, which has a FWHP beamsize of 10′, large enough to adequately cover the angular extent of galaxies in our sample. In order to compare the 21-cm profiles with the newer optical data, we digitized the original published spectra to generate a spectrum in electronic form.111In most cases, the 21-cm spectra date from the early 1980’s, and the data are not recoverable on electronic media from the original authors. From these digitized spectra we measured the full-widths at 20% of the peak intensity, , a standard parameter commonly tabulated in 21-cm studies. We also computed the systemic velocity, , defined here as the midpoint between the 20% velocities. Table 3 lists the original publications for each 21-cm spectrum, along with 21-cm systemic velocities and . Our re-measurements of the systemic velocities and velocity widths from the digitized data are in good agreement with the published values. We estimate that the digitization process introduced errors of km s-1 in velocity and 5% in amplitude compared to the original data. The resulting HI spectra appear in Figure 3. There are no published HI spectra for NGC 4818 but only marginal detections.
To complement the 1-D 21-cm profiles, we searched the literature for spatially resolved rotation curve measurements from aperture synthesis observations. Table 3 lists the maximum HI rotational velocity, , for all galaxies with suitable data, as found in the original references. If more than one aperture synthesis measurement was available, we adopted the most sensitive study, usually from recent Very Large Array (VLA) programs.
4. Results
4.1. Comparison of Velocity Widths Measured from HI [O II], and Stellar Absorption Features
One of the goals of this program was to search for systematic differences between morphological types or pathological systems of any type which exhibit markedly different kinematic signatures in one or more of the measured tracers. Figure 3 shows graphically the one-dimensional velocity profiles measured from 21-cm, [O II], and stellar absorption line spectroscopy. The 21-cm profiles appear in solid lines, the fixed slit [O II] profiles in dotted lines, the drift scan [O II] spectra in long dashes, and the absorption spectra in short dashes. A cursory comparison by eye reveals that the overall systemic velocities and velocity widths measured from the different tracers are generally in good agreement. We discuss exceptional systems in more detail below. Henize 2-10 and Mrk 33 are example of low-mass systems with Gaussian velocity profiles where the three dynamical indicators are in excellent agreement. NGC 2798 and NGC 3044 are examples of larger galaxies where all three measurements yield comparable results, even though the 21-cm and [O II] profiles are double-peaked and the absorption profile from the stellar component is single-peaked.
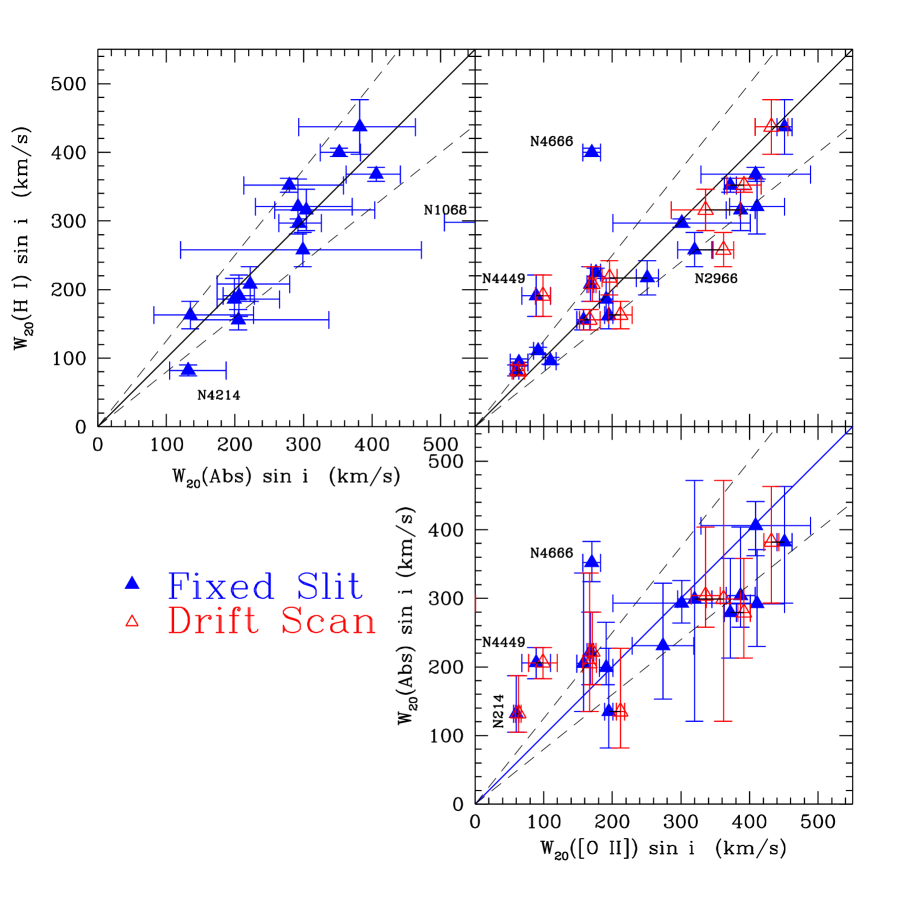
Figure 5 compares the derived velocity widths from each of the three kinematic tracers. In the upper right panel we show the the [O II] full width at 20% max, , versus . Filled symbols distinguish the fixed-position spectra from drift scan spectra (open symbols). Dashed lines denote 20% deviations from the 1:1 correspondence (solid line). NGC 4818 and Mrk 1089 could not be plotted since they do not have published neutral hydrogen spectra. Figure 5 shows a strong correlation between versus , most galaxies falling within 20% of the 1:1 relation. The drift scans yield results consistent with the fixed slit exposures, within the uncertainties. NGC 4449 and NGC 4666 stand out as having broad HI widths compared to the [O II] profile both here and in Figure 3. Inspection of their spectra in Figure 3 reveals that NGC 4449 exhibits a small kinematic width in [O II] perhaps because the HII regions are concentrated near the center of an extended neutral gas distribution and trace only a small fraction of the gravitational potential. NGC 4666 is a starburst galaxy with low-level [O II] emission across the entire HI velocity width, and a strong emission line concentration on one velocity wing. This emission is confined to one portion of the galaxy, and does not trace the full gravitational potential, giving the false signature of a less massive galaxy. If the spectra had been of lower S/N, the weak [O II] emission across the entire 300 km s-1 velocity width seen in HI would have gone unrecognized. NGC 2966 exhibits slightly smaller HI widths compared to the [O II] profile and stellar profile. Unfortunately, there is only one published HI profile for this galaxy, so we are unable to explore the possibility that the neutral hydrogen width is somehow underestimated.
The upper left panel of Figure 5 compares the HI line widths with the absorption line widths. There is again a good correlation between the two indicators. Within the often substantial uncertainties on the absorption line widths, all the data are consistent with the 1:1 correspondence except the irregular galaxy NGC 4214. The Seyfert galaxy NGC 1068 is also discrepant, but since we are unable to spatially separate the high-velocity nuclear regions probed by stellar absorption from the rest of the galaxy, agreement is not expected. We do not consider NGC 1068 further, except as an example of an AGN where the nuclear kinematics are distinct from the overall gravitational potential of the galaxy.
The lower right panel of Figure 5 compares the [O II] emission versus stellar absorption velocity widths. Once again NGC 4666 and NGC 4449 and NGC 4214 stand out as deviant points for the reasons discussed above. The rest of the data show good agreement between the two kinematic indicators.
As an alternative measure of the velocity width, we computed the difference between velocities where the integrated area under the profile on either side reaches 10% of the total area (see Courteau 1997 for discussion of this and other methods). This approach is more robust when measuring objects like NGC 4666 because it is not as sensitive to instrumental resolution or asymmetric profiles. However, this approach is prone to larger uncertainties for noisy data. The [O II] width of NGC 4666 changes from 170 km s-1 to 392 km s-1 when measured in this manner, bringing the [O II] width into accord with the other dynamical indicators. In general, the measured linewidths of all target galaxies become 15% to 25% smaller using this approach. The correlation between the various dynamical indicators explored here remains consistent with the above discussion.
4.2. Comparison of Rotation Curves Measured from HI [O II], and Stellar Absorption
When spatially-resolved velocity data are available, rotation curves provide more information about a galaxy’s kinematics than an integrated profile alone. In each of the target galaxies we measured [O II] rotation curves and the maximum rotational velocity, . Table 3 lists these values. Figure 6 shows a comparison of the projected with the 21-cm rotation curve maximum, where such data were available in the literature. We also compare the measurements to estimates of based on from the prescription of Tully & Fouqué (1985),
| (2) |
Here, is the rotation full amplitude which is 2. km s-1 is the width due to turbulent motions and km s-1 is the transition point between galaxies having Gaussian and those having double-horned HI profiles. We see in Figure 6 that the maximum points on the rotation curves measured either from neutral hydrogen aperture synthesis data or [O II] are systematically less than those predicted by simply taking half of . There is better agreement with the analytic expression of Tully & Fouqué which takes into account the effects of turbulence that become more important in the smallest galaxies. The most discrepant points are the compact low-mass galaxies like He 2-10, Mrk 33, and NGC 925 where measuring a rotation curve becomes difficult due to limited spatial resolution, or because the intrinsic line width due to turbulent motions becomes comparable to the (projected) rotational velocity. The [O II] rotation curve may easily be underestimated due to poor sensitivity or spatial resolution, especially at large distances.
4.3. Comparison of Systemic Velocities Measured from HI [O II], and Stellar Absorption
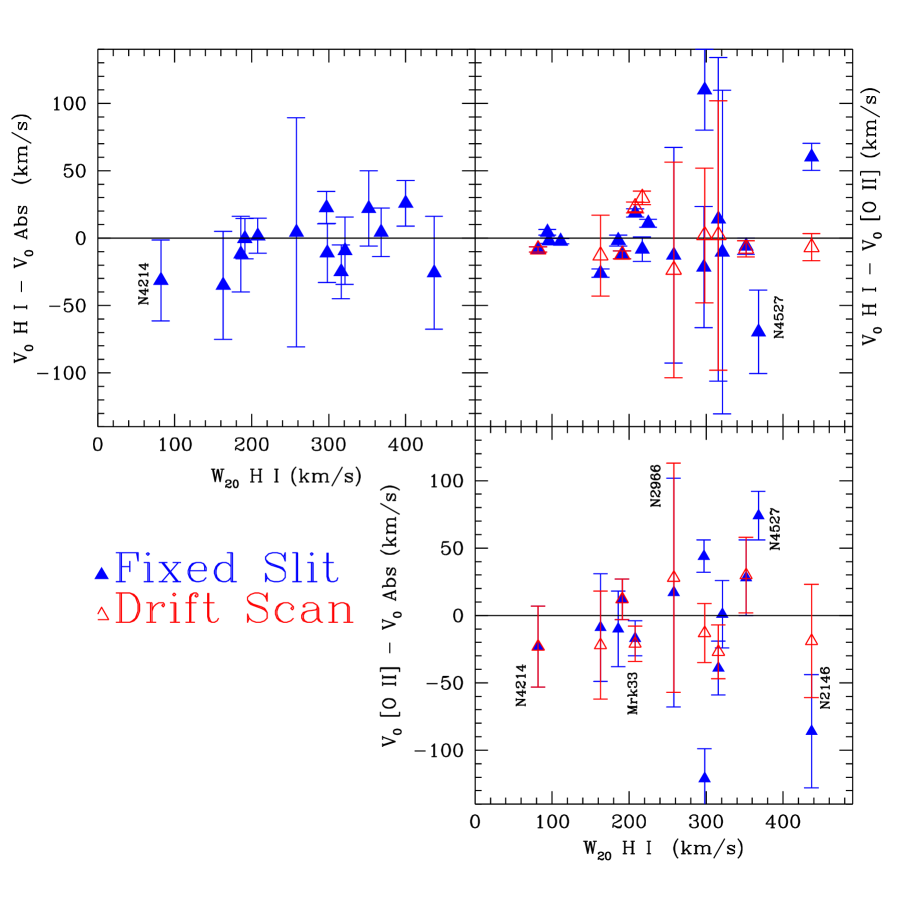
As a measure of the systemic velocity, , for each system, we record in Table 3 the velocity midway between the 20% intensity points used to define . This formulation of the systemic velocity is a well-defined quantity in the case of massive galaxies with two-horned velocity profiles. It is also less sensitive to asymmetries in the line profile in the case of low-mass galaxies with Gaussian profiles where most of the nebular emission may come from a single HII region. Figure 7 illustrates the differences between systemic velocities measured with each technique. We show, as a function of the (projected) neutral hydrogen width, the difference between the (upper left panel), (upper right panel), and (lower right panel). Open symbols distinguish drift scan exposures from fixed-slit integrations (solid symbols). Overall, the three methods yield similar velocities for most galaxies to within the uncertainties on the fits. In nearly all cases the drift scans show better agreement than the fixed slits. In the upper left panel, there is good agreement between the systemic velocities measured with HI and stellar features.
Turning to the upper right panel of Figure 7, a few galaxies show real differences discrepancies as large as 50 km s-1 between the HI and [O II] velocities. In the case of NGC 4527, exceeds by 70 km s-1. Since we do not have a drift scan of this object, we suspect that the fixed slit position missed much of the emission line gas. The line width derived from the [O II] spectrum is narrower ( km s-1) than the Lehnert & Heckman [N II] width of km s-1. Their rotation curve amplitude of 339 km s-1 is significantly larger than our 260 km s-1, consistent with the probability that our choice of slit placement did not cover the entire emission-line extent of the galaxy. Other galaxies show only marginal evidence for systematic offsets between the neutral and ionized gas at the level of km s-1.
4.4. Comments on Individual Objects
Henize 2-10: Henize 2-10 is a blue compact galaxy with a solid body rotation curve typical of dwarf and compact objects (Kobulnicky et al. 1995). Figure 3 shows that the HI, and [O II] features indicate a similar width of km s-1 and km s-1. The measured width of stellar features is slightly greater but consistent within the uncertainties km s-1. The systemic velocity as measured by the HI spectrum appears consistent with the optical data. Given the strong star formation and high optical depth, it is likely that only the nebular emission on the near side of the galaxy is seen in the optical spectra.
Markarian 33: Another blue compact galaxy, Mrk 33 shows an HI line width ( km s-1) which is 30 km s-1 larger than, but consistent with, the nebular emission ( km s-1) and the stellar line width ( km s-1). The emission line gas is evidently confined to only a fraction of the rotation curve traced by the neutral hydrogen and stellar components as suggested by the 1-D profiles in Figure 3. The [O II] rotation curve has a very small measurable amplitude compared to the intrinsic line width measured in the optical and neutral gas, causing Mrk 33 to stand out in Figure 6. This small rotation amplitude is most probably a result of limited spatial resolution and the relatively larger distance of Mrk 33.
NGC 925: This is a moderately inclined late-type spiral for which we can only measure [O II] in the optical spectrum. The stellar absorption features are weak, and at the low redshift of 550 km s-1, its Ca and Balmer features are strongly contaminated by the solar spectrum produced by a nearby 15% illuminated moon. The emission line profile is narrow ( km s-1) compared to the HI profile ( km s-1). The [O II] and HI systemic velocities agree well near km s-1.
NGC 1068: As the only AGN (Seyfert 2 class) in our sample, NGC 1068 shows a broad nuclear emission component which produces the unusual rotation curve in Figure 2. The drift scan exposure yields a lower velocity width than the fixed slit which is dominated by the nuclear kinematics, so we consider only the former. On the basis of the integrated 1-D optical spectrum, it is not possible to deduce a velocity width that accurately reflects the rotational velocity of the outer disk. The measured emission line width is km s-1 compared to the much lower stellar ( km s-1) and HI kinematics ( km s-1). Because of the unique nature of the this object, we do not consider it further for analysis, except to note this as an instance where the nebular lines would clearly lead to an erroneous estimate of the dynamical mass of the system.
NGC 1741/Mrk 1089: These galaxies are members of a Hickson Compact Group (HCG 31) components a and c respectively. Both objects exhibit strong emission lines observed simultaneously with a single slit placement. A comparison of the drift scan exposure with the fixed slit shows that, in the case of NCG 1741, a small displacement of the slit from the dominant emission line region of the galaxy can yield a discrepant systemic velocity. The available HI profiles encompass both galaxies within the large beam of typical radio telescopes. VLA aperture synthesis maps (Williams et al. 1991) reveal a complex HI distribution indicating that these galaxies are interacting and are possibly connected by a common pool of neutral hydrogen. Most of the neutral gas is affiliated with NGC 1741, with secondary peaks in Mrk 1089 and the other two members of the group. This configuration explains why the HI spectrum in Figure 3 reflects more closely the [O II] kinematics of NGC 1741 than Mrk 1089 (not plotted). Comparisons between the nebular and HI kinematics of Mrk 1089 are thus inappropriate until a separate HI profile of Mrk 1089 is available. It was not possible to discern stellar absorption features in either of these objects.
NGC 2146: This early type spiral has the largest velocity amplitude in our sample. Figure 5 shows that the HI width is in good agreement the nebular and stellar tracers. The systemic velocities measured by each tracer are in good agreement for the drift scan measurements, as are the maximum rotation speeds measured from the HI and [O II] rotation curves. Systemic velocities measured from the fixed slit only yield [O II] centroids which are 60 km s-1 smaller than the stellar and 21-cm systemic velocities. This result underscores potential difficulties with using single-position slits rather than drift scans to measure recessional velocities of spatially-resolved galaxies.
NGC 2276: A moderate-inclination late-type spiral, NGC 2276 shows good agreement between all three kinematic width tracers in Figure 5. In Figure 7, and from the profiles plotted in Figure 3, we note a 20 km s-1 offset between the neutral hydrogen profile and the optical [O II] and stellar profiles. The image in Young et al. (1996) reveals a potential reason for this offset. In NGC 2276, HII regions and stellar light preferentially occupy the western half of the galaxy, so that the (intensity weighted) 1-D [O II] and stellar absorption profiles are biased away from the systemic velocity. This object serves to illustrate the magnitude of scatter introduced by inhomogeneous distributions of stellar and gaseous components.
NGC 2798: HI and stellar velocity widths in this low-inclination Sa galaxy are consistent near km s-1, but the optical emission line velocities are somewhat broader at 387 km s-1. The measured systemic velocities agree well in Figure 7 within the uncertainties. These substantial errors are due to the relatively low-S/N. The H profile of the nuclear regions which dominates the spectrum is (Lehnert & Heckman 1995)222Lehnert & Heckman report [N II] profiles in terms of the full width at half maximum (FWHM) and the rotation curve parameters in terms of the rotation full amplitude, . For comparison, we convert these parameters to 20% widths and rotation curve maxima using and . km s-1, consistent with our measurement of km s-1.
NGC 2966: This low-inclination spiral exhibits the classic double-horned velocity profile in both HI and in [O II]. Both the stellar absorption and [O II] profiles are 20-40% broader than the HI profile km s-1. Unfortunately, there is only one published 21-cm spectrum of NGC 2966, so we are unable to verify the HI parameters. The drift scan [O II] data also yields an unusually broad profile compared to the fixed slit. Lehnert & Heckman (1995) present an H image which reveals a nuclear emission region with additional HII regions in the spiral arms at large radius. Their H longslit spectroscopy yields a FWHM of 257 km s-1 for their largest measurement, which would correspond to km s-1, marginally consistent with our km s-1. Their maximum projected rotational velocity, is 116 km s-1 which is smaller than our 15010 km s-1. Given the agreement between our optical results and those of Lehnert & Heckman, we are suspicious of the low HI width and would urge a new single-dish measurement of this galaxy.
NGC 3044: As one of the largest and brightest galaxies in our sample, NGC 3044 has a well defined rotation curve and velocity profile in every tracer. The profiles in Figure 3, and the kinematic summaries in Figures 5 and 7 shows that the shows that the HI and [O II] velocity widths are in good agreement near km s-1. However, the velocity profile measured from the absorption lines is substantially more narrow, km s-1. This appears to be an instance where the light-weighted stellar spectrum samples a smaller portion of the rotation curve than neutral hydrogen and ionized gas at larger radius. The systemic velocities are in excellent agreement.
NGC 3593: In this Sa type spiral, linewidths of the HI and stellar absorption agree well in NGC 3593, km s-1, while the optical emission lines are much broader, km s-1. This spectrum has low S/N and fairly large uncertainties. Our optically-measured line widths of km s-1 are much larger than the 230 km s-1 widths implied by the [N II] spectroscopy of Lehnert & Heckman (1995). However, a direct comparison of the velocity widths is not possible since Lehnert & Heckman subdivide their spectra in to several different radial bins whereas we consider only the entire spatially integrated profile. Despite this possible difference line widths, the maximum [O II] circular velocity of km s-1 is roughly consistent with the [N II] circular velocity of 118 km s-1 reported by Lehnert & Heckman. The systemic velocities measured from all three indicators are in excellent agreement.
NGC 4214: This Magellanic irregular has one of the narrowest velocity profiles in our sample, km s-1, at the limit of our resolution. The HI width is only 82 km s-1, comparable to the optical results which suggest km s-1. Multiple results from the literature confirm this low neutral hydrogen width. The systemic velocities in Figure 7 show good agreement. Curiously, the stellar velocity profile is much broader, km s-1, making NGC 4214 one of the most outstanding points in Figure 5.
NGC 4218: The velocity centroids and widths of all measurements are in good agreement for this moderately inclined Sa type spiral, ranging between km s-1. The HI profile is centered centered 20-30 km s-1 lower than the optical results. The velocity widths of the [O II] emission lines are broad, km s-1 compared to the absorption 21-cm width of km s-1. Aperture synthesis measurements of the 21-cm profile yield a surprisingly narrow km s-1 (Verheijen 1997) while single dish profiles range between 157 km s-1 and 201 km s-1, consistent with the optical results.
NGC 4449: Similar in many ways to NGC 4214, this irregular galaxy has an unusually large HI halo extending to 14 times the optical radius (Bajaja et al. 1994). The HI and stellar absorption profiles agree well, near km s-1, while the [O II] fixed and drift exposures are considerably more narrow, km s-1. Since the signal-to-noise is high in both the optical and 21-cm spectra, this difference s a robust result. NGC 4449 is an example of an object where the global 1-D (intensity-weighted) emission line profile traces only a portion of the rotation curve. Rotational kinematics based only on an [O II] profile would underestimate the rotational velocity by 50%. NGC 4449 is the most significant outlier in Figure 5. Figure 7 shows that the systemic velocities measured from each method are in good agreement.
NGC 4527: One of the most massive galaxies in our sample, NGC 4527 shows good agreement between the absorption line and HI kinematics, km s-1. Lehnert & Heckman report an [N II] width of km s-1 in the nuclear region. Their rotation curve amplitude of 339 km s-1 is significantly larger than our 23213 km s-1, suggesting that our choice of fixed slit placement did not cover the entire emission-line extent of the galaxy. The [O II] systemic velocity is larger by 60 km s-1 but carries large uncertainties due to the presence of low-level emission/noise at extreme velocities (see Figure 3).
NGC 4666: Another large, edge-on galaxy, NGC 4666 exhibits good agreement between the velocity widths measured in HI and stellar features near km s-1. The double-horned HI profile contrasts with the single-peaked stellar absorption profile as shown in Figure 3. The [O II] profile shows one dominant emission peak and superimposed on low-level emission. The dominant emission peak centered near 1700 km s-1 gives the misleading appearance of a narrow velocity profile with km s-1. NGC 4666 serves as a warning that in a low S/N spectrum of a typical high-redshift galaxy, this object could appear to have a small kinematic width. Figure 5 shows that the measured [O II] profile is less than half as large as the HI profile. Unfortunately we do not have a drift scan observation of this target to verify that an integrated spectrum would produce the same result. This unusual emission line profile leads to an artificially aberrant emission line centroid, displaced toward higher velocities.
NGC 4818: There is no published HI spectrum for this galaxy, and only recently is a detection reported by Theureau et al. (1998). The absorption line profile is slightly more narrow than the emission line profile ( km s-1 versus km s-1) in this early type spiral.
NGC 5248: Here the HI, [O II] and stellar profiles give very similar results, km s-1, for this Sbc galaxy. Likewise the systemic velocities agree well. Like NGC 3044, the stellar profile is single peaked, while the HI and [O II] profiles are double-horned.
NGC 5253: NGC 5253 is an amorphous galaxy with a strong central starburst and nebular emission. No stellar features are measurable. The HI and [O II] profiles are Gaussian and agree well in their velocity widths. Lehnert & Heckman (1995) find a maximum rotational amplitude of 3 km s-1 amidst the distorted and irregular velocity field. Martin & Kennicutt (1995) show ordered velocity variations of 25 km s-1 along the minor axis, consistent with the unusual minor-axis HI kinematics seen in VLA maps (Kobulnicky & Skillman 1995).
UM 462: A blue compact dwarf galaxy, the spectrum of UM 439 is dominated by emission lines and no stellar features are measurable. The [O II] rotation curve is consistent with solid body rotation and is measurable over 25 pixels (1.4 kpc). The velocity widths in HI and [O II] are in good agreement.
UM 439 : As with UM 462, the velocity profiles are Gaussian and well-matched in both HI and [O II] with km s-1. No stellar features are measurable.
5. Discussion and Conclusions
We have examined the rotation curves, systemic velocities, and 1-D velocity widths for a wide variety of galaxy types and inclinations to search for systematic deviations between measurements made with 21-cm, nebular [O II], and stellar absorption spectra. The three methods provide kinematic line widths which agree to within 20% for most (19/22) objects, and within 50% in all galaxies studied. NGC 4449, an irregular galaxy with an extremely extended neutral hydrogen halo, is the most discordant: the [O II] line width under predicts the 21-cm line width by a factor of 1.6. NGC 4666 also shows broad extended nebular emission and a strong narrow [O II] peak which might be interpreted as a signature of a small dynamical mass had the signal-to-noise been lower. NGC 4666 serves as a warning that in a low S/N spectrum of a typical high-redshift galaxy, this object could appear to have a small kinematic width.
In general, however, the stellar kinematics as traced by the absorption features yield line widths which are nearly as reliable as the [O II] doublet, even in many late-type galaxies with strong nebular emission lines. Due to the patchy distribution of HII regions within some galaxies, the stellar features yield more reliable estimates of the systemic velocities (as measured by HI 21-cm spectra) than the [O II] data. The spatially-integrated drift exposures yield better estimates of the velocity widths and systemic velocities. The intrinsic dispersion in the difference between systemic velocities measured from the gas and stars appears to be less than 10 km s-1, comparable to our measurement uncertainty, in most systems.
Although our sample does not include early-type galaxies, we expect that the Balmer and Ca H&K region will prove suitable for absorption-line kinematic analysis in those systems as well. For the galaxies that show no visible emission lines, we were able to use the complete spectrum without needing to excise any spectral region. In these cases, the agreement with the HI profiles was excellent. Since early-type galaxies generally do not show emission features, the full optical spectrum may be used in a kinematic analysis. However, we advise caution when emission lines are present. Spectral regions contaminated by emission lines must be excised before measuring the absorption width. Furthermore, in some galaxies, the region from 3900 Å – 3940 Å is affected by a series of weak unidentified lines which can cause difficulty at discussed in §3 above. This region should be excised if adequate template stars are not available.
One goal of this program was to determine whether galaxy masses derived from [O II] emission and stellar absorption features are intrinsically noisier or biased compared to more traditional dynamical indicators. In order to estimate the intrinsic scatter between HI, [O II], and absorption-feature velocity widths in Figure 5, we compare the observed RMS to the expected RMS from the formal uncertainties computed by Monte Carlo methods. The measured RMS between the HI width and [O II] emission is 47 km s-1, and for the absorption width it is 54 km s-1. Given the uncertainties, the expected RMS is 40 and 33 km s-1, respectively. Thus, the data require an additional intrinsic scatter beyond the experimental measurement errors. This additional scatter is 18 km s-1 added in quadrature to the [O II] width uncertainties, and 20 km s-1 for the absorption widths. Since a typical galaxy in our sample has a velocity width greater than 200 km s-1, either kinematic tracer provides a suitable measure of the width, better than 10% in velocity or 20% in the mass (given that mass, ). Surprisingly, this result is true using absorption line kinematics in some of the very late-type galaxies where the mix of stellar population causes large spatial variations in the spectrum. For low mass galaxies with narrow ( km s-1) velocity widths, the measurement uncertainties can approach 50% in velocity and, thus, factors of 2 in mass. While these kinematic indicators should still be useful for measuring the gravitational potential of low-mass galaxies, the relative uncertainties will be significant.
For the most massive systems, however, uncertainties due to the measured intrinsic scatter are smaller than, or comparable to, the dispersion observed in local Tully-Fisher and Fundamental Plane relations. For Tully-Fisher, the scatter has been estimated to be 0.2 magnitudes (Pierce & Tully 1992; Tully & Pierce 1999) to 0.25-0.4 magnitudes (Courteau 1997). This translates into a 12.5% to 20% error in distance or a 10% – 16% error in velocity width (assuming typical slopes, , of 6–7 in the Tully-Fisher relation; ). Thus, the 18 km s-1 uncertainty, which may be introduced by adopting [O II] emission line widths or stellar absorption line widths, only begins to add to the distance scatter for galaxies with W20 below 200 km s-1. Given that the Tully-Fisher galaxies are generally the most massive since they are the easiest to observe and have well-defined rotation curves (as used in Vogt et al. 1997), this additional scatter will have at most a small effect for distant Tully-Fisher analysis.
For the Fundamental Plane, the scatter is around 8% (Jørgensen et al. 1998) in logarithmic effective radius, implying a scatter of 0.25 magnitudes in surface brightness or a 15% error in the velocity dispersion. Since most of our additional uncertainties are below 10% for the absorption line widths, it will have little effect on either the Fundamental Plane scatter or in the estimate of the difference in surface brightness. Since both [O II] emission and stellar Balmer/Ca H&K absorption linewidths correlate well with HI 21-cm linewidths we anticipate the increased use of these kinematic indicators to derive galaxy masses in the distant universe.
References
- (1) Bajaja, E., Huchtmeier, W. K., & Klein, U. 1994, 285, 385
- (2) Bershady, M. A., Haynes, M. P., Giovanelli, R., & Andersen, D. R. 1988, in Galaxy Dynamics, eds. D. R. Merritt, M. Valluri, & J. A. Sellwood (ASP Conf Series)
- (3) Brinks, E., Skillman, E. D., Terlevich, R. J., & Terlevich, E. 1997, Ap&SS, 248, 23
- (4) Courteau, S., Sohn, Y-J., & Faber, S.M., 2000, in preparation
- (5) Courteau, S. 1997, AJ, 114, 2402
- (6) Forbes, D. A., Phillips, A. C., Koo, D. C., & Illingworth, G. D. 1995, ApJ, 462, 89
- (7) García-Gómez, C., & Athanassoula, E. 1993, A&AS, 100, 431
- (8) Gebhardt, K. et al. 2000, in prep
- (9) Gordon, D., & Gottesman, S. T. 1981, AJ, 86, 161
- (10) Gottesman, S. T. 1980, AJ, 85, 824
- (11) Hoffman, G. L., Lewis, B. M., Helou, G., Salpeter, E. E., & Williams, H. L. 1989, ApJS, 69, 65
- (12) Huchtmeier, W. K., 1982, A&A, 110, 121
- (13) Huchtmeier, W. K., & Seiradakis, J. H. 1985, A&A, 143, 216
- (14) Kelson, D. D., van Dokkum, P. G., Franx, M., Illingworth, G., & Fabricant, D. 1997, ApJ, 478, L13
- (15) Kobulnicky, H. A., & Skillman, E. D. 1995, ApJ, 454, L121
- (16) Kobulnicky, H. A., Dickey, J. M., Sargent, A. I., Hogg, D. E., & Conti, P. S. 1995, AJ, 110, 116
- (17) Lee, S-W, & Irwin, J. A. 1997, ApJ, 490, 247
- (18) Lehnert, M. D., & Heckman, T. M. 1995, ApJS, 97, 89
- (19) Leitherer et al. 1996, PASP, 108, 996
- (20) Lewis, B. M., Helou, G., & Salpeter, E. E. 1985, ApJS, 59, 161
- (21) Martin, C. L., & Kennicutt, R. C. 1995, ApJ, 447, 171
- (22) Mathewson, D. S., Ford, V. L., & Buchhorn, M. 1992, ApJS, 81, 413
- (23) Merritt, D. 1997, AJ, 114, 228
- (24) Osterbrock, D. E. 1989, Astrophysics of Gaseous Nebulae and Active Galactic Nuclei, University Science Books:Mill Valley CA, p. 134
- (25) Peterson, S. D. 1979, ApJS, 40, 527
- (26) Pierce, M., & Tully, R.B. 1992, ApJ, 387, 47
- (27) Pisano, D. J., Wilcots, E. M., & Elmegreen, B. G. 1998, AJ, 115, 975
- (28) Raychaudhury, S., von Braun, K., Bernstein, G. M., & Guhathakurta, P. 1997, AJ, 113, 2046
- (29) Richter, O.-G., & Huchtmeier, W. K. 1987, A&AS, 68, 427
- (30) Richter, O-G. & Huchtmeier, W. K. 1991, A&AS, 87, 425
- (31) Rotts, A. H. 1980, A&AS, 41, 189
- (32) Rix, H-W. Guhathakurta, P., Colless, M., & Ing, K. 1997, MNRAS, 285, 779
- (33) Saha, P., & Williams, T. B. 1994, AJ, 107, 1295
- (34) Salzer, J. J., MacAlpine, G. M., Boroson, T. A. 1989, ApJS, 70, 447
- (35) Silverman, B.W., 1986, Density Estimation for Statistics and Data Analysis (New York: Chapman and Hall)
- (36) Simard, L., & Pritchet, C. J. 1998, ApJ, 505, 96
- (37) Shostak, G. S. 1978, A&A, 321, 341
- (38) Staveley-Smith, L., & Davies, R. D. 1987, 224, 953
- (39) Stencel, R. E. 1977, ApJ, 215, 176
- (40) Strassmeier, K. G., Fekel, F., Bopp, B. W., Dempsey, R. C., & Henry, G. W. 1990, ApJS, 72, 191
- (41) Telles, E., Melnick, J., & Terlevich, R. 1997, MNRAS, 288, 78
- (42) Theureau, G., Bottinelli, L., Coudreau-Durand, N.;, Gouguenheim, L.;, Hallet, N., Loulergue, M., Paturel, G., Teerikorpi, P. 1998, A&AS, 130, 333
- (43) Tifft, W. G., & Cocke, W. J. 1988, ApJS, 67, 1
- (44) Treu, T., Stiavelli, M., Casertano, S., Møller, P., & Bertin, G. 1999, preprint
- (45) Tully, R. B. 1988, Nearby Galaxies Catalog, Cambridge University Press:Cambridge
- (46) Tully, R. B., & Fouqué, P. 1985, ApJS, 58, 67
- (47) Tully, R. B., & Pierce, M. J. 1999, ApJ, in press
- (48) van Dokkum, P. G., & Franx, M. 1996, MNRAS, 281, 985
- (49) van Dokkum, P. G., Franx, M., Kelson, D. D.,& Illingworth, G. D. 1998, ApJ, 500, 714
- (50) Van Zee, L., Skillman, E. D., & Salzer, J. J. 1998, AJ, 116, 1186
- (51) Verheijen, M. A. W. 1997, PhD Thesis, (Groningen)
- (52) Vogt, N., Forbes, D., Phillips, A. C., Gronwall, C., Faber, S. M., Illingworth, G. D., & Koo, D. C. 1996, ApJ, 465, L15
- (53) Vogt, N., Phillips, A. C., Faber, S. M., Gallego, J., Gronwall, C., Guzman, R., Illingworth, G., Koo, D. C., & Lowenthal, J. D. 1997, 479, L121
- (54) de Vaucouleurs, G, de Vaucouleurs, A., & Corwin, H. G., Buta, R., Paturel, G., & Fouqué, P. 1991, Third Reference Catalog of Bright Galaxies, Springer, New York (RC3)
- (55) Wahba, G. 1990, Spline Models for Observational Data (Philadelphia: SIAM)
- (56) Williams, B. A., & Rood, H. J. 1987, ApJ, 63, 265
- (57) Williams, B. A., McMahon, P. M., & van Gorkom, J. H. 1991, AJ, 101, 1957
- (58) Worthey, G., Faber, S., Gonzales, J., & Burstein, D. 1994, ApJS, 94, 687
- (59) Young, J. S., Allen, L., Kenney, J. D. P., Lesser, A., & Rownd, B. 1996, AJ, 112, 1903
![[Uncaptioned image]](/html/astro-ph/9911361/assets/x2.png)
![[Uncaptioned image]](/html/astro-ph/9911361/assets/x3.png)
![[Uncaptioned image]](/html/astro-ph/9911361/assets/x4.png)
![[Uncaptioned image]](/html/astro-ph/9911361/assets/x6.png)