Signatures of dual scaling regimes in a simple avalanche model for magnetospheric activity.
Abstract
Recently, the paradigm that the dynamic magnetosphere displays sandpile-type phenomenology has been advanced, in which energy dissipation is by means of avalanches which do not have an intrinsic scale. This may in turn imply that the system is in a self organised critical (SOC) state. Indicators of internal processes are consistent with this, examples are the power law dependence of the power spectrum of auroral indices, and in-situ magnetic field observations in the earth’s geotail. An apparent paradox is that, rather than power laws, substorm statistics exhibit probability distributions with characteristic scales. Here we discuss a simple sandpile model which yields for energy discharges due to internal reorganization a probability distribution that is a power law, whereas systemwide discharges (flow of “sand” out of the system) form a distinct group whose probability distribution has a well defined mean. We analyse the model over a wide dynamic range whereupon two regimes having different inverse power law statistics emerge, corresponding to reconfigurations over two distinct scaling regions: short scale sizes sensitive to the discrete nature of the sandpile model, and long scale sized up to the system size which correspond to the continuous limit of the model. The latter are anticipated to correspond to large scale systems such as the magnetosphere. Since the energy inflow may be highly variable, we examined the response of the model under strong or variable loading and established that the power law signature of the large scale internal events persists. The interval distribution of these events is also discussed.
1 Introduction
Recently there has been interest in relating observed characteristics of global energy transport in space plasmas to “sandpile” models which dissipate energy by means of avalanches (Consolini, 1997; Chapman et al., 1999). When such models exhibit scale free, inverse power law statistics in the probability distributions of energy released by avalanches, and of avalanche length and duration, they are candidates for description in terms of self organised criticality (SOC) (Bak et al., 1987, 1988; Lu, 1995) see also Jensen (1998) and references therein. The power spectra may also have an inverse power law (“1/f”) signature, and SOC was introduced to explain the ubiquity of such spectra and of fractality in Nature.
Chang’s suggestion (Chang, 1992, 1998a, 1998b) that the magnetosphere is in an SOC state has motivated application of avalanche models to the solar wind-magnetosphere-ionosphere system. Observational motivation includes sporadic nature of energy release events within the magnetotail (“Bursty Bulk Flow” events (Angelopoulos et al., 1996)), power law in-situ magnetic field power spectra (Hoshino et al., 1994), and power law features of magnetospheric index data, notably AE which is an indicator of energy dissipated by the magnetosphere into the ionosphere. Tsurutani et. al. (1990) described a broken power law AE spectrum; indicative of SOC but not conclusive as power law power spectra are not unique to SOC systems (Jensen, 1998) . Consolini (1999) has recently used AE data taken over a ten year period to construct the distribution of a burst measure extending the result obtained for one year in (Consolini, 1997). This work strongly suggests that inverse power law burst statistics are a robust feature of the AE data, albeit with an exponential tail and some evidence of an additional lognormal component. It is currently less clear that the power law is solely of intrinsic magnetospheric origin and it may in fact be related to the behaviour of the solar wind energy input (Freeman et al., 1999). Since the global reconfigurations of the magnetotail (substorm events) appear to have occurrence statistics with a well defined mean, Chapman et al. (1998) demonstrated a simple avalanche model (another example is (Pinho and Andrade, 1998)) that in principle has relevance for the magnetosphere in that it yields systemwide avalanches where the statistics have a well defined mean (intrinsic scale), whereas their internal avalanche statistics are scale free.
An additional consideration for space plasmas are the means by which the conjecture of scale free statistics can be tested. We wish to test the hypothesis that the probability distributions of energy dissipated, length scales and duration of avalanches are of power law form as seen in the original observations of SOC (Jensen, 1998) in a slowly driven sandpile. Since to test for power law statistics we need to maximise the range of sizes of events, the required statistical experimental evidence requires long runs of data. In the magnetospheric system this will then imply that both the instantaneous value and smoothed local mean of the loading rate (the solar wind) will have strong variation.
In this paper we illustrate some robust features of the avalanche statistics of the simple avalanche model (Chapman et al., 1998, 1999) which are needed for application of such a model to space plasma data. We investigate to what extent the model gives inverse power law avalanche statistics under slow loading. We show how these statistics are modified under strong and/or variable loading. We shall also see that two distinct regimes for energy transport, both with power law avalanche statistics but with different slopes, emerge from the sandpile algorithm, depending on the size of the system. In addition we show how these may be characterized in terms of the interval distribution of events on different spatial scales.
2 A two-regime avalanche model
2.1 The algorithm
Sandpile algorithms generally include an array of nodes, at each of which there is a variable amount (height) of sand; a critical gradient (difference in height between neighbouring nodes) which, if exceeded by the actual gradient, triggers local redistribution of sand; and algorithms for redistribution and fuelling. The main measured output is the statistics of the emergent avalanche distribution. Kadanoff et al. (1989) gave an early classification of such models. The relationship of the models to experimental sandpiles, and to the ideal concept of SOC remain topics of active research (see for example Jensen (1998), also Dendy and Helander (1997)).
The sandpile model used here is described in more detail in (Chapman et al., 1999; Helander et al, (1999)). We have a one-dimensional grid of equally spaced cells one unit apart, each with sand at height and local gradient . There is a repose gradient below which the sandpile is always stable, and with respect to which heights and the gradients are measured. Each cell is assigned a critical gradient . If the local gradient exceeds this, the sand is redistributed to neighbouring cells and iteration produces an avalanche. The critical gradients on each of the nodes are selected from a uniform (“top hat”) probability distribution . is generated by choosing the at random with uniform probability from the range , and the integral of over all is unity.
Sand is added at cell 1 at a rate , and we normalize length and time to the mean loading rate. If the critical gradient is exceeded at cell 1, the sand is redistributed. Our redistribution rule is conservative and instantaneous: sand will propagate to cell 2 and if the local critical gradient there is exceeded, to cell 3 and so on. Within this avalanche, the sand is instantaneously “flattened” back to the angle of repose at which the sandpile is always stable. Propagation of an ongoing avalanche from one cell () to the next () thus occurs if
| (1) |
In consequence a quantity of sand is deposited on the next cell:
| (2) |
so that the gradient at relaxes to the angle of repose (here normalized to zero)
| (3) |
Since all cells within the ongoing avalanche are at the angle of repose following this conservative redistribution of sand to the cell, we require the heights of all these cells to become:
| (4) |
The iterative procedure described above (where superscript * denotes an intermediate step) continues until the avalanche reaches a cell where the gradient is subcritical. The critical gradients at cells within the flattened post-avalanche region are then rerandomized as above. More sand is added then at cell 1 until this end cell again becomes unstable, triggering another avalanche. An avalanche may be entirely an internal rearrangement of sand or may continue until it spreads across all cells. We call the latter a systemwide discharge, in which case the entire sandpile is emptied and returns to the angle of repose.
This relaxation rule allows propagation of information (correlation) across the avalanche and therefore potentially on all length scales in the sandpile. This permits the possibility of scale free self organising behaviour in a one dimensional system, whereas other SOC reorganisation rules (Bak et al., 1987; Jensen, 1998) have typically required two dimensions.
The total energy dissipated by an avalanche (internal or systemwide) is just the difference in the potential energy in the entire sandpile before and after the avalanche
| (5) |
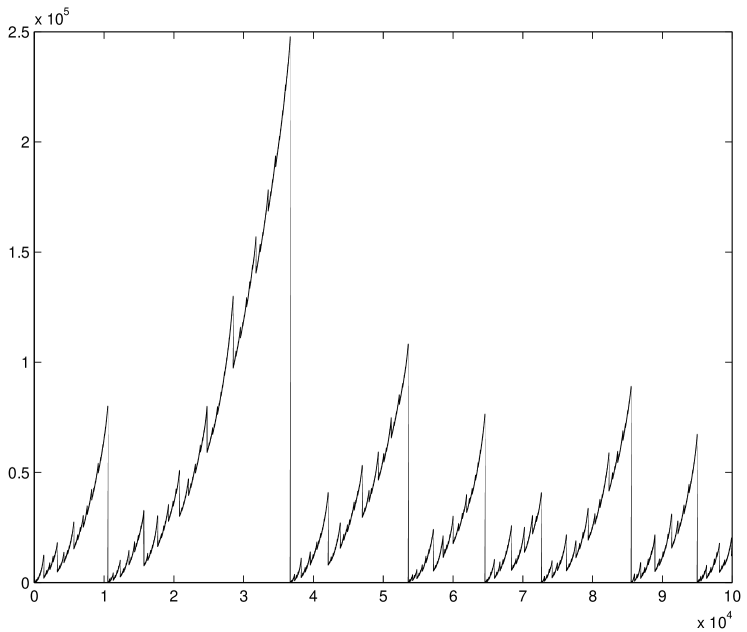
An example of a time series for the energy is shown in Figure 1. The 5000 cell sandpile was loaded slowly () with respect to the mean value of the . The critical gradients were uniformly and randomly distributed in the range . With the angle of repose normalized to zero, the time evolution is by systematic growth as sand is added, interspersed with systemwide avalanches where the energy falls back to zero, and internal avalanches where the energy is reduced to some nonzero value.
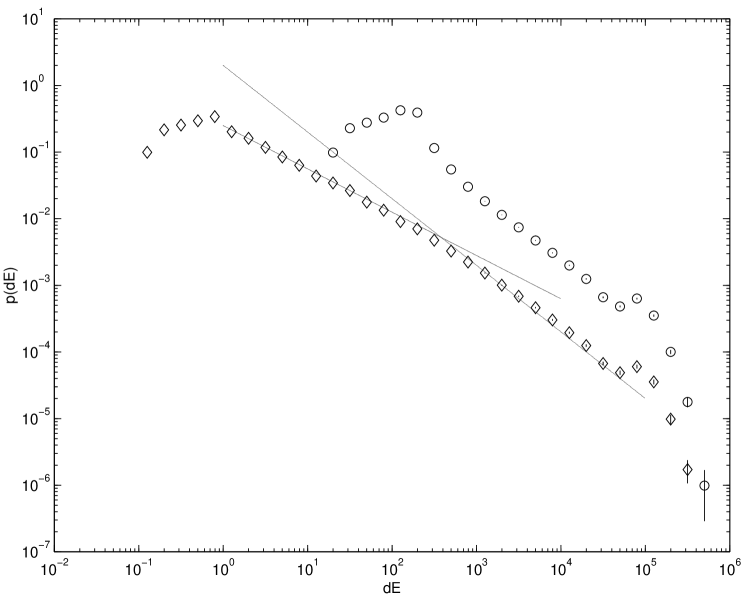
The statistics of the energy released in internal and systemwide avalanches for two longer runs of this sandpile under more realistic conditions of fluctuating input are shown in Figure 2, with the normalized probability distribution for both internal and systemwide avalanches plotted as a single population. As in all sandpile runs here, the populations comprise over internal and systemwide avalanches.
The two runs in figure 2 are for slow (, diamonds) and fast (, circles) mean loading rates, giving an indication of the expected behaviour of a system with strong variation in the driver, such as the solar wind driven magnetosphere (see also (Watkins et al., (1999)). For both values of inflow rate internal avalanches show distinct inverse power law regions with a turndown at small , whereas the systemwide events which have a characteristic mean (Chapman et al., 1998, 1999) appear as a bump at the high energy end. The distinct behaviour of the systemwide avalanches, independent of the inflow rate, shown here is a necessary condition for applicability to the magnetosphere (Chapman et al., (1998)). The internal avalanches show different behaviour under slow and fast loading. Essentially, the smaller events are destroyed as we increase the average loading rate, making larger events more probable. Hence the normalized probability of larger events shows an increase on the plot. Importantly, their power law slope (here of index ) is preserved and is thus a robust feature that should be apparent in observations under variable loading.
We now discuss the internal avalanches in more detail.
2.2 System scales and power law index
Two lines and are drawn on Figure 2 (and all subsequent figures). The values and are an approximate fit through the points. Under slow loading the sandpile exhibits two distinct regimes. In the case where , ( any positive constant) the sandpile evolution with time has been found analytically and, if the system is normalized to have total length unity, it can be shown that (Helander et al., 1999). The arguments of Helander et al., (1999)) lead us to expect a region of power law index in for sandpile with of finite width. We might also anticipate that as the width of is decreased more of the total range of would be characterized by a power law index , but surprisingly this is not so.
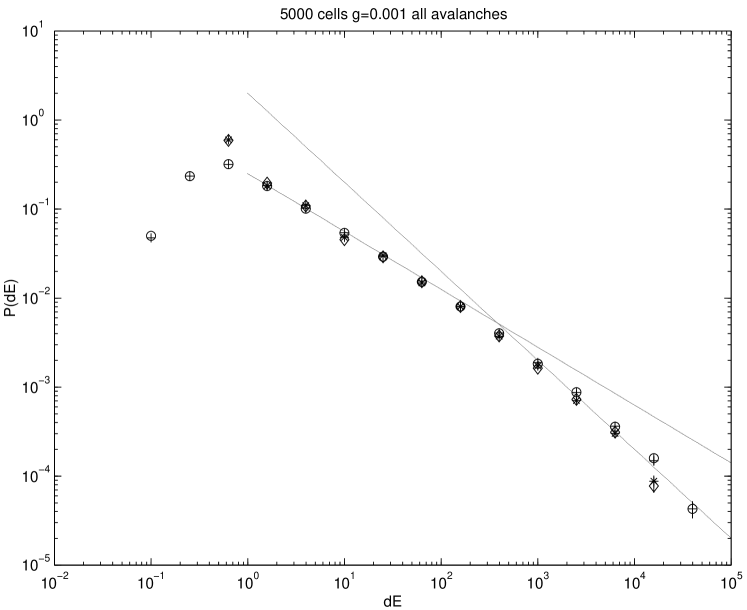
The for four sandpile runs are superposed in Figure 3, differing only by the choice of . For three of these the same mean critical slope but three different widths () have been used. The fourth also has with width , but has a different mean . In this latter case we have rescaled since, on average, the heights of sand needed for instability will be smaller by an order of magnitude, so that (5) will yield values of that are on average smaller by two orders of magnitude. Figure 3 suggests that all features of the probability distribution are robust against the choice of , which effectively represents the local condition for instability.
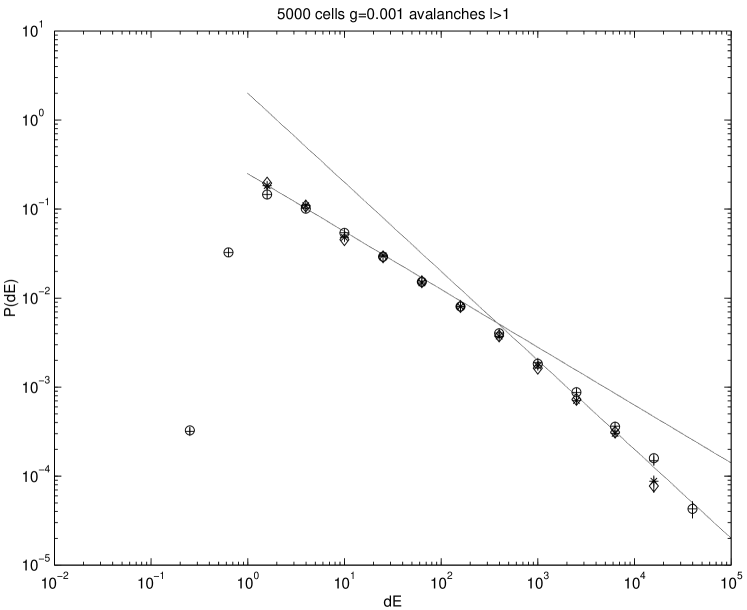
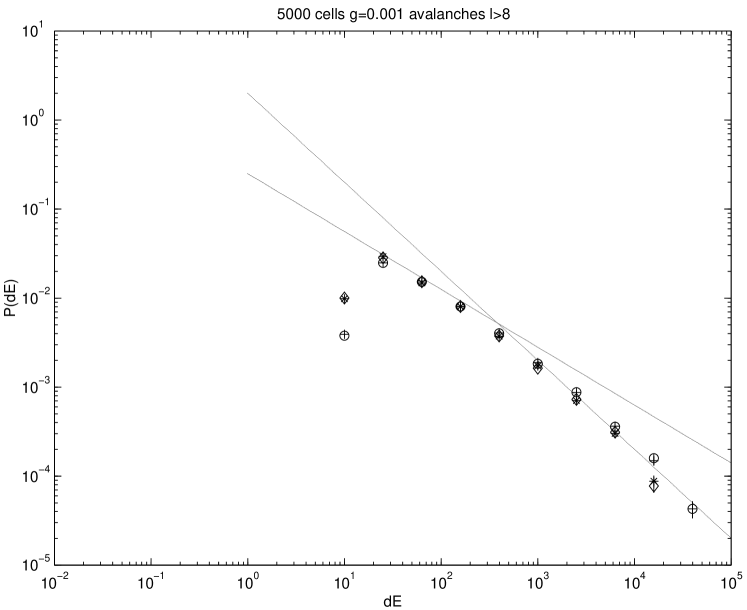
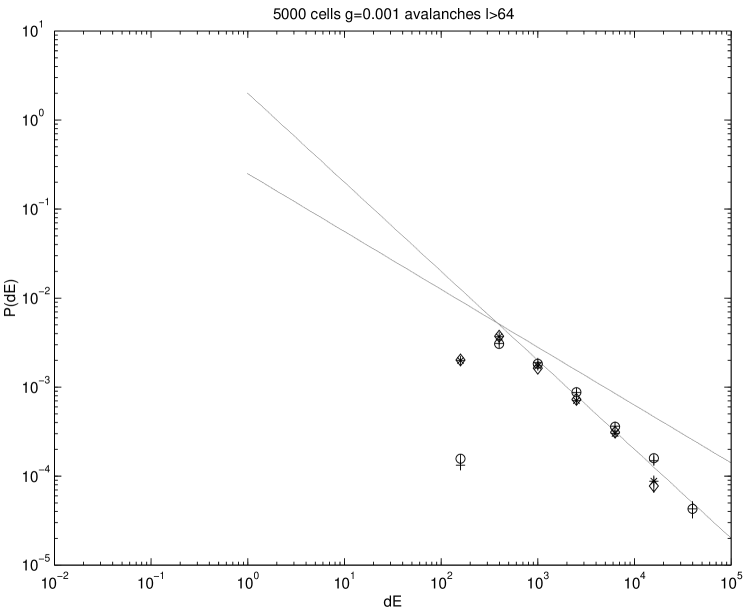
Avalanches dissipating smaller amounts of energy might be expected to extend over smaller length scales, illustrated in Figures 4-6 where we replot the data shown in Figure 3, showing only the contribution from successively longer avalanches. Avalanches with lengths respectively are shown.
Independent of the details of we see that the power law index corresponds to avalanches that extend over less than cells. Figure 4 then shows that the drop at in Figure 3 corresponds to avalanches that are one cell in length.
The sandpile thus has three distinct regimes in its statistics: single cell avalanches that (as expected) are not power law; avalanches smaller than 64 cells, with power law index , which may reflect the discrete nature of the grid; and avalanches longer than cells and up to the system size, with power law index , which may approach a continuous limit for the system.
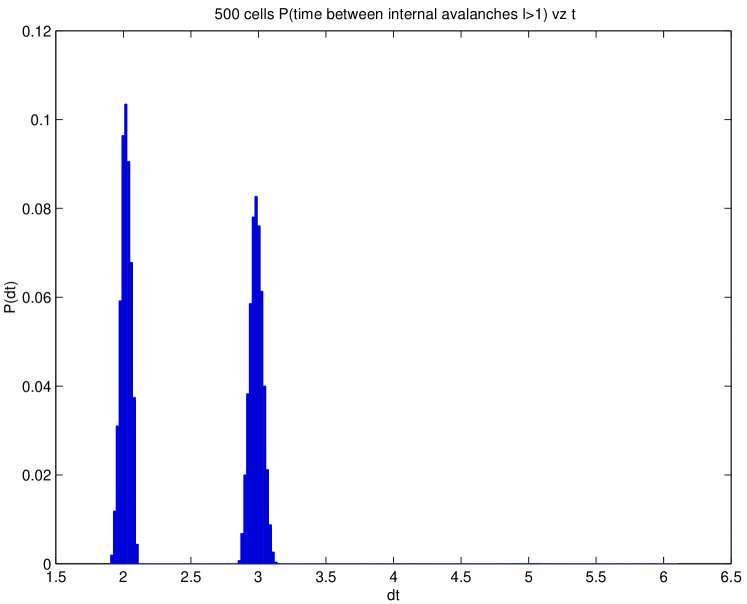
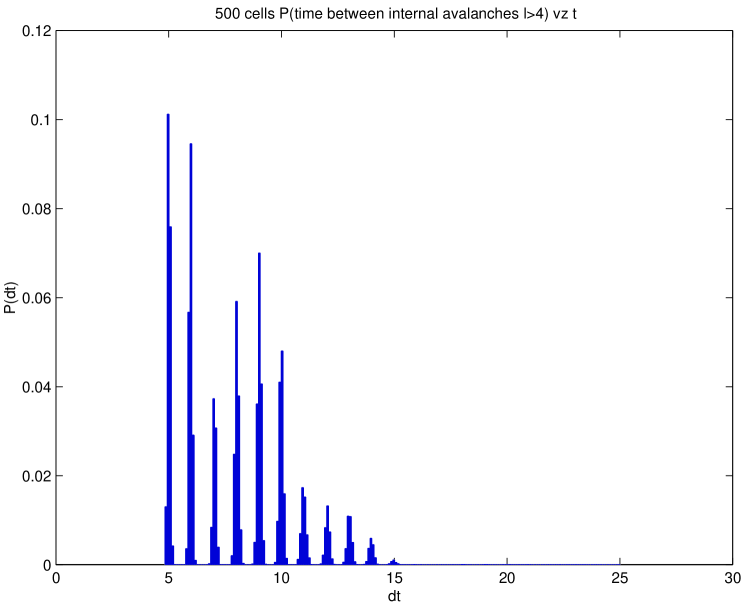
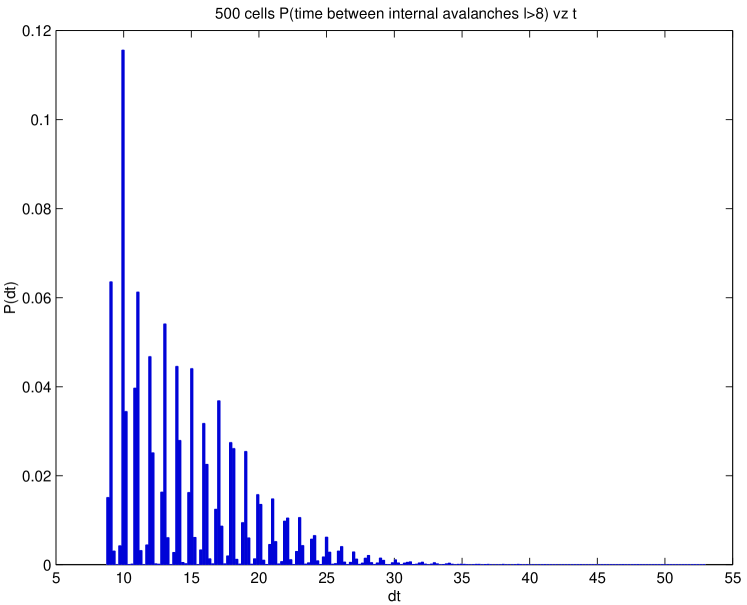
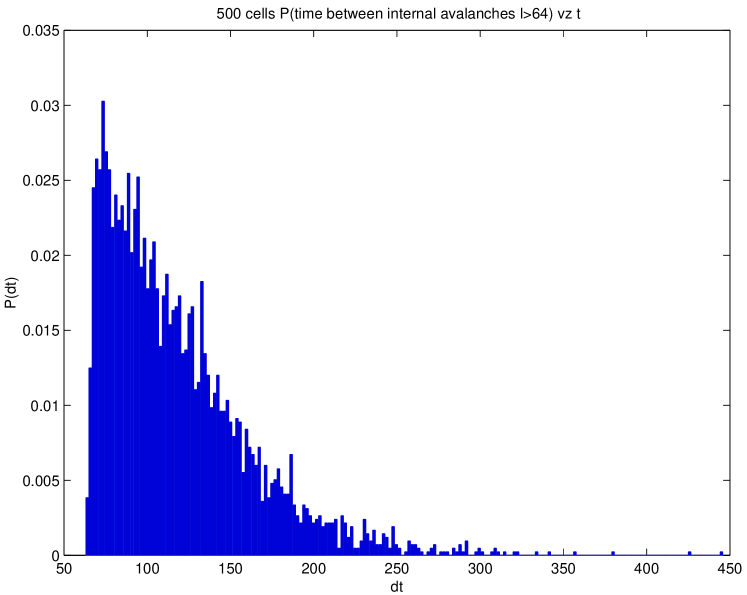
The interval distribution (that is, the probability distribution of time intervals between events) provides further insight into the difference between avalanches on the small and the large scale. In figures 7-10 we show a series of interval distributions from the single sandpile run with constant slow fuelling and with top hat probability distribution for the critical gradients . The figures show the time intervals between sucessively larger avalanches, that is, of all avalanches of length and . Since sand is always added at cell 1, and hence instability always occurs first at cell 1 a plot of the interval distribution for all avalanches (not shown) simply reproduces the probability distribution for , ie, the the distribution of times between sucessive avalanches, all of which are triggered at the first cell. As we selectively plot the distributions of time intervals between longer avalanches, that have propagated further down the sandpile, we see the effect of the interaction of more cells in the sandpile.
Figure 7 shows intervals between all avalanches that have propagated beyond cell 1 (ie length ). Here we see two characteristic timescales corresponding to avalanches that stop at cell 2, and those propagating beyond cell 2. Time is normalised to the inflow rate (such that unit sand is added to the sandpile in unit time) so that avalanches that reach cell 2 and stop will only occur after sufficient sand has been added to exceed the critical gradient at cell 1, which has mean value 1. Hence the minimum time interval in this case is . As we increase the miminum avalanche length considered, the minimum time interval also increases correspondingly. The detailed behaviour becomes complex for lengths ¿1 but less than 64, that is, including avalanches which dissipate energy according to power law index . The general trend however is for an increasing number of characteristic time intervals to appear as we only consider avalanches of increasing length. When we exclude avalanches that dissipate energy according to power law index by only considering avalanches of length (figure 10) the interval distribution has become continuous with cutoff at time interval 65 as we would expect. The large scale avalanches identified as those dissipating energy with probability distribution that is power law index therefore correspond to this continuous limit. Unlike laboratory plasmas (see Chapman et al., (1999)) these large scale events are expected to be relevant to astrophysical systems and are expected to be the robust observable in the case of the magnetosphere which has strong, variable loading.
3 Conclusions
A simple one dimensional sandpile model has been developed with two distinct characteristics in the probability distribution of energy discharges. For internal reorganisation there are two distinct inverse power law regimes, whilst for systemwide discharges (flow of sand out of the system) the probability distribution has a sharply-defined mean. Our model may be applied to magnetospheric dynamics (Chapman et al., (1998)), for example in reconciling the apparent paradox of power law indexes in internal dynamics with substorm event statistics which have peaked distributions.
Under slow loading the internal dynamics exhibits two regimes which have inverse power law statistics of index and , corresponding to reconfigurations on distinct length scales. Short length scales may arise from the discrete nature of the grid, while we also see longer scales, up to the system size, that effectively approach a continuous limit of the model. We find a transition between these regimes at avalanche lengths of about 64 cells.
For space plasma systems observations taken over long periods are required to test for possible inverse power law statistics. The loading of the system (in the case of the magnetosphere, the solar wind) is often characterised by both strong variability about a mean, and a large dynamic range of mean energy input. The inverse power law form of the statistics of large internal avalanches has been shown to be robust under fast loading. The effect of large loading rates is to exclude events which dissipate small amounts of energy, which in our model results in a single inverse power law regime with downturn at lower energies. We expect such inverse power law avalanche distributions to be a persistent feature in long runs of data that include “fast” inflow conditions if the underlying system is governed by SOC.
Acknowledgements: The authors thank R. O. Dendy for stimulating discussions and Giuseppe Consolini for a preprint of (Consolini, 1999). SCC was supported by a Particle Physics and Astronomy Research Council lecturer fellowship.
References
- [1] Angelopoulos V., Coroniti F. V., Kennel C. F. , Kivelson M. G., Walker R. J., Russell C. T., McPherron R. L., Sanchez E., Meng C. I., Baumjohann W., Reeves G. D., Belian R. D., Sato N., Friis-Christensen E., Sutcliffe P. R., Yumoto K. and Harris T. (1996) Multipoint analysis of a bursty bulk flow event on April 11, 1985. Journal of Geophysical Research 101, 4967-4989.
- [2] Bak P., Tang C. and Weisenfeld K. (1987) Self-organised criticality: An explanation of 1/f noise. Physical Review Letters 59, 381–384.
- [3] Bak P., Tang C. and Wiesenfeld, K. (1988) Self-organised criticality. Physical Review A38, 364–374.
- [4] Chang T. S. (1992) Low dimensional behaviour and symmetry breaking of stochastic systems near criticality - can these effects be observed in space and in the laboratory ?. IEEE Transactions on Plasma Science, 20, 691–694.
- [5] Chang T. S. (1998a) Multiscale intermittent turbulence in the magnetotail. In Substorms-4. ed. S. Kokubun and Y. Kamide, pp 431–436. Terra Scientific Publishing Company/Kluwer Academic Publishers, Tokyo.
- [6] Chang T. S. (1998b) Sporadic localised reconnections and multiscale intermittent turbulence in the magnetotail. In Geospace Mass and Energy Flow: Results from the International Solar Terrestrial Physics Program. ed. J. L. Horwitz, D. L. Gallagher and W. K. Peterson, pp. 193-199. Geophysical Monograph 104, American Geophysical Union, Washington, D.C.
- [7] Chapman S. C., Watkins N. W., Dendy R. O., Helander P. and Rowlands G. (1998) A simple avalanche model as an analogue for magnetospheric activity. Geophysical Research Letters 25, 2397–2400.
- [8] Chapman S. C., Dendy R. O. and Rowlands G. (1999) A sandpile model with dual scaling regimes for laboratory, space and astrophysical plasmas. Physics of Plasmas, 6, 4169 .
- [9] Consolini G. (1997) Sandpile cellular automata and magnetospheric dynamics. In Proceedings volume 58, “Cosmic Physics in the Year 2000”. eds. S. Aiello, N. Iucci, G. Sironi, A. Treves and U. Villante, pp 123–126. Societa Italiana di Fisica, Bologna, Italy.
- [10] Consolini G. (1999) Avalanches, scaling and 1/f noise in magnetospheric dynamics. Physical Review Letters, submitted.
- [11] Dendy R. O. and Helander P. (1997) Sandpiles, silos and tokamak phenomenology: a brief review. Plasma Physics and Controlled Fusion, 39, 1947–1961.
- [12] Dendy R.O., Helander P. and Tagger M. (1998) On the role of self-organised criticality in accretion systems. Astronomy and Astrophysics 337, 962–965.
- [13] Freeman M. P., Watkins N. W. and Riley. D. J. (1999) Evidence for a solar wind origin of the power law burst lifetime distribution of the AE indices. Geophysical Research Letters, submitted.
- [14] Helander P., Chapman S. C., Dendy R. O., Rowlands G. and Watkins, N. W. (1999) Exactly solvable sandpile with fractal avalanching. Physical Review, E59, 6356–6360.
- [15] Hoshino M., Nishida A., Yamamoto T. and Kokubun S. (1994) Turbulent magnetic field in the distant magnetotail – bottom up process of plasmoid formation ? Geophysical Research Letters, 21, 2935.
- [16] Jensen H. J. (1998) Self-Organised Criticality: Emergent Complex Behaviour in Physical and Biological Systems, Cambridge University Press, Cambridge.
- [17] Kadanoff L. P., Nagel S. R., Wu L. and Zhou, S. (1989) Scaling and universality in avalanches. Physical Review , A39, 6524
- [18] Lu E. (1995) Avalanches in continuum dissipative systems. Physical Review Letters 74, 2511–2514
- [19] Pinho S. T. R, and Andrade R. F. S. (1998) An Abelian model for rainfall. Physica, A255, 483–495
- [20] Tsurutani B., Sugiura M., Iyemori T., Goldstein B. E., Gonzalez W. D., Akosofu S.-I. and E. J. Smith (1990) The nonlinear response of AE to the IMF driver: a spectral break at 5 hours. Geophysical Research Letters, 17, 279–282.
- [21] Watkins, N. W., Chapman S. C., Dendy R. O. and Rowlands G. (1999) Robustness of collective behaviour in a strongly driven avalanche model: magnetospheric implications. Geophysical Research Letters, 26, 2617-2620.