A High Fraction of Mergers in the cluster MS1054–03 at
Abstract
We used the Hubble Space Telescope to take a wide field, multicolor image of the high redshift cluster MS1054–03 at . The Keck telescope was used to take 200 redshifts in the field. We have a total of 81 spectroscopically confirmed cluster members with deep WFPC2 imaging. A surprisingly large number of these cluster members are mergers: 13 out of 77 galaxies are classified as merger remnants, or mergers in progress. Most of these are red, and massive. Their restframe B luminosities are amongst the brightest in the cluster: we find that 5 out of the brightest 16 are mergers. No such bright mergers were found in a lower redshift cluster with similar wide field coverage. The mergers in MS1054–03 are preferentially found in the outskirts of the cluster. The distribution of pairs in the outskirts of the cluster shows an excess of galaxies with separation h-1kpc, which is independent confirmation of the enhanced interaction rate. The fraction of mergers (17 %) is comparable to the fraction of ellipticals (22 %). Hence up to 50 % of low redshift ellipticals may have formed through mergers since . There is no evidence for strong star formation in most of the mergers. The mean stellar ages of the mergers may therefore be much older than the “assembly age”, i.e., the age since the time the system was put together. These new results are qualitatively consistent with predictions from hierarchical galaxy formation, and are inconsistent with an early collapse for all early type galaxies.
Leiden Observatory, PO Box 9513, 2300 RA Leiden, Netherlands
Center for Astrophysics, 60 Garden Street, Cambridge, MA 02138, USA
DTM, Carnegie Institution of Washington, 5241 Broad Branch Road, NW, Washington D.C., 20015
University of California Observatories, University of California, Santa Cruz, CA 95064
1. Introduction
High redshift clusters can be used very efficiently to study galaxy formation and evolution. Their high overdensities allow us to study large numbers of galaxies with relatively small field imagers and spectrographs. Furthermore, the range in morphologies in clusters, and between clusters, allow us to study a variety of galaxy types.
We have embarked on a study of several massive clusters, out to a redshift of 1, using the Hubble Space Telescope to take mosaics of deep multi-color images, and using large telescopes to take deep spectroscopy. Our goal is to study a few clusters very well, with wide coverage HST imaging, and extensive spectroscopy. Our study is complementary to most other programs which study larger samples of clusters with limited coverage (e.g., Dressler et al. 1997, and references therein).
Until now, we have obtained wide field HST data on MS1358+62 at , MS1054–03 at , and recently, MS2053–04 at . All these clusters were selected from the EMSS survey (Gioia et al. 1990). We have obtained redshifts for each of these fields (Fisher et al. 1998, van Dokkum et al. 1999, 2000), and deep spectroscopy of the brighter galaxies to measure internal velocity dispersions (van Dokkum & Franx 1996, Kelson et al. 1999, van Dokkum et al. 1998). Here we present our new results on MS1054–03, the highest redshift cluster in the EMSS catalogue (Gioia et al. 1995, Luppino & Gioia 1996).
2. Observations of MS1054–03
We have taken deep, multicolor images of MS1054–03 at 6 pointings with WFPC2 on the Hubble Space Telescope. The Keck telescope was used to take 200 spectra, aimed to be complete to an I magnitude of 22.7. The typical integration time per galaxy was 40 min. We were able to measure redshifts of 186 galaxies, and of those, 80 were cluster members. Together with data from literature, we found 89 cluster members, of which 81 lie in the area of the HST images.
2.1. Merger fraction
We classified the spectroscopically confirmed cluster members, analogous to our classification of galaxies in MS1358+62 (Fabricant et al. 1999). We classified galaxies along the revised Hubble sequence. We allowed for a separate catagory of mergers. We combined the 3 classifications from 3 of us, and verified that the results were robust from classifier to classifier. The results have been presented in van Dokkum et al. (1999, 2000).
The main outcome of this exercise is the high fraction of mergers in MS1054–03. Many of these mergers are very luminous. One of the most striking ways to display the effect, is to show a panel with the 16 brightest galaxies (Fig 1.) Five out of these 16 were classified as mergers. A color version of figures 1 and 2 can be found at http://www.strw.leidenuniv.nl/~franx/clusters.
Here goes ms1054.bright16.gif. See
http://www.strw.leidenuniv.nl/~franx/clusters/ms1054
for the postscript file.
Here goes ms1358.bright16.gif. See
http://www.strw.leidenuniv.nl/~franx/clusters/ms1054
for the postscript file.
A similar mosaic of the cluster MS1358+62 at is shown in Fig. 2. The absence of mergers in this lower redshift cluster, and the much more homogeneous color distribution are notable.
The enhancement of peculiar galaxies in MS1054–03 could be due to the brightening of low mass galaxies during a starburst. We verified that the merger fraction remains high if the galaxies are selected by mass, instead of (blue) luminosity.
The optical colors of the mergers are consistent with this result. As shown in Fig. 3, the mergers are generally red, with a few exceptions. Similarly, the spectra of most of the mergers do not show strong emission lines.
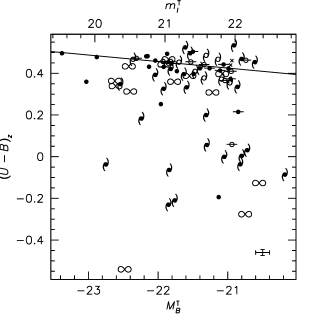

These results suggest that the bulk of the stars of the mergers were formed well before the merger. Hence the stellar age of the merged galaxies is significantly different from the “assembly age”, i.e., the time at which the galaxy “was put together”.
The results are consistent with the hypothesis that the mergers evolve into ellipticals. Their scatter in the color-magnitude diagram is significantly larger than the scatter for the ellipticals (0.073 versus 0.045 in restframe U-B). After aging of the stellar populations, the scatter of the total population of mergers+ellipticals will have decreased from 0.054 at to 0.015 at . Hence a low scatter at does not mean that all galaxies in the population are homogeneous and very old: the influence of merging can be small if the star formation involved with the merging is low.
The physical reason for the low star formation is unknown: it is possible that the massive precursor galaxies had already lost their cold gas due to internal processes (such as super winds, or winds driven by nuclear activity). Alternatively, the cluster environment may play an important role: the cold gas may have been stripped by the cluster X-ray gas. Observations of more clusters may shed further light on this effect.
2.2. Pair fraction
Whereas the classifications of galaxies remains a subjective procedure, counting close pairs of galaxies is a very objective way to establish whether interactions and mergers are enhanced. Furthermore, the distribution of pairs may shed light on the future merging rate in the cluster. We have counted the number of pairs in the outskirts of the cluster, to avoid the high density core. The pair fraction is shown in Fig 3b. As we can see, there is an excess of pairs at small separations ( 10 h-1kpc). Half of these are classified as mergers, the other half not. These may constitute a reservoir of “future” mergers. It will be interesting to measure the velocity differences of the galaxies in pairs.
3. Conclusions
We have found a high fraction of mergers, which are generally red. The fraction is comparable to the number of ellipticals. The results are qualitatively consistent with the hypothesis of hierarchical galaxy formation. The relatively old stellar age of the mergers compared to the young “assembly age” is consistent with predictions from semi-analytical models (e.g., Kauffmann 1996).
The results are inconsistent with the hypothesis that all ellipticals are formed and assembled at very high redshift. Nevertheless, many questions remain open:
-
•
Is the result for MS1054–03 typical for high redshift clusters ? Is the merger fraction higher or lower in the field ? It is interesting to note that studies of the field give high merger fractions and/or pair fractions at intermediate redshift (e.g., Patton et al. 1995, Le Fevre et al. 1999). It remains to be seen whether these field mergers are as massive as the mergers found in MS1054–03.
-
•
What is the typical redshift at which the mass of early type galaxies was half of the current mass ?
-
•
When did the major episode of star formation occur ?
Future studies can be directed to shed light on these questions.
References
Dressler, A., et al. 1997, ApJ, 490, 577
Fisher, D., Fabricant, D., Franx, M., van Dokkum, P., 1998, ApJ 498, 195
Fabricant, D., van Dokkum, P., Franx, M., 1999, in preparation
Gioia, I. M., Maccacaro, T., Schild, R. E., Wolter, A., & Stocke, J. T. 1990, ApJS, 72, 567
Kauffmann, G., 1996, MNRAS, 281, 487
Kelson, D. D., Illingworth, G. D., van Dokkum, P. G., Franx, M., 1999, ApJ, in press, astroph-9906152
Le Fevre, O., et al. 1999, MNRAS, in press, astro-ph/9909211
Luppino, G. A., & Gioia, I. M., 1995, ApJ, 445, L77
Patton, D. R., Pritchet, C. J., Yee, H. K. C., Ellinson, E., Carlberg, R. G., 1997, ApJ, 475, 29
van Dokkum, P. G., Franx, M. 1996, MNRAS, 281, 985
van Dokkum, P. G., Franx, M., Kelson, D. D., Illingworth, G. D., 1998, ApJL, L504
van Dokkum, P. G., Franx, M., Fabricant, D., Kelson, D. D., Illingworth, G. D. 1999, ApJ, 520, L95
van Dokkum, P. G., et al. 2000, in preparation