SIMULATIONS OF DAMPED LYMAN-ALPHA AND LYMAN LIMIT ABSORBERS IN DIFFERENT COSMOLOGIES: IMPLICATIONS FOR STRUCTURE FORMATION AT HIGH REDSHIFT
Abstract
We use hydrodynamic cosmological simulations to study damped Ly (DLA) and Lyman limit (LL) absorption at redshifts in five variants of the cold dark matter scenario: COBE-normalized (CCDM), cluster-normalized (SCDM), and tilted () models; and open (OCDM) and flat (LCDM) models. Our standard simulations resolve the formation of dense concentrations of neutral gas in halos with circular velocity for and for , at ; an additional LCDM simulation resolves halos down to at . We find a clear relation between HI column density and projected distance to the center of the nearest galaxy, with DLA absorption usually confined to galactocentric radii less than kpc and LL absorption arising out to projected separations of 30 kpc or more. If we consider only absorption in the halos resolved by our standard simulations, then all five models fall short of reproducing the observed abundance of DLA and LL systems at these redshifts. To estimate the absorption from lower mass halos, we fit a power-law to the relation between absorption area and halo circular velocity in our simulations and extrapolate using the Jenkins et al. (2001) halo mass function; we do not apply this method to the TCDM model because it has too few halos at the level resolved by our simulation. In the two LCDM simulations, for which DLA results agree well in the mass regime of overlap, the mean cross-section for DLA absorption is , much larger than the simple estimate based on collapse of the baryons to a centrifugally supported disk ( is the halo virial radius). The cross sections for LL absorption are , with a dependence on numerical resolution at the level. Detailed examination provides further evidence of non-equilibrium effects on absorption cross-section: for example, individual absorbers can be slightly smaller in more massive halos because gas sinks deeper into the potential wells, but more massive halos nonetheless have larger average cross-sections because they are more likely to have multiple gas concentrations. Our extrapolation procedure implies that all four models are consistent with the observed abundance of DLA systems if the fitted extends to , and they may produce too much absorption if the relation continues to . Matching the observed abundance of LL systems requires absorption in halos down to . Our results suggest that LL absorption is closely akin to DLA absorption, arising in less massive halos or at larger galactocentric radii but not caused by processes acting on a radically different mass scale. Robust tests of cosmological models against the observed amount of high column density absorption will require simulations of representative volumes that resolve halos at the low-mass limit where they cease to harbor high column density absorbers, .
1 Introduction
Systems producing absorption in the spectra of distant quasars offer an excellent probe of the early Universe. At high redshifts, they easily outnumber other observed tracers of cosmic structure, including both normal and active galaxies. The interpretation of low column density quasar absorption systems has undergone somewhat of a revolution during the past several years, with the recognition that they may consist of gas aggregating into mildly nonlinear structures analogous in their dynamical structure to today’s galaxy superclusters (Cen et al., 1994; Petitjean et al., 1995; Zhang et al., 1995, 1997; Hernquist et al., 1996; Miralda-Escudé et al., 1996; Bi & Davidsen, 1997; Hui, Gnedin, & Zhang, 1997). However, damped Ly (DLA) absorbers, with neutral hydrogen column densities , are usually thought to be associated with the dense interstellar gas of high-redshift galaxies, based on several lines of circumstantial evidence: similarity between the column densities of damped systems and the column densities through typical spiral disks today, rough agreement between the total mass of atomic hydrogen in damped absorbers at and the total mass of stars today (Wolfe & Prochaska, 1998), measurements of radial extents in two DLA systems (Briggs et al., 1989; Wolfe et al., 1993), and direct imaging of a number of DLA hosts from ground based and HST observations (Rao & Turnshek, 1998; Turnshek et al., 2000; Djorgovski et al., 1996; Fontana et al., 1996; Moller & Warren, 1998; Le Brun et al., 1997). The nature of Lyman limit (LL) absorbers, with , is less well understood, though most models associate them with the outer regions of galaxies (e.g. Mo & Miralda-Escudé (1996)).
Analytic studies based on the Press-Schechter (1974) formalism suggested that the abundance of DLA systems might be a strong test of cosmological models, potentially ruling out those models with little power on galaxy scales at (Kauffmann & Charlot, 1994; Mo & Miralda-Escudé, 1994). The most sophisticated of these calculations, that of Kauffmann (1996), implied that the “standard” cold dark matter model (SCDM, with , , and a power spectrum normalization ) could account for the observed abundance of high-redshift DLA systems, with about 30% of the absorption at occurring in galaxies with halo circular velocities . Katz et al. (1996, hereafter KWHM) presented the first predictions of the amount of DLA and LL absorption based on 3-dimensional hydrodynamic simulations, concluding that these simulations of the SCDM model came within a factor of two of matching the observed DLA abundance but fell nearly an order of magnitude short of reproducing observed LL absorption. Ma et al. (1997) “calibrated” DLA estimates from collisionless N-body simulations against the KWHM SCDM simulations, then applied this calibration to N-body simulations of cold+hot dark matter (CHDM) models. They concluded that the CHDM scenario failed to reproduce the observed DLA abundance even with a neutrino fraction as low as , strengthening the earlier, analytic arguments, which focused on CHDM with .
Quinn, Katz, & Efstathiou (1996; QKE hereafter) and Thoul & Weinberg (1996) find that halos with circular velocities are unlikely to harbor DLA absorbers. Gas in halos below this limit does not collapse sufficiently to shield itself from the UV background and reach the necessary HI column densities. The shortcoming of the KWHM calculation was that it could not include the contribution from DLA and LL systems below its resolution limit, corresponding to a halo circular velocity . Consequently, the simulations themselves can only provide a lower limit to the total amount of DLA and LL absorption in the Universe. In Gardner et al. (1997a; GKHW hereafter), we addressed this shortcoming by combining the KWHM results with high resolution simulations of individual, low mass objects similar to those of QKE. We used these simulations to obtain a relation between absorption cross-section and halo circular velocity , which we combined with the Press-Schechter halo abundance to compute the total DLA and LL absorption in the SCDM model. The correction for previously unresolved halos increased the predicted absorption by about a factor of two, bringing the predicted DLA abundance into good agreement with observations but leaving the predicted number of LL systems substantially below the observed number. In Gardner et al. (1997b; GKWH hereafter), we applied the relation derived for SCDM to other cosmological models, obtaining more general predictions for DLA and LL absorption under the assumption that the relation between halo and gas absorption cross-section was independent of cosmological parameters.
In this paper, we present results of simulations of several variants of the inflation+CDM scenario (see, e.g. Katz, Hernquist & Weinberg 1999) and improve upon the GKWH results by using these simulations to predict DLA and LL absorption in these models. We continue to use a Press-Schechter based extrapolation (with the mass function of Jenkins et al. 2001) to compute the contribution of smaller halos to DLA and LL statistics, employing an improved methodology that significantly changes the GKHW predictions for absorption by low mass systems. Using an improved fitting procedure, we obtain more accurate error estimates of our fitted to the simulated data. We find that our largest error in estimating the universal amount of DLA and LL absorption arises from the uncertainty in the exact at which halos cease to harbor these absorbers. Given the large number of halos at , a small variation in the exact value or form of this cutoff leads to significant deviations in the estimation of total DLA and LL absorption cross sections. In light of these results, we find that we are not yet able to test the four cosmologies we consider against the observed DLA and LL abundances. Instead, we have adopted the approach of determining the value of in each model that yields best agreement with the observations.
The nature of the galaxies that host DLA systems has been a controversial topic for many years. Two competing hypotheses have defined the poles of the debate: the idea that most DLA systems are large, rotating gas disks (e.g. Schiano, Wolfe, & Chang 1990), and the idea that a large fraction of DLA absorption arises in dwarf galaxies (e.g. Tyson (1988)). The strongest empirical argument for the dwarf hypothesis is that some imaging studies reveal small galaxies near the line of sight but no clear candidates for large galaxies producing the absorption (e.g. Fontana et al. 1996; Le Brun et al. 1997; Moller & Warren 1998). The recent study of two DLA systems at and by Rao & Turnshek (1998) and Turnshek et al. (2000) places especially stringent upper limits on the luminosities of the host galaxies. The strongest argument for the rotating disk hypothesis is the analysis of metal-line kinematics in DLA systems by Prochaska & Wolfe (1997, 1998), who consider a variety of simplified models for the velocity structure of the absorbers and find that only a population of cold, rotating disks with typical circular velocities can account for the observed distribution of velocity spreads and for the high frequency of “lopsided” kinematic profiles. However, hierarchical models of galaxy formation predict that such massive disks should be rare at . In an important paper, Haehnelt, Steinmetz, & Rauch (1998) showed that hydrodynamic simulations of high-redshift galaxies could account for the lopsided kinematic profiles and large velocity spreads found by Prochaska & Wolfe (1997, 1998) even with halo circular velocities substantially below , because of large scale asymmetries and departures from dynamical equilibrium (see also Ledoux et al. (1998)). This result makes the median halo circular velocities found by Kauffmann (1996) and GKHW for the SCDM model potentially compatible with the observed metal-line kinematics. Our present simulations do not yet have enough resolution for us to repeat the Haehnelt et al. (1998) analysis; we hope to do so with future simulations to carry out a statistical comparison between results from a randomly chosen cosmological volume and the Prochaska & Wolfe (1997, 1998) data. However, we can already extend the GKHW analysis to other cosmological models, predicting the fraction of DLA absorption arising in halos of different circular velocities.
We also revisit an important issue explored by KWHM for the SCDM model, the predicted distribution of projected separations between DLA and LL systems and high-redshift galaxies. Given the number of recent attempts to directly image DLA host galaxies, our predictions will be useful in testing the compatibility of the size and probable luminosity of our simulated DLA hosts with the imaging data.
Section 2 describes the simulations and our analysis methods. Section 3 presents our analysis of the DLA and LL systems resolved by the simulations. Section 4 describes and applies our procedures for computing the contribution from unresolved halos. We discuss the implications of our results and present our conclusions in §5.
2 Simulations and Methods
2.1 The Simulations
| Name | |||||||
|---|---|---|---|---|---|---|---|
| Principle Runs: | |||||||
| SCDM | 0.7 | 1 | 0 | 0.5 | 0.05 | 1 | |
| CCDM | 1.2 | 1 | 0 | 0.5 | 0.05 | 1 | |
| OCDM | 0.75 | 0.4 | 0 | 0.65 | 0.03 | 1 | |
| LCDM | 0.8 | 0.4 | 0.6 | 0.65 | 0.03 | 0.93 | |
| TCDM | 0.54 | 1 | 0 | 0.5 | 0.05 | 0.8 | |
| Resolution Runs: | |||||||
| L64 | 0.8 | 0.4 | 0.6 | 0.65 | 0.047 | 0.95 | |
| L128 | 0.8 | 0.4 | 0.6 | 0.65 | 0.047 | 0.95 | |
Our simulations follow the same general prescription as in GKHW, where a periodic cube whose edges measure 11.11Mpc in comoving units is drawn randomly from a CDM universe and evolved to a redshift . We examine the effects of cosmology using five principal simulations detailed in the first five lines of Table 1, where is the power spectrum normalization, km s-1 Mpc-1, is the fraction of present-day closure density in matter, is the fraction in baryons, and , where is the cosmological constant. The quantity is the index of the inflationary fluctuation spectrum, with corresponding to scale-invariant fluctuations. These are the same simulations presented by Katz et al. (1999), who studied the clustering properties of the galaxies. We will often refer to the three models (SCDM, CCDM, TCDM) collectively as the “critical” models and the two models (OCDM, LCDM) as the “subcritical” models.
The five principal simulations employ gas and dark matter particles, with a gravitational softening length of 5 comoving kpc (3 comoving kpc equivalent Plummer softening, physical kpc at ). The particle masses are and for the gas and dark matter, respectively, in the critical models and and in the subcritical models. These simulations were performed using TreeSPH (Hernquist & Katz, 1989), a code that unites smoothed particle hydrodynamics (SPH; Lucy (1977); Gingold & Monaghan (1977)) with the hierarchical tree method for computing gravitational forces (Barnes & Hut, 1986; Hernquist, 1987).
The five principal simulations were done to study the effects of cosmology on DLA and LL systems. Because of uncertainties arising from resolution issues, we add to this study a further two “next-generation” simulations, L64 and L128, which were done in the same cosmology but with different mass resolutions to investigate the stability of our results with resolution. These were performed much more recently using PTreeSPH (Davé et al., 1999), a new parallelized version of TreeSPH, and their details are also given in Table 1. L64 is the same mass resolution as OCDM and LCDM, while L128 is a factor of eight greater in mass resolution (a factor of two greater spatially) and is valuable in examining absorbers in the lower-mass halos that the five principal simulations cannot resolve.
Detailed descriptions of the simulation code and the radiation physics can be found in Hernquist & Katz (1989); Katz, Weinberg, & Hernquist (1996; hereafter KWH); and Davé, Dubinski, and Hernquist (1997). We only summarize the techniques here. For both simulation codes, dark matter, stars, and gas are all represented by particles; collisionless material is influenced only by gravity, while gas is subject to gravitational forces, pressure gradients, and shocks. We include the effects of radiative cooling, assuming primordial abundances, and Compton cooling. Ionization and heat input from a UV radiation background are incorporated in the simulation. We adopt the UV background spectrum of Haardt & Madau (1996), but reduce it in intensity by a factor of two at all redshifts so that the mean Ly forest flux decrement is close to the observed value given our assumed baryon density (Croft et al., 1997). We apply small further adjustments to the background intensity during the analysis stage to precisely match the Press, Rybicki, & Schneider (1993) measurements of the mean decrement (see Croft et al. 1997 for further discussion of this procedure). For example, at , the background intensity is reduced to 20% of the Haardt & Madau value, first by 50% during the simulation, then by a further 40% during post-processing. If we adopted a higher baryon density, instead of , then the background intensity matching the observed mean decrement would be a factor higher. We use a simple prescription to turn cold, dense gas into collisionless “star” particles. The prescription and its computational implementation are described in detail by KWH. Details of the numerical parameters can be found in Katz et al. (1999).
2.2 Halo and Absorber Identification
From the simulation outputs at 3, and 2, we identify dark matter halos and the individual concentrations of cold, collapsed gas that they contain. We initially identify the halos by applying a friends-of-friends (FOF) algorithm to the combined distribution of dark matter and SPH particles, with a linking length equal to the mean interparticle separation on an isodensity contour of an isothermal sphere with an enclosed average density contrast of . Then, the position of the most bound particle in each FOF-identified halo is passed on to the spherical density method (SO; Lacey & Cole (1994)) that calculates the sphere about the most bound particle that contains an overdensity of . The halos used in our analysis are those output from SO, and the circular velocities, which we denote as , are the actual circular velocities at the radius () of each halo. This method of characterizing halo mass has been shown to be the best for computing the halo mass function (Jenkins et al., 2001).
To detect discrete regions of collapsed gas capable of producing Lyman limit and damped Ly absorption, we apply the algorithm of Stadel et al. (2001; see also KWH and http://www-hpcc.astro.washington.edu/tools/SKID) to the distribution of cold gas and star particles. SKID identifies gravitationally bound groups of particles that are associated with a common density maximum. Gas particles are only considered as potential members of a SKID group if they have a smoothed overdensity and temperature K, and we discard groups with fewer than four members (we will apply a more stringent resolution cut below). All of the gas concentrations found by this method reside within a larger friends of friends halo, even at . We match each absorber with its parent (SO) halo and discard halos that contain no absorbers. Including or excluding the “absorberless” halos in our mass function does not change the results above our resolution cutoff (explained below), since nearly all halos above our cutoff contain at least one absorber.
We calculate the HI column densities for the halos by enclosing each halo within a sphere centered on the most tightly bound gas particle and of sufficient size to contain all the gas particles that might contribute to high column density absorption within the halo. We project the gas distribution within this sphere onto a uniform grid with a cell size of 5.43 comoving kpc, equal to the highest resolution achieved anywhere in the simulation, using the same spline kernel interpolation employed by the TreeSPH code for the hydrodynamics. For the L128 run, we use a pixel size of 2.715 as the peak spatial resolution is a factor of two better in each dimension than the other simulations. Following KWHM, we calculate an initial HI column density for each grid point assuming that the gas is optically thin, then apply a self-shielding correction to yield a true HI column density (see KWHM for details). For each halo we compute the projected area over which it produces damped absorption, with , and Lyman limit absorption, with . For simplicity, we project all halos from a single direction, although we obtain a similar fit of absorption area to circular velocity (see below) if we project randomly in the , , and directions or average the projections in , , and . Projecting a rectangular prism instead of a sphere yields the same results. To test for convergence, we reprojected several halos at 2 and 4 times smaller grid spacings and found that the cross section for DLA and LL absorption changed by less than 1% in the majority of cases and by at most 2.5%.
2.3 Numerical Resolution Considerations
Our five principal simulations, which each contain gas and dark matter particles, lack the dynamic range needed to model simultaneously the full mass range of objects that can contribute to DLA and LL absorption. Simulations by QKE and GKHW show that halos with circular velocities as low as can host DLA absorbers, while photoionized gas is unable to collapse and cool in smaller halos. However, if we adopted a particle mass low enough to resolve halos while retaining the same particle number, then our simulation volume would be too small to include a representative sample of more massive halos.
In our analysis of the simulation results, we find that halos consisting of at least 60 dark matter particles nearly always (more than 98% of the time) contain a cold, dense gas concentration. Below this threshold, however, a substantial fraction of halos have no cold gas concentration. Furthermore, in our bootstrap analysis of the variance in the relation between halo and absorption cross-section, described in §4.1 below, we find much larger scatter about the mean relation for halos with fewer than 60 dark matter particles than for halos with more than 60 dark matter particles.
To safeguard against additional systematic effects near the resolution boundary, we compare the high-resolution L128 run to L64. We find that the mass cut of also allows the L64 halo properties to match smoothly with same mass halos in L128. Near perfect agreement for DLAs (cf. Figure 7 and later discussion) is found with a mass corresponding to 70 particles. So to be as conservative as possible, we adopt as an estimate of the limiting mass below which we cannot accurately compute the amount of absorption in a simulated halo. The 70 particle criterion is more conservative than the 34 particle criterion that we adopted in GKHW, and this change will affect our predictions for absorption in lower mass halos in §4 below.
Applying this same mass cut to the L128 run, we find the limiting resolution to be roughly at , which is unfortunately still above the mass at which halos cease to host DLA and LL absorption. Consequently, even the increased dynamic range of L128 does not allow us to model all absorbers.
In the critical density models, the mass resolution limit is , corresponding to a circular velocity at the virial radius of , 160, and at , 3, and 4, respectively. In the subcritical models, , corresponding to , 100, and at 3, 4. In L128, the mass resolution is a factor of eight better, hence and at . For our statistical analyses of the simulation results below, we always eliminate absorbers in halos whose total mass (dark matter plus baryons, with the spherical overdensity mass definition given above) is . Our quoted results apply only to halos above the resolution limit. In §4 we attempt to compute, as a function of , the contribution of halos with to the total amount of DLA and LL absorption by combining the Jenkins et al. (2001) mass function with our numerical results.
We assume throughout our subsequent analysis and discussion that our results for absorption in halos with are only minimally influenced by the residual effects of finite numerical resolution. We give evidence in §4 from the L128 run that the five principal runs are not influenced by resolution effects within a factor of 10 of their resolution cutoff. However, real absorption systems could have substructure that produces large fluctuations in HI column density on scales far below resolution limit of even our highest resolution simulation. In this scenario, the total amount of neutral gas in absorption systems would not be very different from our predictions, except to the extent that clumping shifts gas above or below the DLA/LL column density thresholds, but the distribution of column densities above the thresholds could be quite different. This issue will be difficult to address by direct numerical simulation alone because of the large range of scales involved. However, good agreement between predicted and observed column density distributions would support the contention that the absorbers do not have a great deal of substructure on scales below the simulation resolution limits. KWHM find good agreement between the predicted and observed shape of the column density distribution in the DLA regime, but a compelling case along these lines will require simulations that do resolve the full mass range of objects responsible for damped absorption, and which accurately resolve the low-end cutoff where halos cease to contain such absorption.
3 Simulation Results
3.1 Absorption in Collapsed Objects
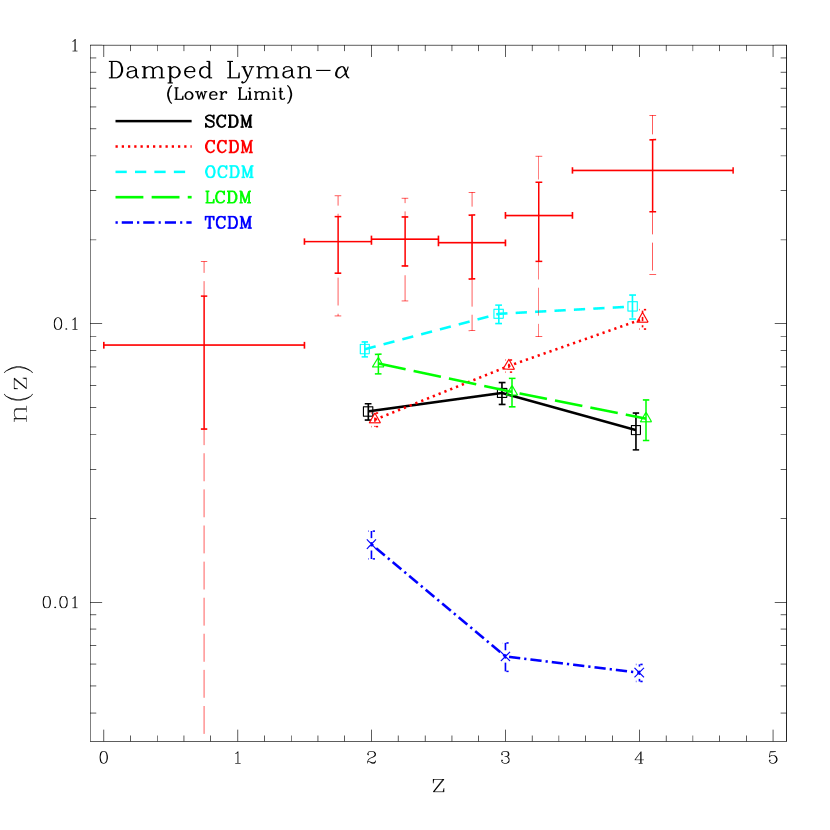
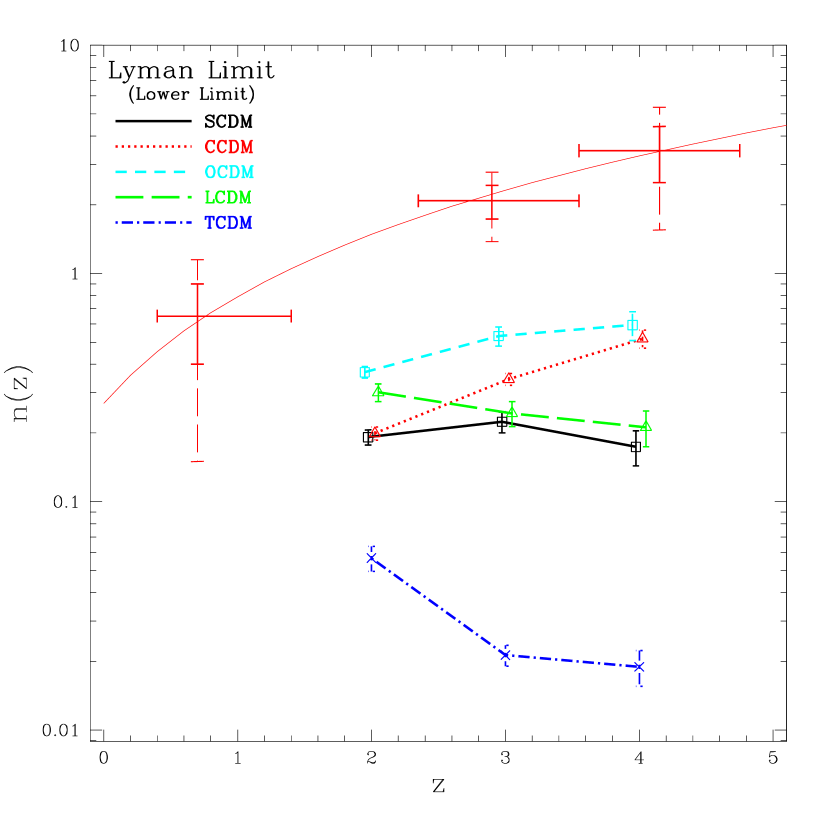
Figures 1 and 2 show the incidence of DLA and LL absorption in our five cosmological models: is the mean number of absorbers intercepted per unit redshift above the DLA (Fig. 1) or LL (Fig. 2) column density threshold. The numerical results for halos above the mass resolution limit are shown at 3, and 4. Observational results for DLA absorption are taken from Storrie-Lombardi & Wolfe (2000; cf. also Storrie-Lombardi, Irwin, & McMahon 1996a; Wolfe et al. 1995) and for LL absorption from Storrie-Lombardi et al. (1994). When comparing the subcritical models to the critical models, note that the subcritical models have lower and therefore sample the distribution of absorbers down to a lower mass cutoff, boosting the prediction relative to that of the critical models. Taken directly from the simulations and from halos only above , the values in these plots are hard lower limits to the predicted . The limiting circular velocities are below the value inferred by Prochaska & Wolfe (1997, 1998) for typical DLA circular velocities based on a rotating disk model for metal-line kinematics, and even so the predicted number of DLA absorbers is usually a factor of two or more below the observed value. We conclude that if the inflationary CDM models considered here are even approximately correct, then the asymmetries and large velocity spreads found by Prochaska & Wolfe must be a result of complex geometry and non-equilibrium dynamics, as proposed by Haehnelt et al. (1998).

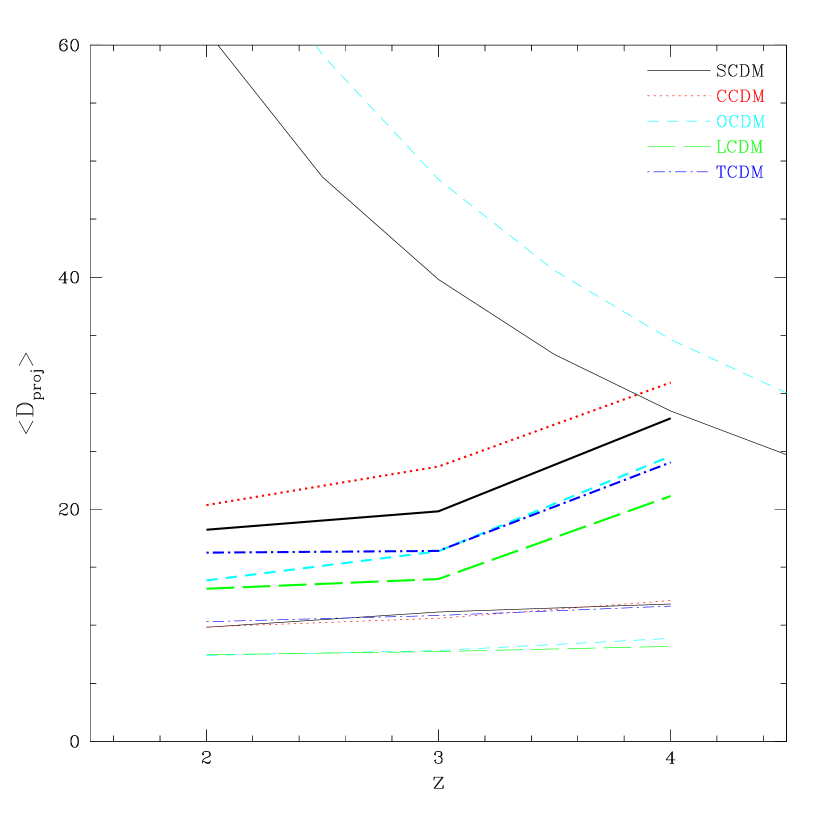
Figure 3 shows the distribution of impact parameters , in physical units, between high column density absorbers and the centers of neighboring galaxies. Specifically, the contour level represents the percentage of lines of sight of a given for which the closest simulated galaxy, in projection, lies within a projected distance . Note that in this figure and in subsequent figures we represent distance in kpc and not kpc. Nearly all of the high column density systems in our simulations are associated with a galaxy, with the highest column density systems sampling the innermost regions of the galaxy and the lower column density systems occurring at larger impact parameters. At , nearly all DLA systems lie within 15-20 kpc of a galaxy center, and nearly all LL systems lie within 30 kpc. At higher redshifts, the most likely impact parameter increases, which could indicate a physical contraction of DLA systems as they age or could alternatively reflect the higher neutral fraction associated with a given overdensity at higher redshift (similar to the interpretation of evolution of the low column density forest given by Hernquist et al. (1996) and Davé et al. (1999)). This increase can easily be seen in Figure 4, which plots the mean impact parameter for systems at the DLA and LL cutoff and compares them with the virial radius of a halo. The mass, and therefore size, of an isothermal sphere with a given circular velocity goes as . Not only does the mean absorption cross section increase at redshift , but the size of the parent halos decreases, meaning that at the fraction of the area of the halo subtended by DLA and especially LL absorption is much larger than at . We will further examine absorber area vs. halo virial radius in Section 4.1.
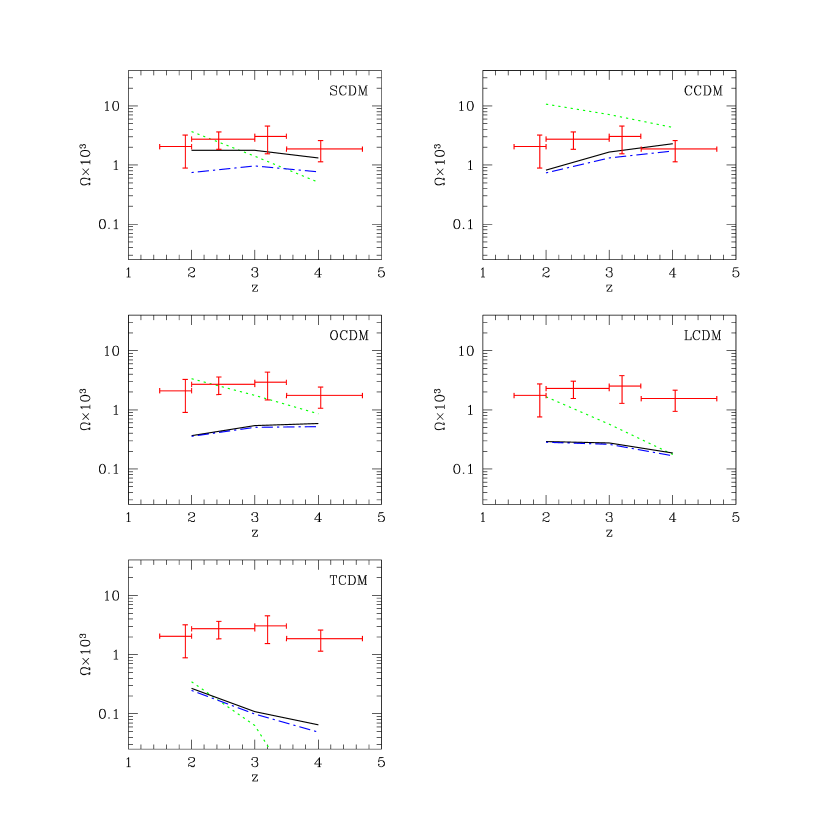
Figure 5 shows the fraction of critical density in cold collapsed gas, (solid line), and the fraction of the critical density in stars, (dotted line), as a function of redshift in the various cosmological models. In subcritical models, we define , i.e., represents the comoving density of component relative to the critical density at . We obtain by integrating the column density distribution for all of the halos in the simulation. Error crosses show the values derived by Storrie-Lombardi, McMahon, & Irwin (1996b) from a sample of DLA systems. The largest observed column density for DLA systems in the Storrie-Lombardi et al. (1996ab) sample is cm-2, probably because higher column density systems are too rare to have been detected. For a more direct comparison to the data, we therefore compute an “observational” value, , for which we only count gas along lines of sight with . The contribution to from higher column density systems is generally small, but it is significant in the SCDM model. In all cases, we include only gas in halos with .
For all the models in Figure 5, increases steadily as the Universe evolves. However, remains constant to within a factor of two from redshift 4 down to redshift 2, indicating that additional gas cools and collapses to replace the gas that is turned into stars. Gas reaches higher densities in the the SCDM and CCDM models, leading to a larger difference between and . In nearly all cases, our “observed” cold gas densities fall at least a factor of two below the observational data of Storrie-Lombardi et al. (1996b), which could themselves be underestimates of the true cosmological values of if dust extinction is important (Pei & Fall, 1995). If any of these models are to be viable, a substantial fraction of the high redshift HI must reside in systems below our resolution limit, an issue to which we turn in §4.
To obtain the simulation values of in Figure 5, we had to alter the procedure described in §2.2 for computing HI column densities. While our standard grid spacing of 5.43 comoving kpc is sufficient to resolve objects with HI columns of cm-2 and lower, a finer mesh is required to resolve the cold dense knots of gas at higher column densities, which contribute significantly to the integral. As described in KWHM, we generate the initial HI map assuming complete transparency, then use the mass, HI mass fraction, and temperature of each grid cell to correct the HI column density for its ability to shield itself from the surrounding radiation. Typically, a high column density grid cell contains some regions where the hydrogen should be partly ionized and some where it should be completely neutral owing to self-shielding effects. At the standard resolution of 5.43 comoving kpc, our procedure may average the contributions of these two regions before the self-shielding correction is applied, resulting in a lower neutral column density than if the identical correction procedure were applied with a smaller grid spacing. This effect is not important for computing , the number of systems with above the DLA cutoff, but it can be important for computing the total mass density of neutral gas, . We examined the effect by reprojecting some of the halos at z=2,3,4 in the SCDM model at 2 and 4 times the original spatial resolution. The original resolution of 5.43 kpc underpredicts the total HI in the simulation, while the cold collapsed gas mass in the 2X and 4X cases is nearly identical. Consequently, we regard the 2X case as numerically converged.
Unfortunately, reprojecting all the simulation outputs at this higher resolution is not computationally feasible. We therefore developed an approximate procedure based on the original grid spacing, calibrated against the few higher resolution SCDM projections. In grid cells where the self-shielding corrected HI column is greater than a threshold value , we treat as fully neutral all gas particles that contribute to that grid cell and meet the following criteria: temperature K and gas density , where is the virialization overdensity described in §2.2. For critical models, the density cut corresponds to . In subcritical models, the density cut occurs at the same fraction of the critical density as in the models. We find that for at this procedure reproduces the SCDM high resolution values for and to within 10%.
3.2 Other Possible Sources of Absorption
It is possible that some Lyman limit and/or DLA absorption originates from regions other than galactic halos. To investigate this alternative within our simulations, we project the entire simulation volume and compare the area of LL and DLA absorption to the sum of the absorption calculated by projecting each halo individually. In the analysis presented here, we use all halos that have at least one group identified by SKID as described in §2.2 (i.e. at least one concentration of cold gas that is gravitationally bound), whether or not the halo itself has . Above , 98% of the dark matter halos harbor at least one SKID-identified group.
We have removed TCDM from the analysis in this section due to the extreme paucity of structure in the model. For the remaining four models, we calculate the total area subtended by DLA absorption in the halos with SKID-identified groups. Comparing this value to the total area subtended in an entire volume projection of each simulation at redshifts and , we find agreement within 4.5% for all the models at both redshifts, and to better than 2% in five of the eight cases. We attribute the remaining differences to having more than one absorber along a given line of sight. Hence, all DLA absorption in the simulation occurs within halos with at least one concentration of cold, gravitationally-bound gas.
In LL absorption, five of the eight outputs agree to better than 6% when compared in this manner. However, at the results of volume projection and halo projection differed by 15%, 30%, and 13% for SCDM, CCDM, and OCDM respectively. We took the worst case, CCDM, and projected all the halos that contained at least 32 particles (gas dark matter), whether or not they contained a SKID-identified gas concentration. When we sum the area subtended by LL absorption in these halos, we find that it now accounts for all but 1.2% of the LL absorption found by projecting the entire volume. Hence Lyman limit absorption still occurs exclusively in halos, but in this instance 30% of it occurs in halos in which our resolution of gas dynamics and cooling is only marginal and in which there are no SKID-identified gas concentrations. If our study had higher resolution, it is likely that some of these halos would have been able to form DLA systems as well. However, it is just to correct for these unresolved or under-resolved halos that we developed our Press-Schechter correction technique. The important conclusion is that all the Lyman limit absorption we find in the simulations resides within dark matter halos. If Lyman limit absorption were to occur outside galactic halos, it would have to be in regions that are much too small for us to resolve.
To summarize, all DLA and LL absorption in our simulations occurs in dynamically bound dark matter halos, even below our resolution cutoff. At and , in all four of the models tested, DLA absorption arises entirely in objects identified by SKID as bound concentrations of cold gas. LL absorption in the simulations also occurs exclusively in dark matter halos, although at some of the gas within these halos is able to reach LL column densities without becoming a SKID-identified concentration.
4 DLA and LL Absorption by Low Mass Halos
4.1 Motivation from Higher Resolution Simulation
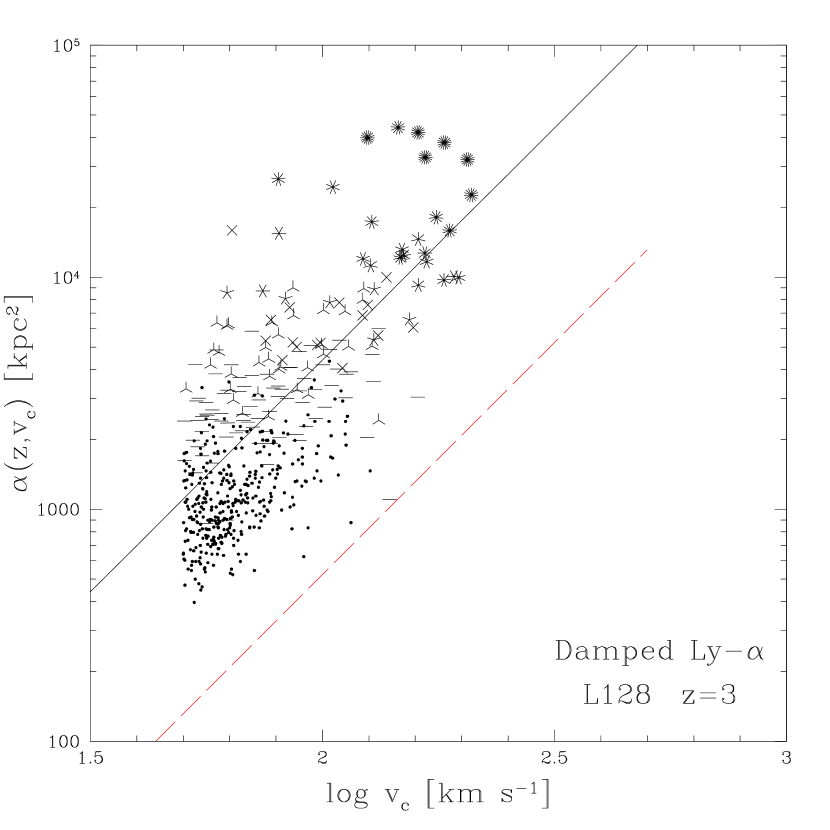
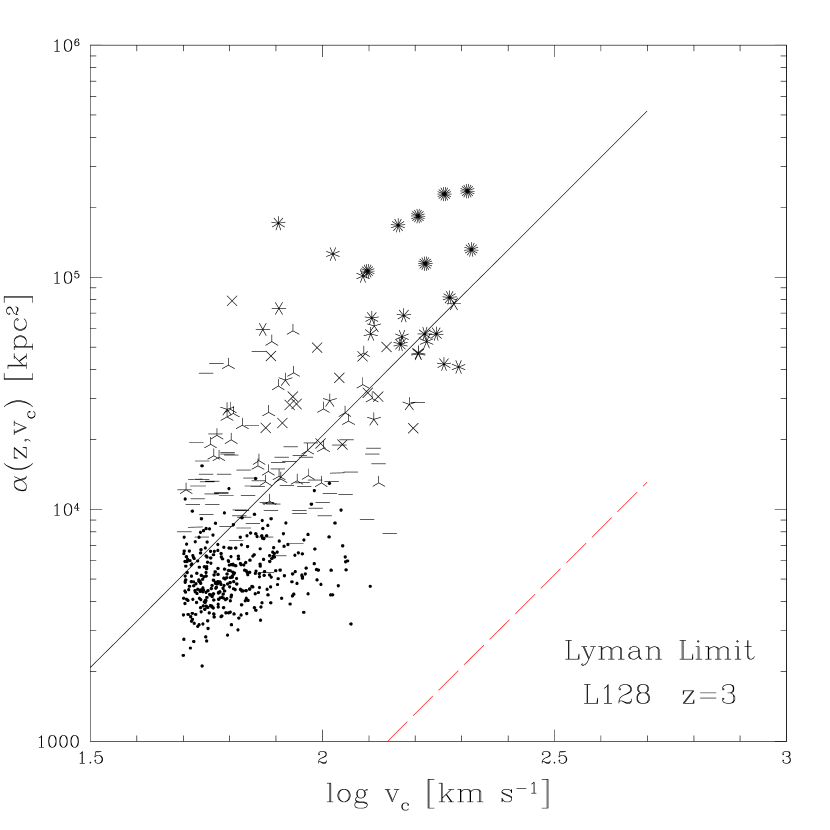
We have so far focused on DLA and LL absorption in halos above our simulation mass resolution limits . However, if we want to test cosmological models against the observed incidence , we must also consider the absorption that arises in lower mass halos, which are smaller in cross section but much more numerous. The L128 run is a factor of eight finer in mass resolution than the other simulations in this study, allowing us to examine trends in DLA and LL systems to lower masses. Figure 6 compares, at , the circular velocity at of the halos in L128 with the cross section subtended by DLA absorption (left panel) and LL absorption (right panel) when the halo is projected. The number of vertices on each point indicates the number of SKID-identified concentrations of cold collapsed gas within the halo. We can see that the absorption characteristics of galactic halos are not well approximated by assuming a single galaxy per halo. Instead, the correlation of absorption cross section with halo mass seems to arise not from a single galaxy in each halo becoming larger as its parent halos increases in mass, but rather from more massive halos harboring more galaxies. Consequently, the multiple-absorber nature of halos is extremely important in modeling the connection between halo mass and absorption cross section. To approach the problem semi-analytically, it is necessary to model the full interaction history of the halos, as is done in Maller et al. (2000). The absorption cross sections of the individual galaxies is virtually independent of halo mass. If any trend exists, it appears that in halos containing only one galaxy may actually decrease slightly in more massive halos. Higher mass halos have deeper potential wells, causing the concentrations of cold gas to contract more efficiently. This complex gas dynamical behavior demonstrates the value of a fully numerical treatment in modeling these objects.
The dashed lines in Figure 6 show the area subtended by a face-on disk of radius where is the virial radius of an isothermal sphere with circular velocity at the virial radius. 10% of the virial radius is the typical extent of a galaxy based on centrifugal arguments. The solid line in Figure 6 left (DLA) panel shows the area subtended by a face-on disk of radius , while in the right panel it denotes area . Although the solid lines were not fit to the data, one can see that the general trend of DLA and LL absorption is that the cross-section is roughly described as proportional to and respectively.
4.2 Testing Extrapolations to Lower Mass Halos
We would like to be able to extrapolate the contribution to the total incidence by halos with . Given the results from Section 4.1, it is plausible to assume a power law fitting function . QKE find that a photoionizing background suppresses the collapse and cooling of gas in halos with circular velocities km s-1. Thoul & Weinberg (1996) find a similar cutoff in simulations that are much higher resolution but assume spherical symmetry. As discussed in §2.1, is approximately km s-1 in the critical models and km s-1 in the subcritical models at for the five principal runs. In L128, which has a resolution limit of km s-1, we find no evidence of a photoionization cutoff; simulations with better mass resolution are required to detect it. For the dependence we find for resolved halos in our simulations, low mass halos dominate the total cross-section for DLA and LL absorption. Therefore, the predicted incidence depends sensitively on the assumed value of .
Since we cannot robustly predict without exact knowledge of , we adopt the less ambitious goal of determining, for each cosmological model, what value of yields a good match to the observed values of . Our approach to this calculation is similar to that of GKHW: we use our numerical simulations to calibrate a fit to the mean cross section for DLA (or LL) absorption of halos with circular velocity at redshift , then integrate over an analytic halo mass function to compute .
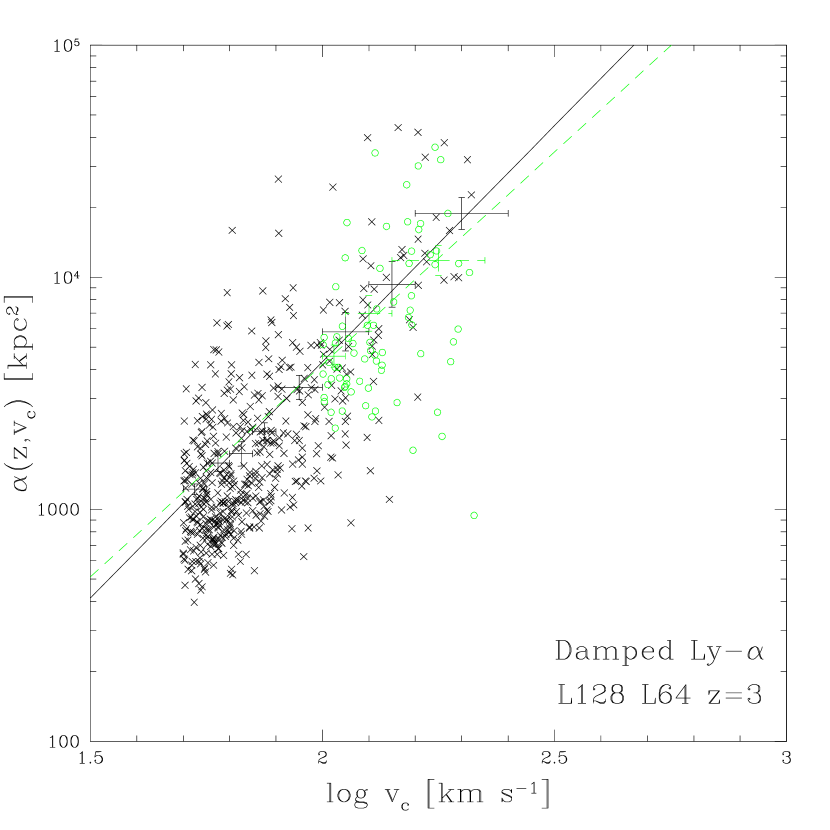
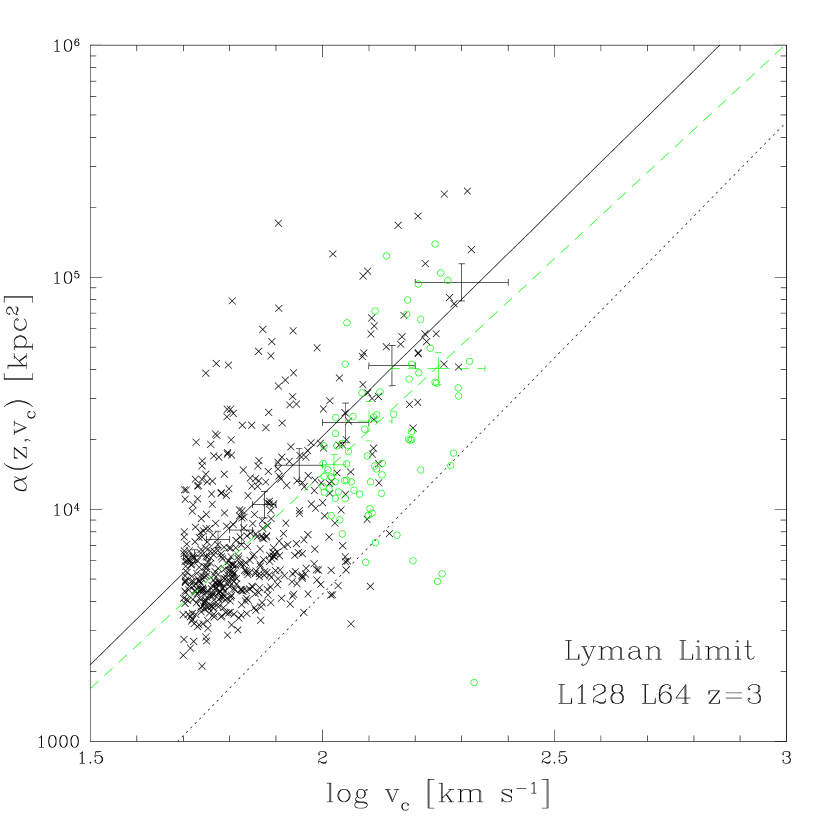
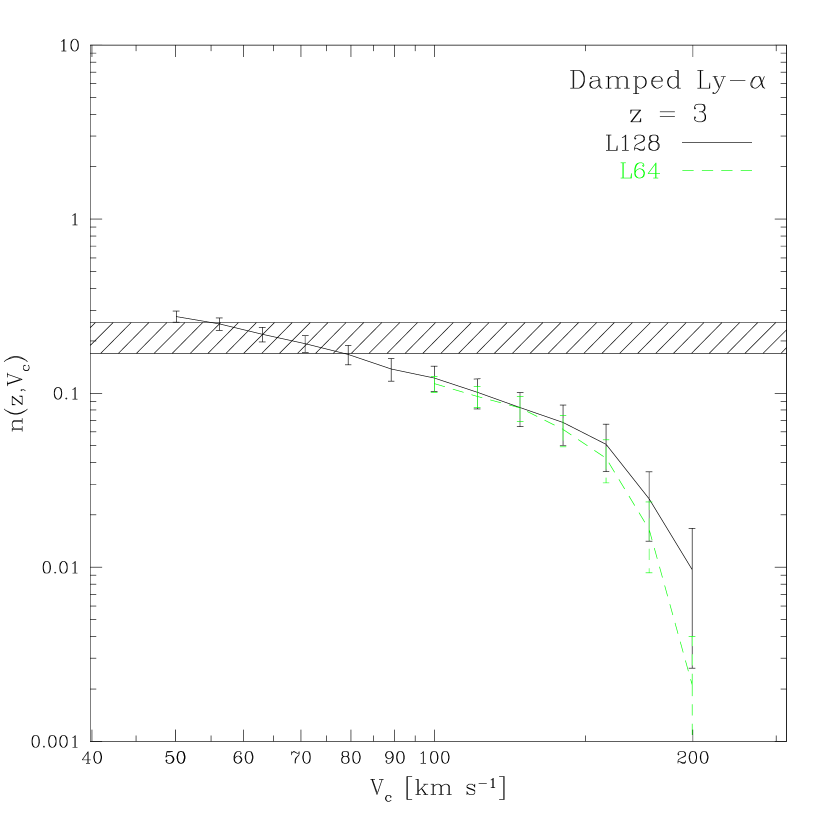
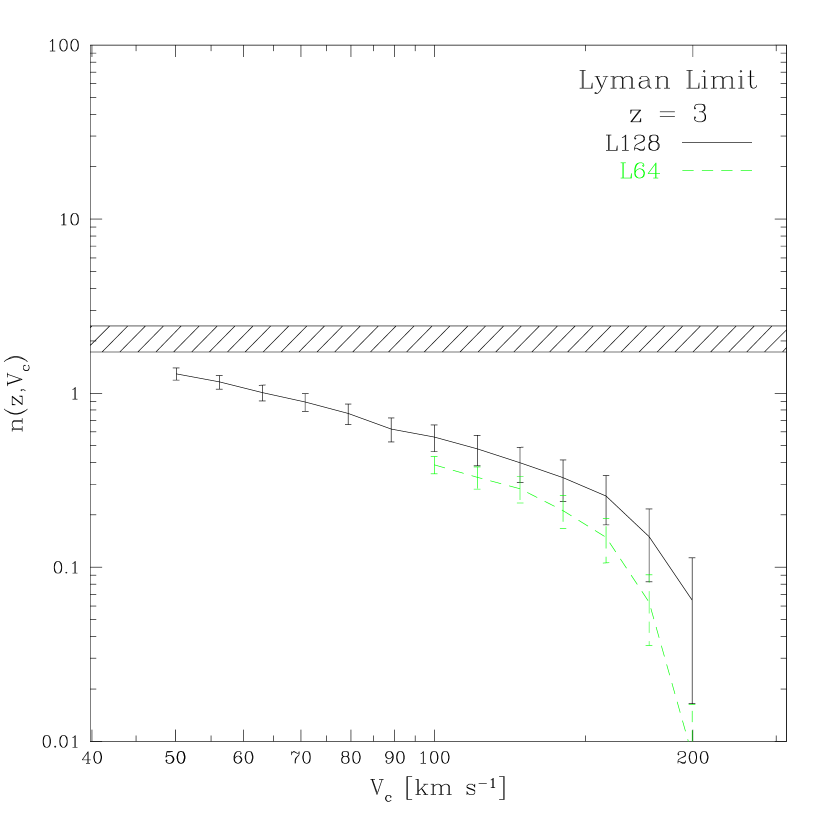
Figure 7 compares in the L128 and L64 simulations at redshift . Figure 8 compares the cumulative incidence , the total incidence from absorbers in halos at least at massive as , in L128 and L64. Note that in this Figure, the incidence is measured directly from the simulations and not by convolving an analytic mass function with as is done later in this section. The runs were performed using the same cosmology but a factor of eight different mass resolution. In the absence of systematic resolution effects that may exist above our cutoff , the data from the L64 simulations should smoothly overlap with L128 above the L64 value. For the DLA case, although L64 appears to have more low-mass outliers than L128, the simulations agree quite well both in and incidence. In the LL case, however, we find that the we systematically underestimate the absorption cross section of LL absorbers in L64 by roughly 25%. This leads to the cumulative incidence of the L64 simulation also being 25% less than the same in L128. Therefore, at the L64 resolution we are not resolving all LL absorption regions that exist inside halos with . One possibility is that areas whose average HI column density is slightly below the LL cutoff () on kpc scales have smaller, patchy clumps with higher column density. Hence, the lower resolution simulations would systematically underestimate the LL absoption in these regions. For DLA absorption, however, we detect no signatures of numerical resolution artifacts.
To find the best fitting function for absorption cross section, we bin halos in 0.05 dex increments in , beginning with and subject to the constraint that there be at least 10 halos in each bin. We sometimes are forced to widen the bin size to satisfy the latter constraint. Let denote the “cross section” of DLA absorption, i.e. the comoving area subtended by HI column densities when a halo is projected onto a plane. For the binned distribution of halos, we determine the log of the average halo DLA absorption cross section, for each bin. Then we calculate the statistical uncertainty of in each bin by using the bootstrap method with 1000 random realizations of the data set of halos with . The distribution of halo cross sections at a given is approximately log-normal and hence best described by a Gaussian in log space. Since we will use the bootstrap errors in the next section to calculate confidence limits, which assume Gaussianity, we express the errors in log space. We fit the points by linear least squares to determine the parameters and , the amplitude and index for the power law fitting function . The error crosses in Figure 7 show the mean absorption cross section in each bin of circular velocity at redshifts for DLA and LL systems. The horizontal error bars show the width of each bin, and the vertical error bars show the logarithmic uncertainty in for the bin determined by the bootstrap procedure. The solid error crosses are for L128 data and dashed error crosses for L64. The solid and dashed lines denotes the best fit to the L128 and L64 data respectively. For DLA systems, the fit to the L64 data is nearly identical to the L128 fit, showing that data at the resolution of the principal runs can be used reliably to estimate the absorption cross section below their resolution cutoff. The LL fit is systematically lower, reflecting the mismatch between L128 and L64 halo absorption. However, the two lines parallel each other meaning that the fitting procedure is robust and allows an accurate extrapolation to lower halo masses.
It is important to note that we are not seeking to model the distribution of absorption cross sections in each bin, but only to characterize the mean cross section in each bin so that the total absorption can be accurately reconstructed from equation (1) below. The large spread and asymmetry in the distribution of absorption cross sections for individual halos is inconsequential for our purposes: is the number which, when multiplied by the halo number density at , yields the total absorption at that that matches the total absorption present in the simulation. The bootstrap technique yields a robust estimate of the statistical uncertainty in this mean cross section caused by the finite number of halos in the simulation. Although the spread in absorption cross sections of individual halos may be large, their average absorption is a well determined quantity.
4.3 Results
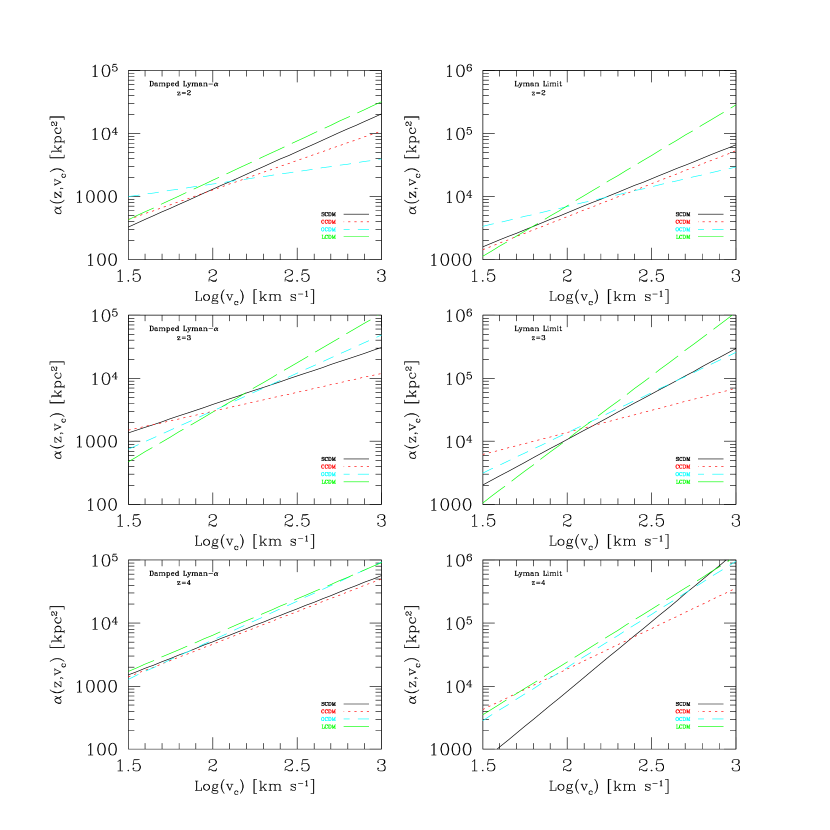
Figure 9 shows the fitted relation for each of 4 cosmologies and redshifts . Again we have removed TCDM from the analysis in this section due to the extreme paucity of structure in the model. Given so few halos above the mass limit, we felt it useless to attempt to fit to the data. The values of the fit parameters are detailed in Table 2. At , the fits for each model tend to follow the same slope (the exception being LL SCDM). At later redshifts, evolves differently for different models. In general, LCDM tends to be among the steepest in all cosmologies. Interestingly, this steepness is not paralleled by OCDM at where the cross-sections of the more massive halos in OCDM have decreased markedly. CCDM tends to be flatter than SCDM — the increased amplitude of structure apparently results in halos having smaller gas cross-sections. It is difficult to draw any general conclusions about the behavior of high column density absorbers in critical models vs. subcritical models, except that LCDM tends to have the highest cross-sections in massive halos.
We are now in a position to correct the estimates from §3 to include the contribution from halos with . Our approach to this problem is similar to that of GKHW, though there are important differences of detail that make a significant difference to the end results, as we discuss later. We compute the number density of halos as a function of mass at specified redshift using the mass function of Jenkins et al. (2001; see their equation 9). Multiplying by our numerically calibrated functions , and integrating from to infinity, yields the number of DLA (LL) absorbers per unit redshift residing in halos of circular velocity greater than :
| (1) |
where is the circular velocity at , the radius, of a halo of mass , and is comoving distance (see GKHW for detailed discussion). If one takes the lower limit of the integral to be , the minimum circular velocity for gas cooling and condensation, this yields , the total incidence of DLA (or LL) absorption at redshift .
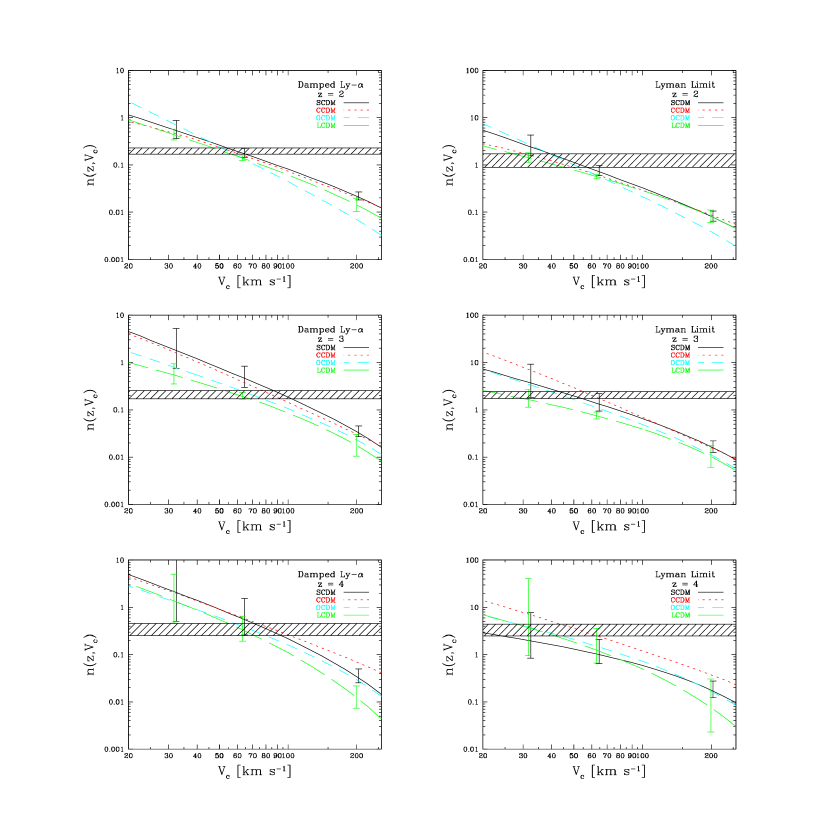
Figure 10 shows the results of this exercise. The curves show the cumulative incidence as a function of for redshifts . The error bars for SCDM and LCDM are shown at three representative locations and show the error region resulting from the bootstrap uncertainty in the fits for . It comforting to note that the curve for LCDM, which is closest to the cosmology of L64 and L128, does indeed mirror the simulated shown in Figure 8. The cross-hatched region of Figure 10 denotes the range allowed observationally by Storrie-Lombardi & Wolfe (2000; DLA) and Storrie-Lombardi et al. (1994; LL). To match DLA observations, contributions from halos with are required. In the LL case, the minimum halo circular velocity is somewhat lower, more in the range of , although given the results from Figure 7, the estimate of may be depressed by . Raising by this amount would actually bring the minimum LL-harboring halo mass in line with the DLA estimate for most models. On the other hand, it is possible that LL absorbers could reside in halos of lower mass than DLAs.
The results show that although halos in models like LCDM generally have higher absorption cross sections, the increased number density of halos in the critical models tends to give them more total absorption than the subcritical models. Although their values are close to that of SCDM (Table 1), and the growth factor reduction from to is smaller in subcritical models, OCDM and LCDM also have redder power spectra and thus less power on these relatively small scales. The difference in power spectrum shape is especially important at the low-mass end of the mass function.
| Damped Ly | ||||||
| Model | B | log A | B | log A | B | log A |
| SCDM | 1.196 | 0.722 | 0.904 | 1.777 | 1.049 | 1.605 |
| CCDM | 0.936 | 1.232 | 0.601 | 2.275 | 1.036 | 1.594 |
| OCDM | 0.398 | 2.403 | 1.207 | 1.067 | 1.238 | 1.254 |
| LCDM | 1.247 | 0.764 | 1.569 | 0.325 | 1.151 | 1.508 |
| Lyman Limit | ||||||
| Model | B | log A | B | log A | B | log A |
| SCDM | 1.079 | 1.585 | 1.443 | 1.144 | 2.213 | -0.508 |
| CCDM | 1.045 | 1.591 | 0.702 | 2.737 | 1.285 | 1.702 |
| OCDM | 0.628 | 2.585 | 1.277 | 1.582 | 1.685 | 0.928 |
| LCDM | 1.601 | 0.649 | 2.015 | 0.003 | 1.675 | 1.034 |
5 Conclusions
We can divide our conclusions into two classes, those that rely only on the results of our simulations, and those that rely on our extrapolation of these results via the Press-Schechter method (with Jenkins et al. 2001 mass function) to account for absorption by low mass halos. We will treat these two classes of conclusions in turn.
5.1 Simulation Results
Our five principal simulations resolve the formation of cold, dense gas concentrations in halos with 160, (89, 100, ) at 3, 4 in the critical density (subcritical) models. We employ a further 2 simulations done in identical cosmologies but with a factor of eight difference in mass resolution to examine resolution effects. The lower resolution run, L64, is the same resolution as the five principal simulations and has equivalent to the subcritical (OCDM and LCDM) models. The higher resolution run, L128, has . Our clearest conclusion is that absorption in halos above the circular velocity thresholds of the simulations cannot account for the observed incidence of DLA or LL absorption or for the amount of cold, collapsed gas, , in observed DLA systems, for any of our five cosmological models (Figures 1, 2, 5). Higher resolution simulations are unlikely to change this conclusion, since clumping of the gas on scales below our gravitational softening length would tend to reduce the absorption cross section rather than increase it, unless this small scale clumping could produce neutral condensations in the outskirts of halos where we predict the gas to be mostly ionized. The evidence from L128 indicates that there are no resolution effects above that affect DLA systems, although estimates of LL incidence in halos may be underestimated by 25% in the principal simulations.
Our models assume , and a higher baryon abundance (e.g. Burles & Tytler 1998ab) might increase the predicted absorption. We have investigated SCDM models with different values and find that higher leads to more absorption per halo as expected, but even a model with has too little absorption at this circular velocity threshold to match the observations. We will report further results from this study in a future paper.
If any of these cosmological models is correct, then a substantial fraction of high redshift DLA absorption must arise in halos with . This conclusion appears consistent with the imaging of DLA fields, which often reveals no large, bright galaxies near the line of sight (Fontana et al., 1996; Le Brun et al., 1997; Moller & Warren, 1998; Rao & Turnshek, 1998; Turnshek et al., 2000). However, it implies that the asymmetric metal-line profiles found by Prochaska & Wolfe (1997, 1998) must be interpreted as a signature of non-equilibrium dynamics (Haehnelt et al., 1998) rather than smooth rotation.
We find a clear and intuitively sensible relationship between high HI column density absorption and the proximity to galaxies (Figure 3). Damped systems typically lie within 10-15 kpc of the center of a host galaxy at , while lower column densities near the Lyman limit regime typically occur farther from the host galaxy. All DLA and LL absorption in our simulation occurs within collapsed dark matter halos. If it were to occur outside halos in the actual Universe, it would have to be on size scales smaller than we resolve.
The stellar mass in our simulation is generally a steep function of time in the redshift range , corresponding to a power law in (Figure 5). The mass in cold collapsed gas, however, remains relatively fixed, indicating that the rate at which gas is converted into stars is roughly equal to the rate at which new gas cools out of ionized halos and condenses into galaxies. This result is expected if the star formation rate is an increasing function of gas density, as it is in our numerical formulation (KWH).
In the first 3-d hydrodynamic study of high column density absorption, KWHM found that the predictions of from their simulations of the SCDM model fell a factor of two short of the observed DLA abundance but a factor of ten short of the observed LL abundance. They speculated that the DLA shortfall could be made up by absorption in lower mass halos but that the LL shortfall might imply a distinct physical mechanism for the formation of LL systems, such as thermal instability on mass scales far below the simulation’s resolution limits (Mo & Miralda-Escudé, 1996). It appears, however, that for the resolution of the KWHM runs and the principal simulations presented here, LL absorption at simulation scales may not have converged. If the resolution is increased by a factor of eight (as in the L128 run), LL absorption in halos over the same range in mass increases by 33%. This suggests the possibility that standard cosmological models can explain the observed LL systems with the physical processes that already occur in these simulations, albeit in halos somewhat below our current resolution limits. Thus LL and DLA absorption are closely related rather than physically distinct phenomena, with LL absorption arising preferentially at larger galactocentric distances and in less massive halos. We find no evidence in the simulations of LL absorption outside of galaxy dark matter halos.
5.2 Absorption in Low Mass Halos
In our simulations, the halo absorption cross sections are determined by complex and competing physical processes. If we consider only halos that contain a single gas concentration, then the absorption cross section can actually decrease slightly with increasing circular velocity (solid points in Figure 7). However, more massive halos are more likely to contain multiple gas concentrations, with the net effect that increases with increasing . At , the model with the weakest mass fluctuations (LCDM) tends to have high (Figure 10). This fact, and the trend for single-absorber halos, imply that DLA and LL absorption cross sections are substantially affected by non-equilibrium dynamics: absorbers get smaller if they have time to cool and condense in a quiescent dark matter potential well. Although others have argued that this behavior may be a numerical artifact (cf. Maller et al. 2000), the agreement between our L64 and L128 runs and the appearance of the same trend in L128 suggests that it is not. Consequently, we suspect that this non-equilibrium behavior is a real feature of DLA and LL systems, possibly the geometric counterpart to the complex kinematic behavior found by Haehnelt et al. (1998). The physical complexity of implies that an accurate fully analytic description of high column density absorption in CDM models will be difficult to achieve. Even the simple expectation that more small scale power produces a higher incidence of DLA and LL absorption does not always hold.
In the L64 and L128 runs, for which DLA results agree well in the mass regime of overlap, the mean cross-section for DLA absorption is , much larger than the simple estimate based on collapse of the baryons to a centrifugally supported disk. For LL absorption, where we find that absorption in equal-mass halos is 25% lower in L64 than in L128 (which has a factor of eight finer mass resolution), the cross sections in L128 are described by .
To estimate the amount of absorption in halos below the resolution limits of our simulations, we adopted a procedure similar to that of GKHW, using the numerical results to calibrate and the Jenkins et al. (2001) mass function to compute the halo abundance. However, relative to GKHW we employed a much more conservative estimate of and an improved error estimation procedure based on bootstrap analysis instead of Poisson errors. These changes lead to superior fits that generally increase the predicted amount of absorption in halos with . Our new results for in the SCDM model supersede those of GKHW, since our new procedures are certainly an improvement, and our results for in other models supersede those of GKWH, since in addition to these technical improvements we now have numerical simulations of these other models to constrain for . The bootstrap procedure yields believable statistical uncertainties in the predictions.
Taking our results and error estimates at face value, we find that four of the cosmological models that we consider are compatible with observational estimates of the incidence of DLA and LL absorption at 3, and 4. What hinders us in better quantifying the total incidence in the Universe is our uncertainly in the estimate of the , the circular velocity at which halos cease to harbor high column density systems. Previous studies (QKE; Thoul & Weinberg 1996) have found this cutoff to be approximately 40 km s-1. However, due to the extreme number density of halos at this mass, a slight uncertainty in this cutoff results in huge uncertainties in estimating the total incidence in DLA and LL systems. Instead we determine, for each cosmology, the value of that best matches observations. Reproducing the data of Storrie-Lombardi & Wolfe (2000) and Storrie-Lombardi et al. (1994) requires for DLA systems and for LL systems, with some dependence on cosmology and redshift (see Fig. 10).
Since the DLA values of are above the expected threshold caused by photoionization, there is some risk that all of these models would predict too much DLA absorption in simulations that fully resolved the population of absorbing systems. A model with somewhat less small scale power, such as the lower amplitude LCDM model favored by recent Ly forest studies (McDonald et al., 2000; Croft et al., 2001), might fare better in this regard, perhaps matching the observed DLA abundance with a closer to the expected photoionization value. We are unable to make predictions for total absorption in the TCDM model with our current simulations because the paucity of structure above our resolution threshold makes our extrapolation procedure unreliable.
Our current simulations provide a number of insights into the physics of DLA and LL absorption in halos with . Unfortunately, they also imply that robust numerical predictions of the incidence of high-redshift DLA and LL absorption will require simulations that resolve gas dynamics and cooling in halos with , where our analytic modeling predicts a large fraction of the high column density absorption to occur. Simulations that resolve such halos exist (e.g. QKE; Navarro & Steinmetz 1997), but they do not yet model large enough volumes to predict statistical quantities like . Achieving the necessary combination of resolution and volume is challenging but within reach of current computational techniques. Simulations that meet these requirements will also teach us a great deal about the internal structure of more massive DLA and LL systems and about the connection between these systems and the population of high redshift galaxies.
References
- Barnes & Hut (1986) Barnes, J.E. & Hut, P. 1986, Nature, 324, 446
- Bi & Davidsen (1997) Bi, H.G., & Davidsen, A. 1997, ApJ, 479, 523
- Burles & Tytler (1998) Burles, S., & Tytler, D. 1998a, ApJ, 499, 699
- Burles & Tytler (1998) Burles, S., & Tytler, D. 1998b, ApJ, 507, 732
- Briggs et al. (1989) Briggs, F.H., Wolfe, A.M., Liszt, H.S., Davis, M.M. & Turner, K.L. 1989, ApJ, 341, 650
- Cen et al. (1994) Cen, R., Miralda-Escudé, J., Ostriker, J.P., & Rauch, M. 1994, ApJ, 437, L9.
- Croft et al. (2001) Croft, R. A. C., Weinberg, D. H., Bolte, M., Burles, S., Hernquist, L., Katz, N., Kirman, D., Tytler, D. 2001, ApJ, submitted, astro-ph/0012324
- Croft et al. (1997) Croft, R.A.C., Weinberg, D.H., Katz, N., Hernquist, L., 1997, ApJ, 488, 532
- Davé et al. (1999) Davé, R., Dubinski, J., & Hernquist, L. 1997, N. Astron., 2, 277.
- Davé et al. (1999) Davé, R., Hernquist, L., Katz, N., & Weinberg, D.H. 1999, ApJ, 511, 521.
- Djorgovski et al. (1996) Djorgovski, S.G., Pahre, M.A., Bechtold, J., & Elston, R. 1996, Nature, 382, 234
- Fontana et al. (1996) Fontana, A., Cristiani, S., D’Odorico, S., Giallongo, E., & Savaglio, S. 1996, MNRAS, 279, L27
- Gardner et al. (1997a) Gardner, J. P., Katz, N., Hernquist, L., & Weinberg, D. H. 1997a, ApJ, 484, 31 (GKHW)
- Gardner et al. (1997b) Gardner, J. P., Katz, N., Weinberg, D. H., & Hernquist, L. 1997b, ApJ, 486, 42 (GKWH)
- Gingold & Monaghan (1977) Gingold, R.A. & Monaghan, J.J. 1977, MNRAS, 181, 375
- Haardt & Madau (1996) Haardt F., & Madau P. 1996, ApJ, 461, 20
- Haehnelt et al. (1998) Haehnelt, M.G., Steinmetz, M., & Rauch, M., 1998, ApJ, 497, 647
- Hernquist (1987) Hernquist, L. 1987, ApJS, 64, 715
- Hernquist & Katz (1989) Hernquist, L. & Katz, N. 1989, ApJS, 70, 419
- Hernquist et al. (1996) Hernquist, L., Katz, N., Weinberg, D.H. & Miralda-Escudé, J. 1996, ApJ, 457, L51
- Hui, Gnedin, & Zhang (1997) Hui, L., Gnedin, N., & Zhang, Y. 1997, ApJ, 486, 599
- Jenkins et al. (2001) Jenkins, A., Frenk, C. S., White, S. D. M., Colberg, J. M., Cole, S., Evrard, A. E., Couchman, H. M. P., & Yoshida, N. 2001, MNRAS, 321, 372
- Katz, Hernquist & Weinberg (1999) Katz, N., Hernquist, L., & Weinberg D.H. 1999, ApJ, in press.
- Katz, Weinberg, & Hernquist (1996) Katz, N., Weinberg D.H., & Hernquist, L. 1996, ApJS, 105, 19 (KWH)
- Katz et al. (1996) Katz, N., Weinberg D.H., Hernquist, L., & Miralda-Escudé, J. 1996, ApJ, 457, L57 (KWHM)
- Kauffmann (1996) Kauffmann, G. 1996, MNRAS, 281, 475
- Kauffmann & Charlot (1994) Kauffmann, G., & Charlot, S. 1994, ApJ, 430, L97
- Lacey & Cole (1994) Lacey, C., & Cole, S. 1994, MNRAS, 271, 676
- Le Brun et al. (1997) Le Brun, V., Bergeron, J., Boisse, P., & Deharveng, J.M. 1997, A&A, 321, 733.
- Ledoux et al. (1998) Ledoux, C., Petitjean, P., Bergeron, J., Wampler, E.J., & Srianand, R. 1998, A&A, 337, 51.
- Lucy (1977) Lucy, L. 1977, AJ, 82, 1013
- Ma et al. (1997) Ma, C., Bertschinger, E., Hernquist, L., Weinberg, D. H., & Katz, N. 1997, ApJ, 484, L1
- Maller et al. (2000) Maller, A. H., Prochaska, J. X., Somerville, R. S., & Primack, J. R. 2000, MNRAS, submitted, astro-ph/0002449
- McDonald et al. (2000) McDonald, P., Miralda-Escudé, J., Rauch, M., Sargent, W. L. W., Barlow, T. A., Cen, R., & Ostriker, J. P. 2000, ApJ, 543, 1
- Miralda-Escudé et al. (1996) Miralda-Escudé, J., Cen, R. Y., Ostriker, J. P., & Rauch, M. 1996, ApJ, 471, 582
- Mo & Miralda-Escudé (1996) Mo, H. J., & Miralda-Escudé, J. 1996, ApJ, 469, 589
- Mo & Miralda-Escudé (1994) Mo, H.J. & Miralda-Escudé, J. 1994, ApJ, 430, L25
- Moller & Warren (1998) Moller, P. & Warren, S.J. 1998, MNRAS, 299, 661
- Navarro & Steinmetz (1997) Navarro, J. F. & Steinmetz, M. 1997, ApJ, 478, 13
- Pei & Fall (1995) Pei, Y. C., & Fall, S. M. 1995, ApJ, 454, 69
- Petitjean et al. (1995) Petitjean, P., Mücket, J.P., & Kates, R. 1995, A&A, 295, L9
- Press & Schechter (1974) Press, W.H., Schechter, P. 1974, ApJ, 187, 425
- Press, Rybicki, & Schneider (1993) Press, W. H., Rybicki, G. B., & Schneider, D. P. 1993, ApJ, 414, 64
- Prochaska & Wolfe (1997) Prochaska, J.X. & Wolfe, A. M. 1997, ApJ, 487, 73
- Prochaska & Wolfe (1998) Prochaska, J. X., & Wolfe, A. M. 1998, ApJ, 507, 113
- Quinn, Katz, & Efstathiou (1996) Quinn, T.R., Katz, N., & Efstathiou. G.P. 1996, MNRAS, 278, L49 (QKE)
- Rao & Turnshek (1998) Rao, S.M, & Turnshek, D.A. 1998, ApJ, 500, 115
- Schiano, Wolfe, & Chang (1990) Schiano, A. V., Wolfe, A. M., & Chang, C. A. 1990, ApJ, 365, 439
- Stadel et al. (2000) Stadel, J., Katz, N., Weinberg, D.H., & Hernquist, L. 2000, in preparation
- Storrie-Lombardi et al. (1996a) Storrie-Lombardi, L.J., Irwin, M.J., & McMahon, R.G. 1996a, MNRAS, 282, 1330
- Storrie-Lombardi, McMahon, & Irwin (1996b) Storrie-Lombardi, L. J., McMahon, R. G., & Irwin, M. J. 1996b, MNRAS, 283, L79
- Storrie-Lombardi et al. (1994) Storrie-Lombardi, L.J., McMahon, R.G., Irwin, M.J., & Hazard, C. 1994, ApJ, 427, L13
- Storrie-Lombardi & Wolfe (2000) Storrie-Lombardi, L. J. & Wolfe, A. M. 2000, ApJ, 543, 552
- Thoul & Weinberg (1996) Thoul, A.A. & Weinberg, D.H. 1996, ApJ, 465, 608
- Turnshek et al. (2000) Turnshek, D. A., Rao, S., Nestor, D., Lane, W., Monier, E., Bergeron, J., & Smette, A. 2000, ApJ, submitted, astro-ph/110573
- Tyson (1988) Tyson, N. D. 1988, ApJ, 329, L57
- Wolfe et al. (1995) Wolfe, A.M., Lanzetta, K.M., Foltz, C.B., & Chaffee, F.H. 1995, ApJ, 454, 698
- Wolfe & Prochaska (1998) Wolfe, A.M., & Prochaska, J.X. 1998, ApJ, 494, 15
- Wolfe et al. (1993) Wolfe, A.M., Turnshek, Lanzetta, K.M., & Lu, L. 1993, ApJ, 385, 151
- Zhang et al. (1995) Zhang, Y., Anninos, P., & Norman, M.L. 1995, ApJ, 453, L57
- Zhang et al. (1997) Zhang, Y., Anninos, P., Norman, M.L., & Meiksin, A., 1997, ApJ, 485, 496