11(02.12.1; 02.12.3; 11.17.1; 11.17.4 APM 08279+5255) \offprintsS. A. Levshakov 11institutetext: European Southern Observatory, 85748 Garching bei München, Germany 22institutetext: Institut für Theoretische Physik der Universität Frankfurt am Main, Postfach 11 19 32, 60054 Frankfurt/Main 11, Germany
On the deuterium abundance at towards APM 08279+5255††thanks: The data presented herein were obtained at the W. M. Keck Observatory, which is operated as a scientific partnership among the California Institute of Technology, the University of California and the National Aeronautics and Space Administration. The Observatory was made possible by the generous financial support of the W. M. Keck Foundation.
Abstract
A very low primordial deuterium abundance of has recently been proposed by Molaro et al. in the Lyman limit system with cm-2 at towards the quasar APM 08279+5255. The D/H value was estimated through the standard Voigt fitting procedure utilizing a simple one-component model of the absorbing region. The authors assumed, however, that ‘a more complex structure for the hydrogen cloud with somewhat ad hoc components would allow a higher D/H’. We have investigated this system using our new Monte Carlo inversion procedure which allows us to recover not only the physical parameters but also the velocity and density distributions along the line of sight. The absorption lines of H i, C ii, C iv, Si iii, and Si iv were analyzed simultaneously. The result obtained shows a considerably lower neutral hydrogen column density cm-2. Hence, the measurement of the deuterium abundance in this system is rather uncertain. We find that the asymmetric blue wing of the hydrogen Ly absorption is readily explained by H i alone. Thus, up to now, deuterium was detected in only four QSO spectra (Q 1937-1009, Q 1009+2956, Q 0130-4021, and Q 1718+4807) and all of them are in concordance with .
keywords:
line: formation – line: profiles – quasars: absorption lines – quasars:individual: APM 08279+52551 Introduction
Accurate measurements of the hydrogen isotopic ratio D/H at high redshifts may allow us to test experimentally the basis of the standard model of big bang nucleosynthesis (BBN) – its homogeneity. A homogeneous BBN implies a uniform distribution of the D abundance among the absorbing systems with low metallicity since ‘no realistic astrophysical process other than the Big Bang could produce significant D’ (Schramm 1998, p.6).
First high quality spectral data of QSOs suggested, however, a dispersion in D/H (the ratio of the D i and H i column densities) of about one order of magnitude (for a summary, see Burles et al. 1999). This finding provoked a lively discussion in the literature on inhomogeneous models of BBN (Dolgov & Pagel 1999 and references cited therein). But later, it was shown that a single D/H value of about is sufficient to describe all observations available up to now (Levshakov et al. 1998a, 1998b, 1999b).

A new result by Molaro et al. (1999, hereafter MBCV), if confirmed, could challenge again the uniformity of the D/H space distribution because a very low deuterium abundance of was found in an extremely low metallicity system at towards APM 08279+5255. MBCV consider the derived D abundance as a lower limit because their analysis was based on a simplified one-component model of the absorbing cloud which failed to fit the red wing of the Ly line. They note that the observed complex structure of C iv and Si iv implies the presence of more than one component. They further state that ‘additional components are required to reproduce the extra absorption on the red wing of Ly’ which would decrease the H i column density for the major component leading to a higher deuterium abundance.
Following the MBCV suggestions, we have analyzed the absorption profiles of H i, C ii, C iv, Si iii, and Si iv by using our new Monte Carlo inversion (MCI) algorithm (Levshakov et al. 1999c, hereafter LAK). In the present Letter we show that the actual neutral hydrogen column density may be a factor of lower than the value of MBCV, a fact preventing any accurate measurements of the deuterium abundance in the system.
The main difference between MBCV’s analysis and our approach is that the former was performed in the framework of the microturbulent approximation using the standard Voigt fitting procedure, whereas the latter is based on a more general mesoturbulent model which describes the process of line formation in the absorbing clouds more adequately (Levshakov & Kegel 1997). In both cases the same spectra of APM 08279+5255 obtained with the Keck-I telescope and the HIRES spectrograph by Ellison et al. (1999) are utilized.
2 Model assumptions and results
Our model supposes a continuous absorbing gas slab of a thickness (presumably the outer region of a foreground galaxy). The absorber is assumed to exhibit a mixture of bulk motions such as infall and outflows, tidal flows etc. Then the gas motion along a given line of sight may be described by a fluctuating (random) velocity field in which the velocities in neighboring volume elements are correlated with each other (while in the standard microturbulent approximation completely uncorrelated velocities are assumed). The gas is tenuous and optically thin in the Lyman continuum. We are considering a compressible gas, i.e. the total number density of hydrogen is also a random function of the space coordinate, . Following Donahue & Shull (1991) and assuming that the ionizing radiation field is constant, the ionization of different elements can be described by one parameter only – the ionization parameter . Furthermore, for gas in thermal equilibrium, Donahue & Shull give an explicit relation between and the kinetic temperature . The background ionizing spectrum in our model is taken in the form given by Mathews & Ferland (1987).
To estimate physical parameters and appropriate distributions of the velocity and the normalized density , being the mean hydrogen density, we used the MCI procedure developed on the basis of the reverse Monte Carlo technique (Levshakov et al. 1999a). In our computations, the continuous random functions and are represented by their sampled values at equally spaced intervals , i.e. by the vectors {} and {} with large enough to represent the narrowest components of the complex spectral lines. For the ionization parameter as a function of , we have , with being the reduced mean ionization parameter defined below. We fix (the value adopted by MBCV) as a more or less arbitrary reference velocity at which .
Our aim is to fit the model spectra simultaneously to the observed hydrogen, carbon and silicon profiles. In this case the model requires the definition of a simulation box for the six parameters (see LAK, for details) : the carbon and silicon abundances, and , respectively, the rms velocity and density dispersions, and , respectively, the reduced total hydrogen column density , and the reduced mean ionization parameter . For the model parameters the following boundaries were adopted : ranges from to , from to , from 25 to 80 km s-1, from 0.5 to 2.2, from to cm-2, and ranges from to .
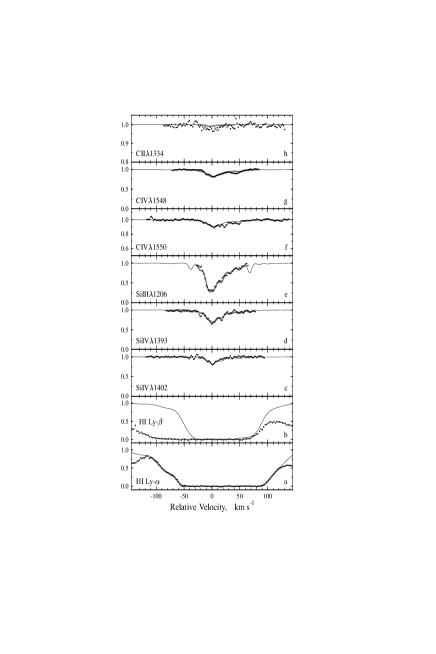
Having specified the parameter space, we minimize the value. The objective function includes the following portions of the absorption profiles (labeled by grey lines in Fig. 1) which, after preliminary analysis, were chosen as most appropriate to the MCI fitting : for H i Ly ranges from to km s-1 (the blue wing) and from 84 to 119 km s-1 (the red wing, see Fig. 1a), for C ii from to 33 km s-1 (Fig. 1h), for C iv from to 79 km s-1 (Fig. 1g), for Si iii from to 60 km s-1 (Fig. 1e), and for Si iv ranges from to 70 km s-1 (Fig. 1d). The necessity to choose these portions instead of the all available profiles was caused by a few discrepancies in the data. Thus two small spikes in C iv at and 23 km s-1 are not seen in its stronger blue counterpart C iv, two minima in Si iv at and 17 km s-1 are invisible in the profile of the red component Si iv. But in Fig. 1 (panels f and c) the observed C iv and, respectively, Si iv are shown together with the model spectra computed with the parameters derived from Ly, C ii, C iv, Si iii, and Si iv fitting to illustrate the consistency. For the same reason the Ly model spectrum is shown in Fig. 1b at the expected position. The additional absorption on the blueward and the redward sides of Ly in the observed spectrum may be caused by Ly and/or Ly forest lines at different redshifts. In Fig. 1, all model spectra are drawn by continuous thin lines, whereas filled circles represent observations (normalized fluxes).
The MCI is a stochastic optimization procedure and one does not know in advance if the global minimum of the objective function is reached in a single run. Therefore we executed several runs for the given data set starting every calculation from a random point in the simulation box and from completely random configurations of the velocity and density fields. The results for five runs are listed in Table 1. The first solution (upper row in Table 1) was used to calculate the model spectra shown in Fig. 1, and the corresponding distributions of , , and which are presented in Fig. 2.
| [C/H]⋆ | [Si/H]⋆ | ||||||
| 4.4 | 4.6 | 1.25 | 51 | 1.1 | 1.17 | ||
| 5.0 | 5.3 | 1.10 | 50 | 0.8 | 1.15 | ||
| 5.9 | 5.2 | 1.60 | 48 | 1.1 | 1.16 | ||
| 8.7 | 7.2 | 2.54 | 70 | 1.6 | 1.16 | ||
| 11.3 | 8.1 | 1.83 | 52 | 0.9 | 1.03 | ||
| ⋆ based on solar abundances from Grevesse (1984); | |||||||
| [X/H] = | |||||||
The median estimations of the parameters give cm-2, cm-2, , km s-1, , [C/H] = – 1.8, and [Si/H] = – 0.7. The results were obtained with and the correlation coefficients .
The MCI allowed us to fit precisely not only the blue wing of the saturated Ly line but the red one as well. In addition we have reached a reasonable concordance between hydrogen and metal absorption lines. Although our model spectra of metal lines are consistent with the observed profiles within the 3- uncertainty range, we found difficulties with the C ii line fitting. The C ii model spectrum lies systematically over the observed intensities (Fig. 1h). We note that the measurement of the C ii line depends sensitively on the exact definition of the continuum because the line is very weak (it was not included by Ellison et al. into the system).
Nevertheless, let us assume for a moment that MBCV’s identification of C ii is correct, and let us further compare in some more detail the micro- and mesoturbulent results. Using the Doppler parameters km s-1 and km s-1 measured by MBCV, it is easy to estimate the turbulent velocity km s-1 and the kinetic temperature K. On the other side, the MCI kinetic temperature distribution (Fig. 2) does not reveal values lower than K. Besides, K seems to be too low for the photoionization heating. The mean kinetic temperature from the mesoturbulent solution K is, probably, more realistic. The four times higher mesoturbulent value of the rms velocity dispersion is also supported by observations. Indeed, large broadening may be caused by the lensing effects since this QSO exhibits two components of similar intensity separated by (Irvin et al. 1998). The low and seem to be an indication that the identification of C ii at is not very certain.
3 Conclusions

We have shown that the determination of the D abundance in the system is strongly model dependent. The Ly profile can as well be modeled with a considerably lower value of as compared to the MBCV model if one accounts for spacial correlations in the large scale velocity and density fields. This implies that the identification of the D i line in this system cannot be confirmed or ruled out without additional observations of the higher order Lyman series lines in order to constrain the total neutral hydrogen column density and the velocity field configuration.
For this particular case, the presence of the extra-absorption exactly at the expected deuterium position km s-1 becomes evident from the upper panel of Fig. 3 where dotted and solid line histograms show, respectively, the density weighted radial velocity distributions for the total and neutral hydrogen, whereas the dashed curve illustrates as adopted by MBCV (a Gaussian with km s-1). The radial velocity distribution of H i shows a blue-side asymmetry which may just mimic the deuterium absorption. The main maximum of is shifted to km s-1 with respect to MBCV’ frame of reference. The distribution exhibits also an extended red wing ranging up to km s-1. This asymmetry is also clearly pronounced in the Si iii profile (Fig. 1e).
The restored density and velocity fields reveal a very complex structure which is manifested in non-Gaussian distributions as shown in Fig. 3 for the total hydrogen density as well as for the individual ions. It appears that C iv is a good tracer for the distribution of the total hydrogen density.
Since the Voigt profile fitting analysis may produce very misleading results when applied to the case where the deviation from Gaussianity in the velocity distribution becomes significant, the extremely low metallicity with and reported by MBCV may be caused by their simplified model. For example, our analysis yields considerably higher values of and . A metallicity as high as [C/H] and a silicon overabundance [Si/C] dex has been measured in the metal systems at towards Q 0000–2619 (Savaglio et al. 1997). A similar silicon overabundance has also been observed in halo (population II) stars. The standard interpretation of these observations is that the metal-poor gas was enriched by Type II supernova nucleosynthesis products (e.g. Henry & Worthey 1999). Thus, our measurements are in agreement with these results.
Hence, it may be concluded that up to now deuterium lines have been identified convincingly in only four QSO spectra. Our previous D/H measurements in Q 1937–1009, Q 1009+2956, and Q 1718+4807 and the last one by Kirkman et al. (1999) in Q0130–4021 are consistent with a single value of .
Acknowledgements.
The authors are grateful to Ellison et al. for making their data available. We thank Sandro D’Odorico for valuable comments and Miguel Albrecht for kind advice in using the ESO computer cluster. SAL and IIA gratefully acknowledge the hospitality of the European Southern Observatory (Garching), where this work was performed.References
- [1] Burles, S., Kirkman, D., Tytler, D. 1999, ApJ, 519, 18
- [2] Dolgov, A. D., Pagel, B. E. J. 1999, New Astron., 4, 223
- [3] Donahue, M., Shull, J. M. 1991, ApJ, 383, 511
- [4] Ellison, S. L. et al. 1999, PASP, 111, 946
- [5] Grevesse, N. 1984, Phys. Scripta, T8, 49
- [6] Henry, R. B. C., Worthey, G. 1999, PASP, 111, 919
- [7] Irwin, M. J., Ibata, R. A., Lewis, G. F., Totten, E. J. 1998, ApJ, 505, 529
- [8] Kirkman, D., Tytler, D., Burles, S., Lubin, D., O’Meara, J. M. 1999, AAS, 194, 3001 (astro-ph/9907128)
- [9] Levshakov, S. A., Kegel, W. H. 1997, MNRAS, 288, 787
- [10] Levshakov, S. A., Kegel, W. H., Takahara, F. 1998a, ApJ, 499, L1
- [11] Levshakov, S. A., Kegel, W. H., Takahara, F. 1998b, A&A, 336, L29
- [12] Levshakov, S. A., Kegel, W. H., Takahara, F. 1999a, MNRAS, 302, 707
- [13] Levshakov, S. A., Tytler D., Burles S. 1999b, in Early Universe : Cosmological Problems and Instrumental Technologies (Proceed. of the Gamov Memorial International Conference, St. Petersburg, August 23-28, 1999), in press (astro-ph/9812114)
- [14] Levshakov, S. A., Agafonova, I. I., Kegel, W. H. 1999c, A&A, in preparation [LAK]
- [15] Mathews, W. D., Ferland, G. 1987, ApJ, 323, 456
- [16] Molaro, P., Bonifacio, P., Centurion, M., Vladilo, G. 1999, A&A, 349, L13 [MBCV]
- [17] Savaglio, S., Cristiani, S., D’Odorico, S., Fontana, A., Giallongo, E., Molaro, P. 1997, A&A, 318, 347
- [18] Schramm, D. N. 1998, in Primordial Nuclei and Their Galactic Evolution, eds. N. Prantzos, M. Tosi, & R. von Steiger (Kluwer Academic Publ.: Dordrecht, The Netherlands), 3