2 Istituto TeSRE/CNR, via Gobetti 101, I-40129 Bologna; mcappi@tesre.bo.cnr.it, bassani@tesre.bo.cnr.it, malaguti@tesre.bo.cnr.it
3 Osservatorio Astronomico di Trieste, via G.B. Tiepolo 11, I-34131 Trieste; persic@sissa.it
The low luminosity AGN in the LINER galaxy M81: discovery of highly ionized gas
Abstract
The LINER nucleus of the nearby spiral galaxy M81 was pointed by BeppoSAX, which caught it at the highest (2–10) keV flux level observed so far. The LECS, MECS and PDS data, extending over (0.1–100) keV, are used to investigate the physical similarities and differences between LINERs and AGNs. The continuum is well fitted by a power law of photon index , modified by little absorption due to cold material; this extends to (0.1–100) keV the validity of a similar result. Superimposed on the continuum detects a 6.7 keV emission line (confirming another result) and an absorption edge at keV. Both spectral features are consistent with being produced by iron at the same high ionization level, and probably also with the same column density. So, we suggest that they originate from transmission through highly ionized thin material. Concerning the origin of the continuum emission, we do not observe signs of reflection from the optically thick material of an accretion disk, as usually found in Seyfert 1’s (a 6.4 keV emission line and a broad bump peaking at 10–20 keV). The low bolometric luminosity of the nucleus of M81 is consistent with being produced by advection dominated accretion; in this case the X-ray emission should be dominated by Comptonization, rather than by bremsstrahlung, in order to reproduce the steep spectrum observed over the (0.1–100) keV band.
Key Words.:
Galaxies: active – Galaxies: individual: M81 – Galaxies: Seyfert – X-rays: galaxies1 Introduction
M81 (NGC3031) is a nearby spiral galaxy with a prominent bulge and well defined spiral arms, morphologically similar to M31 (Table 1). It has been well studied at all frequencies, from radio (e.g., Beck et al. 1985, Bietenholz et al. 1996), to optical and UV (e.g., Ho et al. 1996), to X-rays (Sect. 2). On the basis of these observations, M81 turned out to be the closest galaxy to show the spectroscopic signatures of a LINER (Ho et al. 1997). In addition, some observed properties make the nucleus of M81 a good candidate for a low luminosity AGN (LLAGN). These include the presence of a broad component of the emission line (Peimbert & Torres-Peimbert 1981), a compact radio core (Bietenholz et al. 1996), a pointlike X-ray source coincident with the optical nucleus (Fabbiano 1988, hereafter F88), and the presence of a power law continuum in the 2–10 keV energy band (Ishisaki et al. 1996, hereafter I96). Dynamical studies also suggest the presence of a super-massive object at the galaxy nucleus, of mass (Ho 1999).
Here we report the results of an analysis of the properties of the nucleus of M81 over 0.1–100 keV, and discuss them in relation to previous X-ray observations (mostly in the 2–10 keV band) and the unsolved issue of sorting out the physical similarities and differences between LINERs and AGNs. In particular the origin of LINERs is still uncertain: their emission line spectrum could be powered by a LLAGN, in which case they could represent the missing link between normal galaxies and the less luminous AGNs, or by starburst activity (Terlevich et al. 1992). The very large energy band of BeppoSAX coupled to its spectral resolution (8% FWHM at 6 keV) is especially suited for reliably measuring the high energy continuum, and to search for a thermal component and Fe-K features. Therefore we can investigate more accurately than with previous instruments the similarities and differencies of the X-ray properties of LINERs with those of AGNs.
| Typea | RA | Dec | d | log | ||
|---|---|---|---|---|---|---|
| (J2000) | (J2000) | (Mpc) | (mag) | () | (cm-2) | |
| Sab | 3.6 | 7.39 | 10.32 | 4.1 |
a from de Vaucouleurs et al. (1991). is the total B magnitude, corrected for Galactic and internal extinction.
b Cepheid-based distance (Freedman et al. 1994).
c total B-band luminosity, derived using the indicated distance and .
d Galactic neutral hydrogen column density from Stark et al. (1992).
2 X-ray observations of M81 prior to
M81 has been pointed by many X-ray satellites. It was first observed in X-rays with Einstein (Elvis & Van Speybroeck 1982; F88). This imaging satellite revealed the presence of several discrete sources in the M81 region, the brightest of which coincides in position with the nucleus (Fig. 1). Its spectral representation was given in terms of a steep power law () or in terms of a thermal component of keV, both absorbed by a hydrogen column density in excess of the Galactic value (in Table 1). Subsequent observations by GINGA (Ohashi et al. 1992), BBXRT (Petre et al. 1993) and ROSAT (Boller et al. 1992) gave a spectral interpretation in terms of a power law with and ranging from being consistent with to ten times higher. Petre et al. also found a thermal component of keV.
ASCA pointed M81 several times between 1993 and 1999 (I96, Iyomoto 1999). It was found that, over such a long period, the 2–10 keV luminosity of the nucleus was highly variable (Fig. 2). However no spectral variability was found, and the average spectrum was well fitted by a power law continuum of photon index , absorbed by a column density of cm-2, plus a thermal component with a temperature of keV. A possibly broad or complex iron emission line centered at 6.6–6.9 keV, with an equivalent width of eV, was also detected.
3 X-ray data analysis
M81 was observed by three of the Narrow Field Instruments onboard the BeppoSAX satellite (Boella et al. 1997a): the Low Energy Concentrator Spectrometer (LECS), the Medium Energy Concentrator Spectrometer (MECS), and the Phoswich Detector system (PDS; Frontera et al. 1997). The journal of the observation is given in Table 2. The LECS and MECS are grazing incidence telescopes with position sensitive gas scintillation proportional counters in their focal planes. The MECS, which at the epoch of the observation consisted of two equal units, has a field of view of diameter, and works in the range 1.6–10 keV (Boella et al. 1997b). The LECS operates at softer energies (0.1–4.5 keV), has a field of view of diameter, an energy resolution a factor of better than that of the ROSAT PSPC, but an effective area much lower (between a factor of 6 and 2 lower, going from 0.3 to 1.5 keV; Parmar et al. 1997). The PDS is a collimated instrument, operating in rocking mode (i.e., half of the time on the source and half on the background direction), that covers the 13–300 keV energy band. It has a triangular response with FWHM of (Frontera et al. 1997).
The cleaned and linearized data have been retrieved from the BeppoSAX Science Data Center archive, and later reduced and analysed using the standard software (XSELECT v1.4, FTOOLS v4.2, IRAF-PROS v2.5, and XSPEC v10.0). For the MECS, we used the event file made by merging the data of the two properly equalized MECS units. The PDS data reduction was performed using independently both XAS (v.2.0, Chiappetti & Dal Fiume 1997) and SAXDAS (v.1.3.0, Fiore et al. 1999) software packages, and yielded consistent results. In the following, we will refer to the results obtained with the SAXDAS package.
| Date | Exposure timea (ks) | Count Rateb (ct/s) | |||||
|---|---|---|---|---|---|---|---|
| LECS | MECS | PDS | LECS | MECS | PDS | ||
| 1998 Jun 4 | 43.20 | 100.3 | 36.40 | 0.329 | 0.496 | 0.57 | |
a On-source net exposure time. The LECS exposure time is considerably shorter than the MECS one, because the LECS can operate only when the spacecraft is not illuminated by the Sun.
b Background subtracted source count rates, with photon counting statistics errors.
3.1 Spatial analysis and extraction regions
The satellite pointed the optical center of the galaxy (in Table 1). The center of the X-ray emission was found to be located at , for the LECS, and , for the MECS, i.e., within from the optical center of the galaxy given in Table 1. Therefore, within the accuracy with which positions are given by , the X-ray centers coincide with the M81 nucleus. The LECS and MECS images in the 0.1–4.0 and 1.65–10.5 keV energy bands respectively are shown in Fig. 1. Also shown are the positions of the sources detected in the field by the Einstein observation.
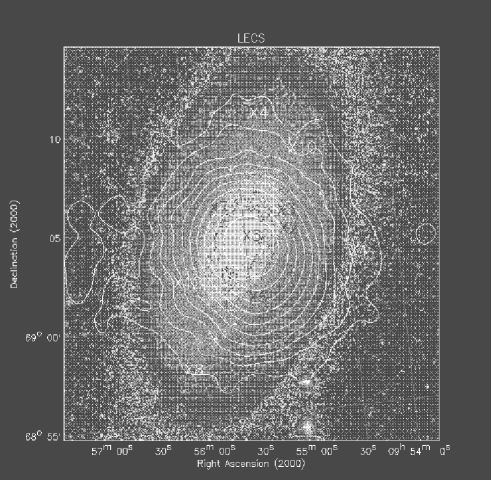
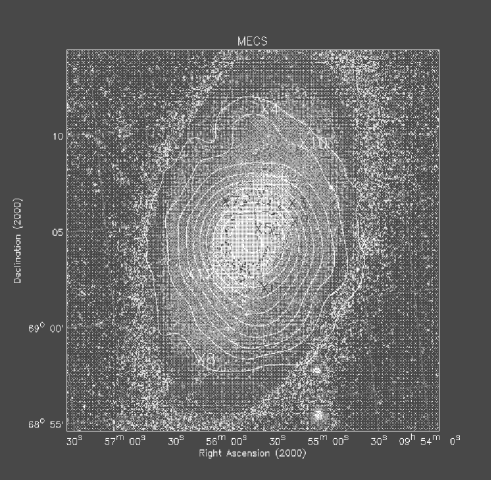
For a point source, the PSF of the MECS includes 80% of photons of energies keV within a radius of (Boella et al. 1997b). The PSF of the LECS is broader than that of the MECS below 1 keV, while it is similar to it above 2 keV (see http://www.sdc.asi.it/software/cookbook). In order to study the spectral properties of the nucleus of M81, given these instrumental characteristics, counts have been extracted from a circle of radius for the MECS, and of radius for the LECS. The larger radius adopted for the LECS is motivated by its larger PSF at softer energies. A radius of was also adopted for the extraction of the Einstein and ASCA spectra (F88, I96). We estimate in Sect. 3.6 the contribution of the unresolved emission from the galaxy to the LECS and MECS spectra extracted as described above.
The starburst galaxy M82, that lies 37′ from M81, is inside the PDS field of view (and outside the LECS and MECS ones). Given the PDS triangular response ( FWHM), half of the M82 flux between 13–300 keV could “contaminate” the M81 observation. A observation of M82 performed one year earlier indicates, however, that M82 has a steeper spectrum than M81 (photon index of in the PDS energy band), and a 13–50 keV flux erg cm-2 s-1 (Cappi et al. 1999), i.e., a factor of lower than that of M81 in the same energy range. We estimate then that the PDS spectrum of M81 could be contaminated by at most 25% of its flux. Therefore, we added a systematic uncertainty of this level to the spectral data between 13–50 keV.
3.2 Variability

The long term variation of the M81 (2–10) keV flux, obtained by collecting observations from various observatories, is plotted in Fig. 2. During the BeppoSAX pointing the nucleus was at the highest level ever observed. From 1993 to 1998 it brightened by a factor of .
A short term variation is clearly detected by ; the light curves obtained from the LECS and MECS data are plotted in Fig. 3. The count rates of both instruments show a variation of % from peak to valley over roughly one day. The fit of the MECS light curve with the sine function (Fig. 3, bottom) is significantly better than that with a constant value; the period turns out to be almost 2 days (43 hours). Since this period is comparable to the length of the observing time, the presence of a periodical change cannot be established; future observations might reveal whether this periodicity is real. The light curve extends over a time interval as long as the longest of the ASCA observations (made during April 1993; Serlemitsos et al. 1996). The ASCA light curve in that case showed variability of the order of % on a timescale of day.


It is unlikely that the flux variation is produced by an X-ray binary in the field, because it should be extremely luminous ( erg s-1 in the 0.1–2 keV band, and erg s-1 over 2–10 keV). No sources so luminous have been detected by Einstein and (see Sect. 3.6). Another fact points against the hypothesis of a binary responsible for the variability: the variation detected by ASCA, which had observed the nucleus of M81 during a phase of lower flux level in 1993 (Fig. 2), had a smaller amplitude than that detected by BeppoSAX; a variation of larger amplitude is instead expected when the flux of the nucleus is lower, if it is produced by a binary.
3.3 Spectral analysis
The background spectrum was estimated from blank fields event files (released in Nov. 1998). These blank-fields events were accumulated on five different pointings of empty fields; the extraction regions used for them correspond in size and position to those of the source. Spectral channels corresponding to energies 0.12–4 keV, 1.65–10.5 keV, and 15–200 keV have been used for the analysis of the LECS, MECS and PDS data respectively.
The data have been compared to models, convolved with the instrumental and mirror responses, using the minimization method. For this comparison the original channels have been rebinned in order to sample the instrument resolution with the same number of channels at all energies, and in order to have bins adequately filled for applicability of the statistic to assess the goodness of fit (Cash 1979). The spectral response matrices and effective area files released in September 1997 have been used in the fitting process. We fitted the models simultaneously to the LECS, MECS and PDS data. In the fitting two normalization constants have been introduced to allow for known differences in the absolute cross-calibrations between the detectors (Fiore et al. 1999). The models are modified by photoelectric absorption of the X-ray photons due to intervening cold gas along the line of sight, of column density . The results of the spectral analysis are presented in Table 3.
| Model parameters | Best fit values |
|---|---|
| A. pow+gauss: | |
| (cm-2) | 7.2 (6.1–8.5) |
| 1.86 (1.84–1.89) | |
| F(erg cm-2 s) | 2.1, 3.8, 7.4 |
| Line E(keV) | 6.70 (6.59–6.81) |
| Line EW (eV) | 104 (64–133) |
| 193/178 | |
| B. mekalb+pow: | |
| () | 0.5 (0.4–1.3) |
| (keV) | 6.5 (3.5–7.9) |
| Fmekal(erg cm-2 s) | 0.4, 0.7, 0.6 |
| (cm-2) | 7.1 (5.7–8.2) |
| 1.85 (1.76–1.88) | |
| Fpow(erg cm-2 s) | 1.7, 3.1, 5.6 |
| 181/177 | |
| C. pow+gauss+edge: | |
| (cm-2) | 6.7 (5.7–7.9) |
| 1.84 (1.82–1.87) | |
| F(erg cm-2 s) | 2.1, 3.8, 7.4 |
| Line E(keV) | 6.69 (6.58–6.83) |
| Line EW (eV) | 84 (48–121) |
| Edge E(keV) | 8.6 (7.8–9.0) |
| 0.15 (0.07–0.24) | |
| 182/176 | |
| D. mekalb+pow+gauss+edge: | |
| () | 0.03 (0.–0.09) |
| (keV) | 0.50 (0.25–0.95) |
| Fmekal(erg cm-2 s) | 0.3, 0, 0 |
| (cm-2) | 12.0 (9.0–15.6) |
| 1.86 (1.83–1.89) | |
| Fpow(erg cm-2 s) | 1.8, 3.8, 7.2 |
| Line E(keV) | 6.70 (6.58–6.83) |
| Line EW (eV) | 95 (49–123) |
| Edge E(keV) | 8.6 (7.8–9.1) |
| 0.14 (0.06–0.23) | |
| 172/173 |
a Column density of neutral hydrogen in addition to .
b The column density of neutral hydrogen absorbing the mekal component is fixed at the Galactic value of cm-2.
Note: is the number of degrees of freedom of the fit. The values between parenthesis, close to the best fit values, give the 90% confidence intervals for one interesting parameter (these intervals correspond to ).
Note: three values for the absorbed fluxes are given, respectively for the (0.1–2), (2–10), and (10–100) keV energy bands.
3.3.1 Fitting results
A single thermal model cannot reproduce the broad band data, in which the nucleus is detected up to 100 keV. The LECS and MECS data constrain the temperature to be around 8 keV, but with this temperature the model of course totally fails to reproduce the PDS data. On the other hand, a thermal component that fits the high energy region would have keV, and would be too flat to reproduce the LECS and MECS data. A two-component thermal model (with temperatures and keV) gives a better fit, but still of poor quality. A single power law component of photon index can instead reproduce the data over the whole energy band (Fig. 4). As can be seen looking at the residuals (see also Fig. 5), excess emission is present between 6–7 keV, as already found by (Sect. 2). Adding a narrow gaussian line to the model gives a decrease of of 21 for two additional parameters (the line center energy and normalization); so, this line is statistically significant at % confidence level in an F-test (this follows the treatment, specific for fitting of X-ray spectral data, about how to assess the usefulness of adding extra parameters to an initial model by Malina et al. 1976). The line is centered at keV, and its equivalent width is EW= eV (see model A in Table 3; Fig. 7). If the width of the line is left as a free parameter, we obtain for it at the best fit a value of eV and an upper limit at 90% confidence for one interesting parameter of 300 eV. The 6.4 keV value for the line center energy is excluded at % confidence level. Its introduction in the fitting provides a 90% confidence upper limit on its EW of 42 eV, and no improvement of the fit.


The power law is absorbed by cold material exceeding the Galactic column density by cm-2. This intrinsic column density is consistent with that derived optically: Filippenko & Sargent (1988) estimated an E(B–V)=0.1 for the broad line region of M81, which translates into cm-2.
A further improvement in the quality of the fit is obtained by fitting with a power law plus a thermal component (model B in Table 3; the mekal model describes the thermal emission from an optically thin hot plasma, both from continuum and lines). Then and again cm-2 for the power law component; for the thermal component keV, (imposed, otherwise it would be lower) and . This model gives a fit of better quality than model A because the thermal component reproduces the 6.7 keV line and gives slightly smaller residuals than a simple power law in a few channels below 1 keV. This thermal component contributes 16% of the total unabsorbed flux over 0.1–10 keV.

3.3.2 Detection of an ionized absorber
There is another spectral region, located around 9 keV, that shows residuals when fitted with a simple power law (Figs. 4 and 5). In fact the quality of the “power law plus gaussian line” fit improves by adding an absorption edge (Fig. 6; model C in Table 3). This turns out to be located at keV, with optical depth (Fig. 8). The presence of one edge is statistically significant at % confidence level (from an F-test; decreases by 11 for 2 more fitting parameters). We cannot exclude that the ‘hole’ around 9 keV could be produced by more than one ionization stage. Fitting with two edges, at energies fixed at 8.5 keV (FeXXIII) and 8.8 keV (FeXXV), improves the fit slightly but not significantly. This is the first time an absorption edge is detected in the X-ray spectra of LINERs.


3.4 Spectral analysis and variability
We have also looked for spectral differences between the two states of low and high flux, i.e., we have studied separately the spectra obtained from the first and the last s of the pointing (see Fig. 3). We do not find significant changes between the two states in any spectral property described above (power law slope, emission line and absorption edge center energies, optical depth of the edge). Going from the low to the high state the normalization of the power law increases, and the equivalent width of the 6.7 keV line marginally decreases. More precisely, when a fit with a power law + gaussian line + edge is performed, going from the low to the high state slightly decreases from to , while the EW drops from eV to eV. The line center energy goes from 6.73 to 6.65 keV, with the associated confidence intervals almost overlapping. The line flux goes from photons cm-2 s-1 to photons cm-2 s-1.
3.5 X-ray fluxes and luminosities
In Table 3 we report the observed fluxes in the energy bands (0.1–2), (2–10) and (10–100) keV. The luminosities are obtained from fluxes corrected for the observed total , adopting a distance of 3.6 Mpc. So, for the model power law + gaussian line + edge (model C), in the three bands erg s-1. The (0.1–100) keV luminosity is erg s-1.
3.6 Background emission from the M81 galaxy
Before ascribing the derived spectral properties to the nucleus of M81, we must evaluate the contribution, within the region used to extract the LECS and MECS spectra, from the various possible non-nuclear X-ray components of M81: stars, supernova remnants, X-ray binaries, and possibly a hot ISM. Einstein resolved a few sources to within (Fig. 1). In particular, we expect a contribution from sources X2, X3, X6, and X7. Given their positions, their Einstein fluxes (F88), and the shape of the PSF, we estimate their contribution to be % of the total net counts within a radius of from the nucleus111During the Einstein pointing the source X5 was in a low state, by at least a factor of ten lower than what was found later by , , , , and a factor of fourty lower than found by (Fig. 2); so, using the Einstein fluxes for the various point sources we can estimate an upper limit to their contribution to the total net counts.. The point sources resolved in the ROSAT HRI image within of the nucleus are 11 (G. Fabbiano, private communication). Their HRI count rates give a contribution of % to the total (0.1–2) keV flux within a circle of radius. Note that there are no sources bright enough to produce the short term variability shown by (Fig. 3, Sect. 3.2). From an estimate kindly provided by G. Fabbiano of the ‘galaxy background’ contribution (which includes also the unresolved emission) we derive that % of the total counts within belong to the active nucleus, in the (0.1–2) keV band; this calculation takes into account also the increase in flux observed between the and pointings (Fig. 2).
The galaxy background contribution is difficult to estimate with data from satellites sensitive to higher energies than , due to their poor angular resolution. This contribution has proven to be not influential for the spectral analysis in the ASCA (0.5–10) keV band (I96). I96 estimated that the galaxy background outside the central is well fitted by a bremsstrahlung of keV (which led I96 to ascribe the galaxy background to the integrated emission from LMXBs). A spectral fit of the nuclear region with such a bremsstrahlung component restricted the galaxy background contribution to % of the 2–10 keV luminosity of the active nucleus. A similar analysis for the LECS and MECS data would not give results more reliable than those obtained with , due to the angular resolution of these instruments and the vignetting effect that becomes large off-axis. All in all, we are confident that % of the (0.1–100) keV net counts extracted from a circle of radius from the galaxy center come from the active nucleus.
4 Discussion
The simplest model that explains all the features of the 0.1–100 keV spectrum is a power law of , to which a gaussian line at 6.7 keV and an absorption edge at keV are added. The energy of the line indicates K emission from He-like iron (FeXXV), while its 90% confidence interval goes from FeXXII to FeXXV. The absorption edge can be produced by ions from FeXVII to FeXXV, within the 90% confidence interval, and its best fit energy corresponds to the FeXXIV K-edge ( keV; Makishima 1985). Both features therefore come from highly ionized material. Moreover they could be consistent with each other also in column density. The best fit value for the optical depth , when assuming a cosmic abundance of iron, and the photoionization cross section for the K-shell for ionization stages from FeXXIII to FeXXV (Krolik & Kallman 1987), corresponds to a hydrogen column density of cm-2 for the ionized material. The observed EW of eV for the Fe-K line can be produced by reflection from or transmission through a column density of cm-2, in the case of neutral material (Makishima 1985). In case of highly ionized material, an EW of eV is expected to correspond to slightly lower column densities than for the neutral case (Turner et al. 1992).
As can be seen from Table 3, a model made by the superposition of a power law and a thermal component at keV (model B) is equally statistically acceptable as a model with a power law + gaussian line + edge (model C), because it reproduces the 6.7 keV line, and the residuals in a few channels below 1 keV are slightly smaller. Since the absorption edge remains totally unexplained with a thermal model, we prefer to adopt model C. To reduce its residuals below 1 keV, the addition of a soft ( keV) thermal component proved effective (model D in Table 3); it contributes % of the (0.1–2) keV absorbed flux. This soft component is not required by the data though, since is reduced by ten, but the number of free parameters increases by three. A soft component had been detected also in the analysis of data by Petre et al. (1993), and by I96 (Sect. 2). This soft thermal emission could represent the ‘galaxy background’ within of the nucleus, that we estimate to account for % of the total emission within that radius in the band (Sect. 3.6). Soft emission with this temperature and sub-solar abundance is common to spiral galaxies, and may well come from heterogeneous origins (supernova remnants, stars, thermal gas created in a starburst; e.g., Serlemitsos et al. 1996, Iyomoto et al. 1997).
The possible origin of the adopted model (power law + gaussian line + edge) is discussed in the following. The power law component that well reproduces the (0.1–100) keV spectrum is usually related to the presence of an AGN. This presence is not unexpected here: based on the velocities and dimensions of the broad line region, and assuming that gravity dominates the motion of the clouds, Ho et al. (1996) derived a central mass of for the nucleus of M81, recently updated to (Ho 1999). Moreover, no absorption much in excess of the Galactic value is seen in the X-ray spectrum. This property, together with the value of close to that found for Seyfert 1’s (Nandra & Pounds 1994), makes M81 similar to Seyfert 1’s.
4.1 Origin of the iron-K emission and absorption
Are the 6.7 keV emission line and the 8.6 keV absorption edge produced by reflection (e.g., from an X-ray illuminated disk, ycki & Czerny 1994), or by transmission? And where is the highly ionized material responsible for the line and the edge located? In the case of reflection from a disk, its ionization state should be higher than in Seyfert 1’s, because the iron line energy is higher (6.7 keV instead of 6.4 keV). But there are both observational and physical problems with this hypothesis. The observational problem is that the expected reflection continuum from highly ionized matter is absent in the spectral data. The fit with the inclusion of a reflection component from an ionized face-on disk shows that this component is not required by the data, and we derive a 90% confidence upper limit on the subtended solid angle of the reflecting material of 0.3. Moreover, the fit is of poor quality because reflection cannot reproduce a sharp absorption edge at 8.6 keV as observed (it produces smeared edges, Ross et al. 1999). The physical problem is that the observed accretion rate is too low for the required ionization level in the disk. In order to have He-like iron the accretion rate in Eddington units must be ( for FeXXII; Matt et al. 1993). The observed bolometric luminosity of the nucleus gives only (see Sect. 4.2 below). So, fails severely the requirement . Therefore the line and the edge are unlikely to be produced by reflection from a highly ionized accretion disk.
We suggest instead that they are produced by transmission through a highly photoionized medium, located close to the nucleus. If so, this points out an interesting similarity with the presence of a warm absorber in Seyfert 1’s (Nandra & Pounds 1994). Usually Seyfert 1’s show the oxygen absorption edges, superimposed onto the power law continuum, at 0.74 and 0.87 keV; we do not observe these edges, because the material is highly ionized. Concerning the location of such material, it could be close to the source of ionizing photons. In the hypothesis that its line of sight thickness is much less than , its distance from the source of photoionizing photons, Reynolds & Fabian (1995) derive a constraint on : , where is the luminosity of ionizing photons, is the column density of photoionized matter, and is its level of ionization222 In order to have an ionization level FeXXII to peak, the ionization parameter erg cm s-1, while erg cm s-1 for He-like iron to peak. These values refer to an input spectrum of a power law with from 13.6 eV to 13.6 keV, passing through an optically thin shell of gas (Turner et al. 1992). (, where is the number density of photoionized matter, Kallman & McCray 1982). So cm, if cm-2 (as derived from the absorption edge in Sect. 4) and erg s-1 for the observed (0.1–100) keV luminosity of the nucleus of M81. This places the absorber slightly closer to the nucleus with respect to what is found typically for Seyfert 1’s, where the so-called warm absorber is located at radii coincident with, or just outside, the broad line region (e.g., Reynolds & Fabian 1995).
4.2 Origin of the X-ray continuum
In the framework of standard -disks (Shakura & Sunyaev 1973) X-ray emission with a power law shape arises from inverse Compton scattering, by a hot optically thin plasma in a corona, of UV/soft X-ray photons produced by the accretion disk (see, e.g., Svensson 1996 for a review). The observed bolometric luminosity of the nucleus of M81 corresponds to a low accretion rate. Adopting the central mass value of , the bolometric luminosity of the nucleus obtained by integrating the observed spectral energy distribution from the radio to 10 keV ( erg s-1, Ho 1999) and a radiative efficiency of 0.1, it turns out that . A problem with this scenario is that we do not detect signs of reflection from optically thick cold material, usually found in Seyfert 1’s, and attributed to the presence of an accretion disk. These signs are a 6.4 keV emission line with typical EW of 100–150 eV, and a broad bump peaking at 10–20 keV (Nandra & Pounds 1994). As a further comparison with the continuum of classical, more luminous AGNs, note that also the ‘big blue bump’, traditionally attributed to thermal radiation from an accretion disk, is absent in the spectral energy distribution observed for the nucleus of M81 (Ho 1999). So, we conclude that this LLAGN is not a simple extension of high luminosity ones.
An alternative possibility for the origin of the continuum emission could be the presence of an advection dominated accretion flow (ADAF, Narayan & Yi 1995), a solution devised for AGNs radiating at very low Eddington ratios (e.g., for NGC4258, Lasota et al. 1996). In ADAF models at low mass accretion rates () the X-ray emission has a significant thermal bremsstrahlung contribution produced by the electrons in the flow, at K; this corresponds to a very flat power law () up to several tens of keV. As gradually approaches and exceeds the ADAF model predicts that inverse Compton scattering of soft synchrotron photons by the flow electrons will dominate the X-ray emission more and more. This second regime of the model is required to be at work for M81, in order to explain the steep spectral shape revealed by (Sect. 3.3.1; this is possible when assuming a radiative efficiency ).
In conclusion, the origin of the power law emission is an open question. From X-ray, UV and optical observations there is no evidence for an accretion disk, and the conditions for an ADAF are satisfied, but the slope of the X-ray continuum is very similar to that of bright Seyfert galaxies, and it remains to be investigated whether it can be reproduced by an ADAF.
4.3 Comparison with ASCA results on LINERs
How common are the results presented here among LINERs? On the basis of data, a canonical model was found to work for LLAGNs, LINERs and starburst galaxies by Ptak et al. (1999). This model consists of a soft component of keV, usually spatially extended and with absorption consistent with the Galactic value, plus a power law of mean , with small or no intrinsic absorption, or another thermal component of keV. This model turned out to be successful also in the case of the detailed study of the LINERs NGC4579 (Terashima et al. 1998) and NGC4736 (Roberts et al. 1999). The results obtained here from data are in agreement with this canonical model, with the addition that we can firmly establish that a power law is to be preferred to the hard thermal component. The presence of a 6.7 keV gaussian line, and no evidence of a 6.4 keV line, was also found from data for the LINERs NGC4579 (Terashima et al. 1998) and NGC4736 (Roberts et al. 1999). The EWs turned out to be larger than found here for M81 ( eV, and eV respectively).
Also the absence of rapid variability on timescales less than a day, a likely case for the nucleus of M81 (Petre et al. 1993), seems to be a general property of the LINERs observed with ROSAT and , while changes in the X-ray luminosity over long timescales are not uncommon (Reichert et al. 1994, Ptak et al. 1998). This has been interpreted in terms of an ADAF being at work (Ptak et al. 1998).
5 Conclusions
The (0.1–100) keV study of M81 based on data has revealed the presence of a power law component, of emission and absorption features due to highly ionized iron, and short term variability with a period of days. These characteristics point to the presence of a LLAGN, as suggested by I96 based on data. Differences and similarities with the X-ray spectra of more luminous Seyfert galaxies have been investigated.
The main result of the present work is that a 6.7 keV emission line, corresponding to K emission from He-like iron, is clearly detected (confirming a previous result) together with an absorption edge at keV, due again to highly ionized iron. The ionization level is consistent for the line and the edge, and perhaps the same is true also for the column density of ionized material. So, we suggest that line and edge are produced by a highly ionized absorber, that could be located within cm from the source of ionizing photons. Such an optically thin gas that transmits the X-ray photons represents a similarity with the warm absorber in Seyfert 1’s.
Concerning the main spectral property of the continuum, data reveal the presence of a single power law of photon index in the (0.1–100) keV energy band. This is modified by cold absorption of cm-2, that could be entirely produced by the Galactic hydrogen column density plus some intrinsic corresponding to the reddening observed for the broad line region. The value, and the absence of high intrinsic absorption, suggest that M81 might be an example of a low luminosity Seyfert 1. However, there are also differences with the X-ray properties of Seyfert 1’s: there is no sign of reflection from optically thick cold material, like the 6.4 keV emission line and the broad bump peaking at 10–20 keV. Even a blue bump is absent in the spectral energy distribution of the nucleus of M81, all this suggesting that this nucleus cannot be considered a simple extension to low luminosities of classical Seyfert 1’s.
Alternatively to the standard accretion disk scenario, the continuum could be produced by an ADAF. This hypothesis is consistent with the low accretion rate inferred from the luminosity and the estimate of the central black hole mass; it remains to be investigated whether the ADAF scenario can reproduce a Seyfert-like power law with over 0.1–100 keV for M81.
Acknowledgements.
This research has made use of SAXDAS linearized and cleaned event files (rev0) produced at the BeppoSAX Science Data Center. We are grateful to G. Fabbiano and N. Iyomoto for showing us their results in advance of publication, and to H. Netzer, F. Nicastro and T. Di Matteo for discussions. ASI and MURST (contract CoFin98) are acknowledged for financial support.References
- (1) Beck R., Klein U. , Krause M. 1985 A&A 152 p. 237
- (2) de Vaucouleurs G., de Vaucouleurs A., Corwin Jr. H.G., et al. 1991, Third Reference Catalogue of Bright Galaxies. Springer Verlag, New York.
- (3) Bietenholz M. F., Bartel N., Rupen M.P., et al. 1996, ApJ 457, 604
- (4) Boella G., Butler R.C., Perola G.C., et al. 1997a, A&AS 122, 299
- (5) Boella G., Chiappetti L., Conti G., et al. 1997b, A&AS 122, 327
- (6) Boller T., Meurs E.J.A., Brinkmann W., et al. 1992, A&A 261, 57
- (7) Cappi M., Persic M., Bassani L., et al. 1999, A&A 350, 777
- (8) Cash W. 1979, ApJ 228, 939
- (9) Chiappetti L., Dal Fiume D. 1997, in: Scarsi L., Maccarone M.C. (eds.) Proceedings of 5th International Workshop on Data Analysis in Astronomy
- (10) Elvis M., van Speybroeck L. 1982, ApJ 257, L51
- (11) Fabbiano G. 1988, ApJ 325, 544 (F88)
- (12) Filippenko A. V., Sargent W. L. W. 1988, ApJ 324, 134
- (13) Fiore F., Guainazzi M., Grandi P. 1999, ”Handbook for NFI spectral analysis” (http://www.tesre.bo.cnr.it/Sax/software/)
- (14) Freedman W. L., Hughes S.M., Madore B.F., et al. 1994, ApJ 427, 628
- (15) Frontera F., Costa E., Dal Fiume D., et al. 1997, A&AS 122, 357
- (16) Ho L.C. 1999, ApJ 516, 672
- (17) Ho L. C., Filippenko A. V., Sargent W. L. W. 1996, ApJ 462, 183
- (18) Ho L. C., Filippenko A. V., Sargent W. L. W., Peng C. Y. 1997, ApJS 112, 315
- (19) Ishisaki Y., Makishima K., Iyomoto N., et al. 1996 PASP 48, 237 (I96)
- (20) Iyomoto N. 1999, PhD Thesis, University of Tokyo
- (21) Iyomoto N., Makishima K., Fukazawa Y., Tashiro M., Ishisaki Y., et al. 1997, PASJ 49, 425
- (22) Kallman T.R., McCray R. 1982, ApJS 50, 263
- (23) Krolik J.H., Kallman T.R. 1987, ApJ 320, L5
- (24) Lasota J.P., Abramowicz M.A., Chen X., et al. 1996, ApJ 462, 142
- (25) Makishima K. 1985, in “The Physics of Accretion onto Compact Objects”, eds. K.O. Mason, M.G. Watson and N.E. White. (Berlin: Springer-Verlag), p.249
- (26) Malina R., Lampton M., Bowyer S. 1976, ApJ 209, 678
- (27) Matt G., Fabian A.C., Ross R.R. 1993, MNRAS 262, 179
- (28) Nandra K., Pounds K.A. 1994, MNRAS 268, 405
- (29) Narayan R., Yi I. 1995, ApJ 452, 710
- (30) Ohashi T., et al. 1992, in “Windows on Galaxies”, eds. G. Fabbiano, J. Gallagher, and A. Renzini. (Dordrecht: Kluwer Academic Press), p. 243
- (31) Parmar A.N., Martin D.D.E., Bavdaz M., et al. 1997, A&AS 122, 309
- (32) Peimbert M., Torres-Peimbert S. 1981, ApJ 245, 845
- (33) Petre R., Mushotzky R. F., Serlemitsos P.J., Jahoda K., Marshall F.E. 1993, ApJ 418, 644
- (34) Ptak A., Yaqoob T., Mushotzky R., Serlemitsos P., Griffiths R. 1998, ApJ 501, L37
- (35) Ptak A., Serlemitsos P., Yakoob T., Mushotzky R. F. 1999, ApJS 120, 179
- (36) Reichert G.A., Mushotzky R.F., Filippenko A.V. 1994, The first ROSAT science symposium, ed. E.M. Schlegel and R. Petre (New York: AIP), p.85
- (37) Reynolds C.S., Fabian A.C. 1995, MNRAS 273, 1167
- (38) Roberts T.P., Warwick R.S., Ohashi T. 1999, MNRAS 304, 52
- (39) Ross R.R., Fabian A.C., Young A.J. 1999, MNRAS 306, 461
- (40) Serlemitsos P., Ptak A., Yakoob T. 1996, The Physics of Liners, ASP Conf. Ser., eds. M. Eracleous, A. Koratkar, C. Leitherer, and L. Ho, (Baltimore: STScI), p.70
- (41) Shakura N.I, Sunyaev R.A. 1973, A&A 24, 337
- (42) Stark, A.A., Gammie, C.F., Wilson, R.W., Bally, J., Linke, R.A., Heiles, C., and Hurwitz, M. 1992, ApJS 79, 77
- (43) Svensson R. 1996, A&AS 120, 475
- (44) Terashima Y., et al. 1998, ApJ 503, 212
- (45) Terlevich R., et al. 1992, MNRAS 255, 713
- (46) Turner T.J., Done C., Mushotzky R., Madejski G., Kunieda H. 1992, ApJ 391, 102
- (47) ycki P.T., Czerny B. 1994, MNRAS 266, 653
- (48)