Ly Emission from a Lyman Limit Absorber at z=3.036 ††thanks: Based on observations collected at the European Southern Observatory, La Silla, Chile (ESO project No. 60.B-0843).
Abstract
Deep, 17.8 hours, narrow band imaging obtained at the ESO 3.5m New Technology Telescope has revealed extended (galaxy sized) Ly emission from a high redshift Lyman limit absorber. The absorber is a z zem Lyman limit absorber seen in the spectrum of Q1205-30 at zem=3.036. The Ly luminosity of the emission line object is 12–14 1041 h-2 erg s-1 for =1. The size and morphology of the Ly emitter are both near–identical to those of a previously reported emission line object associated with a DLA at z=1.934 (Fynbo et al. 1999a), suggesting a close connection between Lyman limit absorbers and DLAs.
We also detect six candidate Ly emitting galaxies in the surrounding field at projected distances of 156–444h-1 kpc with Ly luminosities ranging from 3.3 to 9.5 1041 h-2 erg s-1 for =1. Assuming no obscuration of Ly by dust this corresponds to star formation rates in the range 0.3 – 0.9 h-2 M☉ yr-1. Comparing this to the known population of high redshift Lyman break galaxies, we find that the Lyman break galaxies in current ground based samples only make up the very bright end of the high redshift galaxy luminosity function. A significant, and possibly dominating, population of high redshift galaxies are not found in the ground based Lyman break surveys.
Key Words.:
Galaxies : formation – quasars : absorption lines – quasars : Q1205-301 Introduction
The amount of information about the galaxy population at high redshift () has increased tremendously in the last few years. Using the Lyman-break technique several hundred high redshift star forming galaxies, Lyman-break galaxies (LBGs), have been detected and studied with imaging and spectroscopy (Steidel et al. 1996). It is, however, not yet known how complete the Lyman-break technique is in detecting high redshift galaxies.
An independent route along which to study the galaxy population at high redshift is via the high column density QSO absorption lines systems. The advantage of high column density QSO absorption lines systems is that a wealth of information on the chemical evolution can be and has been obtained by studying the metallicity and dust content of the absorbers from high resolution spectroscopic studies of the background QSOs (e.g. Lu et al. 1996). However, the spectroscopic studies will not tell us anything about the emission properties of the absorbing galaxies.
Only when combining the information obtained from the LBG-studies (e.g. the luminosity function of LBGs), the absorption line statistics for QSO absorption lines systems and the properties of galaxy counterparts of QSO absorption lines systems can we hope to disentangle the observational selection biases which each of the different studies suffer from and obtain a more complete insight into the nature of the high redshift galaxy population.
The absorption line systems with the highest HI column density, cm-2, are the Damped Ly Absorbers (DLAs, Wolfe et al. 1986)111When comparing absorbers to statistical samples of DLA absorbers, it is important that they meet this N(HI) criterion. However, some authors also refer to absorbers with cm-2 as DLAs, e.g. Lanzetta et al. 1997.. Such high HI column densities are at low redshift only found in the disks of spiral galaxies. It it also interesting to note, that active star formation in spiral galaxies only occurs when the HI column density of the disk exceeds (Kennicutt 1989). For these reasons, DLAs are widely believed to trace the central parts of forming galaxies. Much telescope time has been dedicated to the narrow band imaging of DLAs over the past decade (e.g. Lowenthal et al. 1995 and references therein), but so far resulting in only two confirmed detections for the DLAs towards PKS0528-250 (Møller & Warren 1993a,b; Warren & Møller 1996), and Q0151+048A (Møller et al. 1998a; Fynbo et al. 1999a) In addition a spectroscopically confirmed broad band detection of the DLA towards DMS2247-0209 (Djorgovski 1998) and a purely spectroscopic detection of Ly emission from the DLA towards Q2059-360 have been reported (Pettini et al. 1995, Leibundgut & Robertson 1998), as well as a number of DLA candidates, which have not yet been confirmed by spectroscopy (Steidel et al. 1994, 1995, Aragón-Salamanca et al. 1996, LeBrun et al. 1997).
QSO absorption line systems with N(HI) larger than a few times cm-2 are optically thick at the Lyman limit and refered to as Lyman Limit Systems (LLSs). Lyman limit absorption is believed to occur in extended gaseous haloes of galaxies, because the neutral hydrogen column density is much larger than in the intergalactic medium and the gas is not predominantly neutral as in DLAs. At low redshifts, where the Lyman limit cannot be observed from the ground, LLS are thought to be traced by MgII absorption, because MgII absorption only occurs in optically thick clouds (Schaeffer 1983). The extensive study of the galaxy counterparts of MgII absorbers presented in Guillemin & Bergeron (1997) shows that MgII absorption predominantly occurs in Sbc or Scd galaxies, but that the objects range from ellipticals to irregular galaxies. At high redshifts the Lyman Break technique were originally used to look for galaxies responsible for Lyman limit absorption in QSO spectra (Steidel & Hamilton 1992). Two candidates were found in six fields (Steidel et al. 1995), but for only one of these, the LLS towards Q2233+131, has confirming spectroscopy been published (Djorgovski et al. 1996).
Three out of the four confirmed high redshift DLAs that have been detected in emission at present are at approximately the same redshift as the background QSO. In order to examine whether systems indeed are more active emitters (e.g. due to induced star formation or to photoionisation by the QSO; for the suggested mechanisms see Møller & Warren 1993b and Fynbo et al. 1998a) we have initiated a programme aimed at studying the galaxy counterparts of this special subgroup of high column density QSO absorption line systems. As part of this programme we chose to study the quasar Q1205-30 of which a spectrum published by Lanzetta et al. (1991) shows the presence of a strong LLS close to the emission redshift of the QSO. The redshift of the quasar is .
In Sect. 2 of this paper we describe the observations obtained with the ESO New Technology Telescope (NTT) and the basic data reduction. In Sect. 3 we discuss the photometry, the selection of Ly emission line candidates, and the correction for the quasar point spread function. In Sect. 4 we discuss our results. We adopt a Hubble constant of 100h-1 km s-1 Mpc-1 and assume =1 and =0 unless otherwise stated.
2 Observations and Data Reduction
A spectrum of the quasar Q1205-30 can be found in Lanzetta et al. (1991), but its celestial coordinates were never made publicly available. To obtain an image we therefore had to “rediscover” Q1205-30 on a copy of the prism plate UJ9085P kindly made available to us from the UK Schmidt Telescope Objective Prism Survey (for details of the procedure see Fynbo et al. 1999b). Celestial coordinates of Q1205-30 are RA 12 05 35.72, Dec -30 14 25.8 (1950).
Deep imaging of the field was subsequently carried out in NTT service mode (Silva & Quinn 1997, Silva 1998, Woudt & Silva 1999). The field was imaged through standard B and Bessel I filters, as well as through a special 20Å (fwhm) narrow band filter manufactured by Custom Scientific. The narrow band filter (CS 4906/20) is centred at 4906Å, which is the wavelength of redshifted Ly at . The service mode data were obtained with the ESO Multi-Mode Instrument (EMMI) on the NTT during several nights of January, February and March, 1998. The CCD used in the red arm of EMMI was a SITe TK2048 with a pixel scale of 0.27 arcsec. The blue arm CCD was a SITe TK1024 with a pixel scale of 0.35 arcsec. The total integration times in each filter and the seeing in each of the combined frames are given in Table 1.
| Filter | Combined fwhm | Exposure Time | Pixel scale |
|---|---|---|---|
| (arcsec) | (sec) | (arcsec/pixel) | |
| CS 4906/20 | 1.4 | 64000 | 0.35 |
| B | 1.3 | 3600 | 0.35 |
| I | 0.96 | 5600 | 0.27 |
Landolt (1992) photometric standards and three spectrophotometric standard stars Eggr99, Feige 56 and L970 were used for the photometric calibrations.
I–band imaging was obtained with the red arm of EMMI. The CCD in the red arm of EMMI can be read in either single port (D only) or dual port (A + D) read–out mode. Unfortunately it showed up that for our programme a mix of single and dual port read–out had been employed, and we had to follow a somewhat complex reduction procedure to make up for this.
The disadvantage of the single port read–out is the longer read time required (which is particularly a problem while obtaining twilight flats). The disadvantage of the dual port read–out is that the bias level, the gain (and drift of the gain), and the readout noise are different for the two image sections. Also the locations of traps (bad columns) depend on the direction of charge transfer along the columns. In particular the section read through port A has more bad columns than the same section read through port D. The I–band science exposures of Q1205-30 were read out using dual port read–out, whereas the exposures of standard stars were read out using single port mode only. This mixed mode operation requires 2 sets of biases, as well as two sets of flat fields, and two different ways of reducing the images. Twilight flats were only obtained for single port mode (appropriate for the standard star exposures), while dome flat were taken with dual port read–out (appropriate for the science frames). The dual read exposures were treated as if the A and D subsections were two individual frames. Finally, bias frames, flat field exposures, and science exposures were pasted together to form 2048x2046 frames. The subsequent flat-fielding was done in the usual way.
The CCD in the blue arm of EMMI can be read in single port mode only. All science frames obtained with the blue arm of EMMI (all B–band and narrow band data) were bias–subtracted and flat–fielded using standard routines.
Following the basic reduction the images in each of the three filters were combined employing the code described in Møller & Warren (1993a). This code optimizes the signal–to–noise for faint objects in the field, for which the noise is well understood via propagation of read–out–noise and photon shot noise.
All magnitudes quoted in this paper are on the AB system. The narrow band data were calibrated directly onto the AB system using the spectrophotometric standard stars, and these magnitudes are denoted . We found that the colour terms for both the I and B filters were consistent with zero, hence we use the equations and (Fukugita et al. 1995) to put the broad band magnitudes onto the AB system. Details of the sky brightness and sky noise in the combined images are provided in Table 2.
| passband | sky | rms SB |
|---|---|---|
| magAB. arcsec-2 | magAB. arcsec-2 | |
| n(AB) | 21.9–22.4 | 27.9 |
| B(AB) | 22.5 | 28.5 |
| I(AB) | 19.7 | 27.5 |
We reach limiting magnitudes (5) of n(AB)=25.0, B(AB)=25.8 and I(AB)=25.1. A narrow band AB magnitude of 25.0 corresponds to a Ly flux of erg s-1 cm-2.
3 Results
A contour plot of the combined I–band image of the 315x315 arcsec2 field surrounding Q1205-30 is shown in Fig. 1. Q1205-30 itself is here marked by a ‘q’ and an arrow. The star from which the central core of the Point Spread Function was defined (see Sect. 3.1) is marked ‘PSF’. Six candidate Ly emitting galaxies (see Sect. 3.3) are marked “+”.

3.1 Objects near the line of sight towards Q1205-30
Q1205-30 was selected for observation because of the high column density absorber seen along the line–of–sight towards it. Previous detections of high column density absorbers (for a recent summary see Møller & Warren 1998) suggest that their absorption cross–section is very small, and that emission from the object therefore likely will be hidden under the quasar PSF. To search for emission from the absorbing object we therefore performed a careful PSF subtraction as detailed in this section.
The basic principles of the PSF subtraction are as described in Møller & Warren (1993a), and Fynbo et al. (1999a). For a first approximation to the PSF we used the star marked ‘PSF’ in Fig. 1. This is the nearest unsaturated point source significantly brighter than Q1205-30, but as is evident from Fig. 1 it has four nearby neighbour objects (projected distances in the range 4–9 arcsec). The signature of those four objects does not affect the core of the PSF. Their effect on the halo of the PSF was masked out and removed via substitution of the masked regions by areas selected from scaled high S/N halos from isolated point–sources brighter than the PSF–star (and hence saturated in the central core). The comparatively large projected distances (4 arcsec and larger) means that the presence of those objects, even if not corrected for, would not in any case have had any effect for the results reported below.
The DAOPHOT-II (Stetson 1997) extension ALLSTAR was used to perform the final PSF model fit and subtraction. Identical procedures were followed for the PSF subtraction in all combined images: Narrow band, B and I.


In Fig. 2 we show a 18x18 arcsec2 cut–out of the I–band image centred on Q1205-30 before (a) and after (b) subtraction of the quasar PSF. The quasar is marked “q”, and it is clearly seen that two faint galaxies (named g1 and g2) were blended with the quasar PSF. In Fig. 2(b) we have drawn a circle of radius 1.3 arcsec around the centre of the subtracted PSF. Inside this circle the large residuals (not shown) from the PSF subtraction make it impossible to search for objects. The galaxy g2 is well separated from the PSF–subtraction residuals so its projected distance from Q1205-30 (2.8 arcsec) is well determined. In contrast, g1 is partly embedded in the residuals. The galaxy g1 could therefore in reality be an elongated object extending across the quasar, and the measured projected distance (2.2 arcsec) is hence an upper limit to the true projected distance. The measured I–band centroids of the galaxies g1 and g2 are marked by an “” in Fig. 2(b).
In Fig. 3(a,b) we show the same 18x18 arcsec2 cut–out of the B–band image. Here we have drawn a circle of radius 1.5 arcsec, again to mask out the area where PSF subtraction makes it impossible to search for objects. The “”s here again mark the centroids of the galaxies g1 and g2 as measured on the I–band image. In the B–band image g1 is found at the same projected distance as in the I–band image while the extremely red object g2 is not detected.


In Fig. 4(a,b) we again show the same 18x18 arcsec2 cut–out as above, but here from the combined narrow band frame. The “”s here again mark the centroids of the galaxies g1 and g2 as measured on the I–band image. In this image we clearly see an extended object (named S6) to the north of the quasar, possibly extending all the way to the east of the quasar. Note that g1 here is found at a slightly larger projected distance from the quasar than in the I–band and B–band images. This illustrates the point we made above that the PSF subtraction will tend to “push” the object out at a larger distance, because part of the object is embedded in the non–recoverable central part of the PSF. This will then also impact the photometry, as the total flux of the object will be underestimated. The position of g2 (marked by ’’ and a dotted circle) corresponds to a faint protrusion on the extended object. Since the narrow band is within the B passband, we would indeed expect to see only very weak emission from the extremely red object g2.
| Object | B(AB) | I(AB) | n(AB) | Apert. |
|---|---|---|---|---|
| (arcsec2) | ||||
| q | 18.92 | 18.13 | 18.28 | 60 |
| S6 A | 22.90 | 19 | ||
| S6 B | 23.10 | 19 | ||
| g1 | 9.6 | |||
| g2 | 9.6 |
3.2 Photometry of objects near the QSO line of sight.
In this subsection we describe the photometry on Q1205-30, g1, g2 and S6 in the three filters B, I and narrow band. For g1 we measured the flux inside a circular aperture of diameter 3.5 arcsec. The resulting magnitudes presented in Table 3 will be somewhat underestimated since we miss the flux closer than 1.5 arcsec from the QSO. For g2 we also measured fluxes in circular apertures of diameter 3.5 arcsec. We did not detect g2 in B, and hence provide the 2 detection limit. The galaxy g2 is very red, consistent with being an old stellar population at a redshift of about 0.5 or more. In Sect. 4.1 we discuss the possible effects of g2 on the line of sight due to gravitational lensing. In the narrow band image we can not in an objective way determine whether the flux detected at the position of g2 originates from g2 or from S6. Hence we chose to consider two extreme cases for the photometry of S6 and g2 in the narrow filter.
In model A (minimum Ly flux model; Fig 4a) we subtracted the maximum flux we can possibly ascribe to g2 in the narrow band. We used a model of g2 obtained by smoothing the I band image of g2 to the seeing of the narrow band image, and then determined the maximal scaling of this model which after subtraction left residuals consistent with the noise. The remaining flux, making no correction for flux from S6 within the central core of the subtracted quasar PSF, was assigned to S6. In model B (maximum Ly flux model; Fig 4b) we assumed that all the flux seen north and east of Q1205-30 originates from S6 and not from g2. In order to estimate the flux within the central core of the quasar PSF we assumed that S6 is symmetric about its major axis (PA 120∘ east of north). A model of S6 was made as follows. First we flipped the image of S6 around its major axis. In the PSF subtracted image we then replaced the region inside radius 1.5 arcsec from the quasar PSF with the flipped image. The flux of the model was measured using a circular aperture of diameter 4.9 arcsec.
The impact parameter of S6 was found to be 1.8 arcsec in model A and 1.5 arcsec in model B. The Ly flux of S6 is 6.60.6 ergs s-1 cm-2 (model A) and 7.90.7 ergs s-1 cm-2 (model B).
3.3 Candidate Ly emitting galaxies in the field

The “narrow minus on–band–broad” versus “narrow minus off–band–broad” colour/colour plot technique (Møller & Warren, 1993a; Fynbo et al. 1999a) has proven a powerful tool to identify galaxies in the faintest end of the high redshift galaxy luminosity function (LF). We here describe the search procedure and the photometric measurements carried out with the aim to produce the plot shown in Fig. 6.
Identification and photometric measurements of objects in the field was done with the photometry package SExtractor (Bertin and Arnouts, 1996). We used a minimum object extraction area of 8 pixels and a detection threshold of 1.3 above the background. As our detection image we selected to use a weighted average of the three combined frames. The weights were chosen to be the inverse of the variance in each of the combined frames. As a detection filter we used a Gaussian filter with a full-width-at-half-maximum (fwhm) of 4 pixels similar to the fwhm of point sources in the detection image, which is 3.4 pixels.
In total we detected 473 objects with a signal–to–noise ratio (S/N) in the narrow band. In Fig. 6 we show the colour–colour diagram versus for the entire sample. In this diagram objects with Ly emission in the narrow band filter will be located in the lower left corner while objects with absorption in the narrow filter will be located in the upper right hand corner. Since our narrow filter is centred at 4906Å, which is in the red wing of the B filter, the colour of an object will depend on the slope of the objects spectral energy distribution. Very red objects will, therefore, appear to have a slight excess emission in the narrow band, causing the locus of continuum sources to be slightly tilted towards the lower right of the diagram.
We determined the expected region for objects with no special feature in the narrow band by calculating the position in this diagram for a wide range of galaxy spectral energy distributions taken from the models of Bruzual & Charlot (1993) The galaxy models were calculated for several redshifts in the range to , and were corrected for Ly line blanketing due to intervening absorbers (Møller & Jakobsen 1990). The resulting region is indicated by the dotted line in Fig. 6.
Inspection of Fig. 6 clearly shows that the vast majority of the detected objects indeed conform to the predicted colours. Three objects to the lower left are, however, found to lie significantly outside the locus of continuum objects. All three are found in the region expected for blue objects with an emission line in the narrow filter.
The detection limit in the combined image used for object detection is dominated by the deeper broad band images. Faint objects with large equivalent width Ly emission might therefore be missed by the detection algorithm. To make up for this we repeated the detection procedure, but this time using the narrow band image for detection. SExtractor found six emission line objects with S/N. Three of those were the ones reported already from the combined image detection, while the other three remain undetected in broad band.
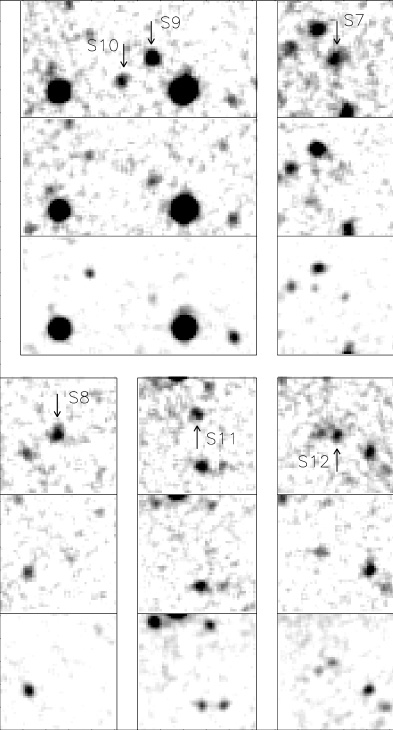
In addition to S6 we hence detect a total of six emission line objects at S/N. The positions of the six objects are marked by crosses in Fig. 1. Image cut–outs showing the 6 objects in each of the three bands are reproduced in Fig. 7. Photometric properties of the emission line objects are reported in Table 4. Magnitudes were measured using both SExtractor isophote apertures and large circular apertures. Emission line fluxes corresponding to the measured n(AB) aperture magnitudes range from erg s-1 cm-2 to erg s-1 cm-2.
| Object | n(AB) | B(AB) | I(AB) | Ly flux | EWrest | SFR |
|---|---|---|---|---|---|---|
| Isophote | 10-17 ergs s-1 cm-2 | Å | h-2 M☉ | |||
| S7 | 24.130.14 | 25.80.3 | 25.00.3 | 2.560.33 | 20 | 0.400.05 |
| S8 | 24.460.15 | 26.9 | 26.0 | 1.890.26 | 45 | 0.300.04 |
| S9 | 23.430.09 | 25.30.2 | 24.90.3 | 4.880.40 | 256 | 0.770.06 |
| S10 | 24.780.18 | 27.0 | 26.1 | 1.410.23 | 36 | 0.220.04 |
| S11 | 24.830.18 | 27.0 | 26.2 | 1.340.22 | 34 | 0.210.04 |
| S12 | 24.960.19 | 27.1 | 26.3 | 1.190.21 | 33 | 0.190.03 |
| Aperture | (3.5 diameter) | |||||
| S7 | 23.90 | 25.50.3 | 25.00.3 | 3.170.39 | 186 | 0.500.06 |
| S8 | 23.90 | 26.1 | 25.6 | 3.160.39 | 35 | 0.500.06 |
| S9 | 23.32 | 25.20.2 | 24.60.2 | 5.400.37 | 256 | 0.850.06 |
| S10 | 24.33 | 26.1 | 25.6 | 2.130.42 | 22 | 0.340.07 |
| S11 | 24.42 | 26.1 | 25.6 | 1.960.42 | 20 | 0.310.07 |
| S12 | 24.45 | 26.1 | 25.6 | 1.900.42 | 19 | 0.300.07 |
As seen in the insert in the upper left corner of Fig. 6, Q1205-30 has only a slight excess emission in the narrow band filter which covers Ly of the quasar also. The weakness of this excess emission is the result of the blue wing of the Ly emission line of the QSO being absorbed partly by the Lyman limit absorber.
4 Discussion and Conclusions
4.1 The Lyman Limit Absorber
We have detected an object, S6, with extended line emission north and east of the quasar Q1205-30. The emission line of S6 is detected in a narrow band tuned to Ly of a Lyman Limit absorber in front of Q1205-30, and the most likely interpretation is, that we see the Lyman Limit absorber in Ly emission. Spectroscopic follow–up is required to confirm this tentative conclusion. The large residuals from the PSF subtraction of the quasar introduce errors in both the total line luminosity observed, and the impact parameter. We have therefore considered two extreme cases described in Sect. 3.2; the minimal Ly flux case (model A) and the maximal Ly flux case (model B). For the Ly luminosity and the impact parameter in the two models we find L=11.61.1 1041 h-2 erg s-1(14.11.3 1041 h-2 erg s-1) and d=6.5 h-1 kpc (5.4 h-1 kpc) for model A (model B). In the following we will assume the more likely model B to be correct. Fynbo et al. (1999a, their Table 4) lists the Ly line luminosities of the known galaxy counterparts of high redshifts DLAs and LLSs, namely the DLAs towards PKS0528-250 (named S1), Q0151+048A (named S4) and Q2059-360, and the LLS towards Q2233+131. The observed Ly line luminosity of S6 is within the range 1.1–12 1042 h-2 erg s-1 of these other systems.
The size of the line emission region is 64 arcsec2 corresponding to 2214 h-2 kpc2 at z=3.036. This size and the morphology of S6 are both near–identical to those of the emission line object S4, which has been shown in a spectroscopic study (Møller et al. 1998) to be a DLA galaxy unrelated to the underlying quasar. Before the precise systemic redshifts of both the QSO and S6 have been measured we cannot exclude that S6 is related to Q1205-30.
From neither S4, nor S6, do we detect what is obviously continuum emission from a high redshift galaxy. This, however, is not surprising as continuum emission from the high redshift DLA galaxy S1 was not detected in the deep ground based images of S1 (Møller & Warren, 1993a), but a compact galaxy was subsequently found in the HST images (Møller & Warren 1998). Since the impact parameters of S1, S4, and S6 are similar, clearly HST imaging is required to resolve the question of their continuum morphology.
Both the comparatively large luminosity and the extended morphology of S6 is in contrast to six faint and compact emission line galaxies (S7–S12) found at much larger distances from the quasar. We hence consider it likely, as in the case of Q2059-360 (Leibundgut & Robertson 1998, Fynbo et al. 1999a), that the emission from S6 is significantly influenced by the proximity of the active nucleus. It is, however, possible that gravitational lensing by the red galaxy g2, if it is a foreground elliptical galaxy, makes S6 appear more extended and increases its observed flux. Here we estimate the likely strength of this effect.
Assuming that g2 is at z=0.5 and has an isothermal mass profile with a velocity dispersion of 300 km s-1, the radius of its Einstein ring is given by
where and are the proper angular diameter distances between g2 (Lens) and S6 (Source) and between the earth and S6 respectively, in the assumed cosmology. Gravitational lensing in this simple model moves S6 and Q1205-30 by an angle in the radial direction away from g2 causing a tangential stretching of S6 as well as an increase of the observed impact parameter of S6 relative to Q1205-30 by a factor of =2.3 (where =2.8 arcsec is the observed impact parameter of g2 relative to the QSO). The magnification of the flux of S6 would be in the range 2–10 depending on the unknown size and orientation of the diamond caustic of g2. A possible counter image on the eastern side of g2 would make S6 look more extended in the relatively low resolution of the narrow band image, in the direction of the observed elongation which would be of order 2.
4.2 The field population of Ly emitting galaxies
The presence of the six emission line galaxies S7–S12 in the field of Q1205-30 is interesting for several reasons. The faintness of the broad band magnitudes of the objects makes it unlikely that they are low redshift (z 0.31) galaxies with Oxygen emission lines in the narrow filter. The most likely identification of the emission lines is Ly at the same redshift as the Q1205-30 LLS absorber, and in what follows we shall assume this to be the case.
Only one of the six emission line galaxies (S9) would have been selected as an LBG in current ground based programmes. The remaining five are too faint in the broad bands (see Table 4). The number of LBGs brighter than R(AB)=25.5 with redshifts between 3.0 and 3.5 selected from ground based surveys is 0.40.07 galaxies arcmin-2 (Steidel et al. 1996), and we hence expect 11 in our 27.6 arcmin2 field. Assuming that LBGs have redshifts uniformly distributed between 3.0 and 3.5 we would expect on average 0.4 LBGs within the redshift range corresponding to the width of the narrow filter. In the Hubble Deep Field North the LF of LBGs has been extended to R(AB)=27 (Steidel et al. 1999). Integrating this LF leads to an expected number of LBGs of about 0.3 galaxies arcmin-2 within the redshift range or on average 9 in our 27.6 arcmin2 field (see Sect. 4.2 in Fynbo et al. (1999a) for a discussion on the relation between the redshift density of DLAs and the LF of LBGs). Hu et al., 1998, have reported on detections of Ly emitting galaxies by means of narrow band imaging and long slit spectroscopy in random fields with densities about 4 arcmin-2 per unit redshift down to similar depths in observed flux as in our sample, but at somewhat higher redshifts.
Hence, narrow/broad band Ly imaging indicate the existence of a significant population of high redshift galaxies that is not included in current ground based LBG samples and which is possibly identical to the faint LBGs detected by HST. Those galaxies, which make up the faint end of the high redshift galaxy LF, have large Ly equivalent widths and are about a factor of 10 more numerous than the bright LBGs of current ground based samples. This result is in good agreement with our earlier conclusion based on searches for DLA galaxies (Møller & Warren 1998; Fynbo et al., 1999a) that there is a significant population of faint high redshift galaxies which, despite their very small HI absorption cross–section, make up most of the high redshift DLA absorbers.
Total Ly luminosities for S7–S12 are in the range 3.3–9.5 1041 h-2 erg s-1 for =1.0 and 12–34 1041 h-2 erg s-1 for =0. Using the Kennicutt (1983) prescription SFR = L(H)/1.12 1041 erg s-1 and assuming L(Ly)/L(H)=10 and negligible dust extinction, we find star formation rates in the range 0.2 – 0.8 h-2 M☉ yr-1 for =1.0 and 1.1–3.0 h-2 M☉ yr-1 for =0. The large equivalent widths of the emission lines make strong dust obscuration unlikely. The star formation rates for R(AB)25.5 LBGs as estimated from Balmer and OII emission line strengths by Pettini et al., 1998, fall in the range 20 – 270 M☉ yr-1 for =0.2 and h=0.7. For =1.0 this corresponds to 4–55h-2 M☉ yr-1. Hence, the Ly emitting galaxies have star formation rates about an order of magnitude lower than what is measured for the bright LBG population. Nevertheless, since the population of Ly emission line galaxies is much more common that the brighter LBG population, it is still an open question if the integrated SFR is dominated by the faint or the bright end of the high redshift galaxy LF.
As seen in Fig. 1 the faint galaxies are all located in a region north west of the QSO. Their projected impact parameters from Q1205-30 range from 156 to 444 h-1 kpc, and four of the six galaxies are found in a small region of projected size 100 100 h-2 kpc2. As for the compact group S1–S2–S3 associated with a z=2.81 DLA absorber, this compact group of faint galaxies associated with a z=3.036 LLS absorber is destined to merge on a short timescale (Navarro et al. 1995; Haehnelt et al. 1998). This, then, supports the suggestion (Warren & Møller 1996; Møller & Warren 1998) that high redshift, high column density absorbers predominantly are proto–galactic sub–clumps in the process of early galaxy assembly, rather than fully formed large rotating disks.
Acknowledgments
We wish to thank the NTT service observation team for providing us with these excellent data. We thank Jacqueline Bergeron, Tom Broadhurst and Stephen J. Warren for numerous discussions and several useful comments on an earlier version of this manuscript. J.U.F. wishes to thank the UK Schmidt Telescope Unit for generous help in the effort of locating Q1205-30.
References
- (1) Aragón-Salamanca A., Ellis R.S., O’Brien K., 1996, MNRAS 281, 945
- (2) Bertin E, Arnouts S, 1996, A&AS 117, 393B
- (3) Bruzual G.A., Charlot S., 1993, ApJ 405, 538
- (4) Djorgovski S.G,, 1998, In: ’Structure and Evolution of the IGM from QSO Absorption Lines’, ed. Petitjean P., Charlot S., (Editions Frontieres), p.303
- (5) Djorgovski S.G., Pahre M.A., Bechtold J., Elston R., 1996, Nat 382, 234
- (6) Fukugita M., Shimasaku K., Ichikawa T., 1995, PASP 107, 945
- (7) Fynbo J.U, Møller P., Warren S.J., 1998, In: ’Structure and Evolution of the IGM from QSO Absorption Lines’, ed. Petitjean P., Charlot S., (Editions Frontieres), p. 408
- (8) Fynbo J.U, Møller P., Warren S.J., 1999a, MNRAS 305, 849
- (9) Fynbo J.U, Thomsen B., Møller P., 1999b, The Messenger 95, 32
- (10) Guillemin P., Bergeron J., 1997, A&A 328, 499
- (11) Haehnelt M.G., Steinmetz M., Rauch M., 1998, ApJ 495, 647
- (12) Hu E.M., Cowie L.L., McMahon R.G., 1998, ApJ 502, L99
- (13) Kennicutt R.C, 1983, ApJ 272, 54
- (14) Kennicutt R.C., 1989, ApJ 344, 685
- (15) Landolt A.U., 1992, AJ 104, 340
- (16) Lanzetta K.M., McMahon R.G., Wolfe A.M., et al. 1991, ApJS 77, 1
- (17) Lanzetta K.M., Wolfe A.M., Altan H., et al., 1997, AJ 114, 1337
- (18) LeBrun V., Bergeron J., Boiss P., Deharveng, 1997, A&A 321, 733
- (19) Leibundgut, B., Robertson G., 1998, MNRAS 303, 711
- (20) Lowenthal J.L., Hogan G.J., Green R.F., et al., 1995, ApJ 451, 484
- (21) Lu L., Sargent W.L.W., Barlow T.A., Churchill C.W., Vogt S.S., 1996, ApJS 107, 475
- (22) Møller P., Jakobsen P.., 1990, A&A 228, 229
- (23) Møller P., Warren S., 1993a, A&A 270, 43
- (24) Møller P., Warren S., 1993b, In : ”Observational Cosmology” ed. G.L. Chincarini, A. Iovino, T. Maccacaro, D. Maccagni, A. S. P. Conference series, 51, p.598
- (25) Møller P., Warren S., 1998, MNRAS 299, 661
- (26) Møller P., Warren S., Fynbo J.U., 1998, A&A 330,19
- (27) Navarro J. F., Frenk C. S., White S. D. M., 1995, MNRAS 275, 56
- (28) Pettini M., Hunstead R.W., King D.L., Smith L.J., 1995, In: ’QSO Absorption Lines’, ed. Meylan G., (Springer-Verlag), Berlin, p.55.
- (29) Pettini M., Kellogg M., Steidel C.C., et al., 1998, ApJ 508, 539
- (30) Schaeffer J.R., 1983, Ph.D. Thesis, Pittsburgh University
- (31) Silva D., 1998, The Messenger 92, 20
- (32) Silva D., Quinn P., 1997, The Messenger 90, 12
- (33) Steidel C.C., Hamilton D., 1992, AJ 104, 941
- (34) Steidel C.C., Pettini M., Dickinson M., Person S.E., 1994, AJ 108, 2046
- (35) Steidel C.C., Pettini M., Hamilton D., 1995, AJ 110, 2519
- (36) Steidel C.C., Giavalisco M.,Pettini M., Dickinson M., Adelberger K.L., 1996, ApJ 462, L17
- (37) Steidel C.C., Adelberger K.L., Dickinson M., Pettini M., 1999, In the proceedings of the Xth Rencontres de Blois, ”The Birth of Galaxies”, in press
- (38) Stetson P., 1997, ”User’s Manual for DAOPHOT II”
- (39) Warren S., Møller P., 1996, A&A 311,25
- (40) Wolfe A.M., Turnshek D.A., Smith H.E., Cohen R.D., 1986, ApJS 61, 249
- (41) Woudt P.A., Silva D., 1999, The Messenger 95, 18