A Multi-Component Measurement of the Cosmic Ray
Composition
Between eV and eV
Abstract
The average mass composition of cosmic rays with primary energies between eV and eV has been studied using a hybrid detector consisting of the High Resolution Fly’s Eye (HiRes) prototype and the MIA muon array. Measurements have been made of the change in the depth of shower maximum, , and in the change in the muon density at a fixed core location, , as a function of energy. The composition has also been evaluated in terms of the combination of and . The results show that the composition is changing from a heavy to lighter mix as the energy increases.
The source of cosmic rays with particle energies above eV is still unknown. Models of origin, acceleration, and propagation must be evaluated in light of the observed energy spectrum and chemical composition of the cosmic ray flux arriving at the earth. The cosmic ray energy spectrum generally follows a simple power law over many decades of energy. This might lead one to believe that cosmic rays of all energies share the same source. However, there are two detectable breaks in this otherwise smooth spectrum. At an energy of about eV the spectrum softens. At energies above eV it hardens again. These two features, known as the “knee” and “ankle”, suggest that the source of cosmic rays or propagation effects might be changing in these regions. Observations of the mass composition as a function of energy may provide a path to further understanding.
Several experiments have attempted to determine the mean cosmic ray composition through the knee region of the spectrum. While the results are not in complete agreement, there is some consensus for a composition becoming heavier at energies above the knee [1], a result consistent with charge-dependent acceleration theories or rigidity-dependent escape models. In the region above the knee, the Fly’s Eye experiment has reported a changing composition from a heavy mix around eV to a proton dominated flux around eV [2]. Muon data from the AGASA experiment show broad agreement with this trend if the data are interpreted using the same hadronic interaction model as in the Fly’s Eye analysis [3, 4].
In this experiment, our measurements are unique in that two normally independent detection techniques are employed simultaneously in the measurement of various aspects of extensive air shower(EAS). We use a hybrid detector consisting of the prototype High Resolution Fly’s Eye (HiRes) air fluorescence detector and the Michigan Muon Array (MIA). We have undertaken to independently measure parameters reflecting the average cosmic ray nuclear composition at energies above eV. The detectors are located in the western desert of Utah, USA at and . The HiRes detector is situated atop Little Granite Mountain at a vertical atmospheric depth of g/cm2. It overlooks the CASA-MIA arrays some 3.3 km to the northeast. The surface arrays are some 150 m below the fluorescence detector at an atmospheric depth of 870 g/cm2.
The HiRes prototype has been described in detail elsewhere [5]. It views the night sky with an array of 14 optical reflecting telescopes. They image the EAS as it progresses through the detection volume. Nitrogen fluorescence light (300–400 nm) is emitted at an atmospheric depth in proportion to the number of charged particles in the EAS at that depth, . Part of this shower development profile (at least 250 g/cm2 long) can be determined by measuring the light flux arriving at the detector. Assuming to be the Gaisser-Hillas [6] shower developement function and correcting for Cherenkov light contamination and atmospheric sccattering effects one can measure the primary particle energy , and the depth at which the shower reaches maximum size, [7].
MIA [8], consisting of over 2500 m2 of active area distributed in 16 patches of 64 scintillation counters, measures EAS muon arrival times with a precision of 4 ns and records all hits occurring within 4 of the system trigger. MIA records only the identification and firing time of the counters participating in a given event. The average efficiency of MIA counters for detecting minimum ionizing particles was when they were buried, and the average threshold energy for vertical muons is 850 MeV. MIA determines the muon density via the pattern of hit counters observed in the shower [9]. An estimate of the muon density at 600 m from the core, , is then determined by a fit.
It is expected that changes in the mean mass composition of the cosmic ray flux as a function of will be manifested as changes in the mean values of two measurable quantities and . To indicate those changes, a rate of change of with , called the elongation rate, , has been introduced. Similarly for muons, we define a power law index for as a function of , called the “ content index”, , in this study. Hence:
| (1) |
Assuming that a shower initiated by a nucleus of mass number and energy is a superposition of subshowers each with energy , and where and are for a pure beam of primary nuclei of mass . The values of and are dependent of the hadronic interaction model, but we find them largely independent of in our simulations described below. Therefore, any deviation of our observed elongation rate, and content index, , from those for pure composition imply a changing composition, i.e.
| (2) |
Since the superposition model is not fully realistic, a more reliable comparison between the data and predictions is based on detailed simulation of shower development described below.
HiRes/MIA coincident data were collected on clear moonless nights between Aug. 23, 1993 and Aug. 24, 1996. The total coincident exposure time was 2878 hours corresponding to a duty cycle of 10.2%. 4034 coincident events were observed. The shower trajectory for each event was obtained in an iterative procedure using the information from both HiRes and MIA [10]. HiRes uses its spatial pixel patterns to find the plane in space containing the the detector and the shower axis (the shower-detector plane or SDP), and the time development to find the distance of closest approach . MIA helps to constrain the HiRes fits using its muon arrival time distribution to provide the shower direction within the SDP. The accuracy of the shower axis determination depends on the number of observed muons, the HiRes angular track length, and the core distances from MIA and HiRes. Using its density measurement, MIA also helps to determine the shower core location in the SDP. 2491 events are reconstructed via this procedure. Monte Carlo studies [11] show that over the full energy range studied, the median shower direction error is with a median core location error of 45 m.
We have imposed cuts on the data to remove the poorly reconstructed events and maintain good resolution. The cuts are as follows: triggered HiRes pixels should subtend an angle of at least and view a depth range of at least 250 g/cm2; shower maximum should be bracketed by measurements; the estimated error in shower maximum should be less than 50 g/cm2; the reduced of the shower profile fit should be less than 10; to reduce the influence of direct Cerenkov light, all pixels should view the shower axis at angles larger than ; and the reconstructed shower core should be less than 2000 m from the center of MIA. These cuts leave a sample of 891 events. When determining the from muon data we also require that: the shower core lie between 300 m and 1000 m from MIA; and the number of hit MIA counters should be less than 700 to avoid the saturation of the counters. This more restricted sample contains 573 events.
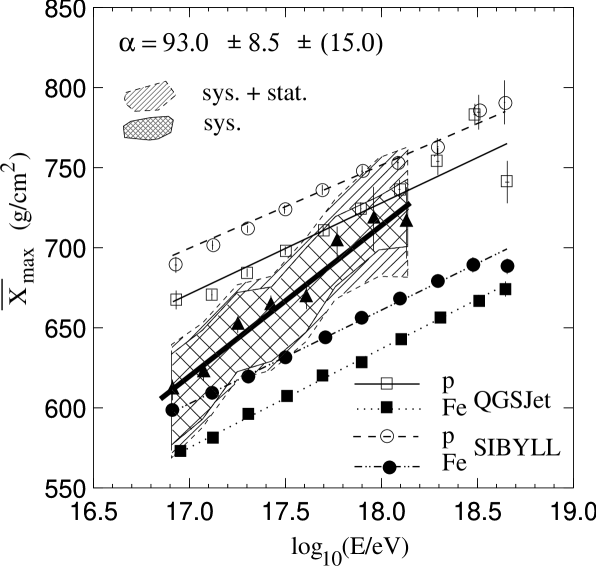
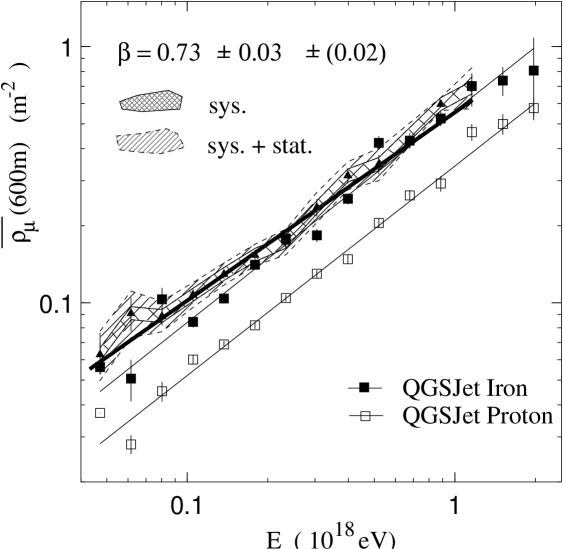
The HiRes data are shown in FIG. 1. We show bands to represent the statistical and systematic uncertainties in the depth of maximum. The measured elongation rate is g/cm2/decade over the energy range from to eV. The MIA data are shown in FIG. 2. The data show a content index of /decade in the same energy range as for the elongation rate. Numbers in the brackets provide the systematic error based on the analysis described below.
The systematic errors on the muon local density result from the uncertainties in the absolute efficiencies of the MIA counters over time. The average efficiency is 80.7% with an RMS of 4.7% over the 16 patches during the time the data were taken. This is the only significant systematic uncertainty associated with . For , we have considered systematic errors in the atmospheric transmission of light and in the production of Cerenkov light. These are related since atmospherically scattered Cerenkov light can masquerade as fluorescence light if not accounted for properly. For atmospheric scattering, there was uncertainty in the aerosol content in the air from night to night. The uncertainty, equivalent to one standard deviation about the mean, is expressed as a range of possible horizontal extinction lengths for aerosol scattering at 350 nm (taken as 11 km to 17 km based on measurements using Xenon flashers) [12] and a range of scale heights for the vertical distribution of aerosol density above the mixing layer (taken as 0.6 km to 1.8 km). For Cerenkov light production, we have systematically varied the angular scale for the Cerenkov emission around the shower axis. The emission angle distribution is related to the angular distribution of the shower particles and the intrinsic Cerenkov emission angle. Both vary with depth in the atmosphere, and at ground level we take the distribution as an exponential function of the angle from the shower axis, with a scale of . Those uncertainties are shown by the shaded areas in FIG 1 & 2.
Another systematic error, that in the determination of energy, is considered to be independent of energy and will therefore have no effect on the values of the measured elongation rate and content index. It will however effect the normalization of the mean depth of maximum or muon size at a particular energy. We estimate that the systematic error in energy is no larger than 25%, made up of an uncertainty in the nitrogen fluorescence efficiency of no more than 20% and a calibration systematic of less than 5%.
Also shown in FIG. 1 and 2 are Monte Carlo simulation results. These full shower simulations have been performed using the CORSIKA package [13], employing QGSJET[14] and SIBYLL[15] hadronic interaction models. We have generated showers of fixed energies and fixed zenith angles in order to parameterize the shape of the shower development profile and the muon content at any energy between eV and eV and at any zenith angle out to . We then pass those showers through a realistic simulation of the detector and generate data to be analyzed by the reconstruction software used for real data. A differential spectrum is assumed. The minimum energy is well below the HiRes/MIA threshold to allow for a study of any threshold effects. Distributions of energy, impact parameter and zenith angle are well predicted by the simulation [11].
After reconstruction, and after applying the same quality cuts as we apply to the real data, we find that a pure proton flux and the QGSJET model gives an elongation rate of g/cm2/decade and a content index of /decade over the range from to eV. For a pure iron composition and the QGSJET model we find corresponding values of g/cm2/decade and the same g/cm2/decade as for protons. Results from SIBYLL show similar elongation rates, but have the approximately 25 g/cm2 deeper than QGSJET. SIBYLL also predicts significantly fewer muons at 600 m for both proton and iron showers. The effect of any triggering and reconstruction biases is very small for , as can be seen in FIG.1 by comparing these reconstructed data (dots) with the “input” (lines) directly from CORSIKA. The application of well chosen cuts has resulted in a bias-free measurement of the elongation rate. However, for muon density measurement, reconstruction effects change the index by 8%. The “input” for the simulation is 0.88 (true QGSJET prediction) for both proton and iron showers. We suspect that the presence of an asymmetry in core distance error can result in a small overestimate of the muon density. It is possible that this effect changes with shower energy.
Data and simulations are clearly inconsistent with each other in both the elongation rate and the content index. It leads support to the hypothesis that the cosmic ray composition is changing towards a lighter mix of nuclei from to eV. HiRes and MIA reach the same conclusion by using different experimental techniques and measuring different physics variables. Substituting the measured and simulated values of and in (2) shows that the result from HiRes and MIA are consistent, with an implied change in of about -0.58 over one decade of energy.
There is a problem with the absolute density of muons at 600 m, with respect to the model predictions. As seen in FIG. 2, the data show values of at the lower energies which are larger than pure iron showers. The comparison with SIBYLL predictions (not shown) is even worse. The reason for this discrepancy is not clear. We have searched for a possible experimental reason for a systematic overestimation of the muon size, and have not found an affect of sufficient magnitude. A change in the energy scale by the maximum estimated systematic error of 25% world lessen the problem but not completely remove it. A shift of 40% is required, which is well beyond the systematic error. such a shift would also produce large discrepancies in the Rp distribution between data and Monte Carlo. We conclude that the model is deficient in muon production. Evidence for this has also been found at lower EAS energies [16]. The local density is consistent with AGASA experiment, e.g. /m2 for this work and /m2 for AGASA [3] at eV. Since models with very different predictions of have very similar content indices, we believe that the content indices are more reliable than the muon normalization.
We can take full advantage of the hybrid nature of our experiment by constructing a parameter which is a combination of the and measurements. Based on the simulation with fully considered shower development and detector responses, a new parameter can be determined by first finding a line in - space which efficiently separates simulated proton and iron showers (FIG. 3(a)). The dimension perpendicular to this line, called , can be defined as -, where refers to the angle between the line and the log axis and is an arbitrary parameter to make for iron and for proton. The value of for a given shower indicates the degree of similarity between the data and either a pure iron or a pure proton event. FIG. 3(a) shows that the separation between proton and iron showers is larger in terms of than it is for either or , thus the fluctuations from event to event may be useful as an indication of the composition.
We plot the distribution of for three different energy ranges in FIG. 3. We compare this for the data (solid lines) with the estimates for simulated fluxes of pure protons (dashed lines) and pure iron (dotted lines) under the QGSJET assumption with full detector simulation and reconstruction. All the distributions are normalized. It is obvious that neither pure proton nor pure iron can account for the data for energies under eV. The data are highly peaked at , implying a mixed composition around eV. The proportion of proton like events increases with energy. Note that due to the discrepancy regarding the muon normalization between data and simulation, we have shifted the log values by adding 0.17 to the predictions. This makes the muon results consistent with the results in terms of the normalization.
Thus FIG. 3 shows a change in the mean value of indicating a lightening of the mean cosmic ray mass. In the three energy ranges indicated, has values of , and . For comparison, for pure proton changes from -0.230.01 to -0.460.02 while for pure iron is relatively stable around 0.2.
We conclude that the HiRes-MIA hybrid experiment confirms the Fly’s Eye experiment result that the primary composition changes towards a lighter mix of nuclei from to eV. This confirmation is nontrivial not only because of its unique combination of the simultaneous observation of shower longitudinal development and muon density on the ground, but also because of its significantly improved and energy resolution. While the conclusion regarding the primary composition depends on the interaction model used, this study shows that the elongation rate is relatively stable with respect to choice of models. No modern interaction model has produced an much larger than 60 g/cm2/decade.
A change from a heavy to a light composition in this energy region may indicate the increasing abundance of extra-galactic cosmic rays. Indeed, the Flys’s Eye experiment [2] reports a change in the spectral index near eV which can be interpreted in this light. A number of new experiments, such as HiRes, the Pierre Auger Project and the Telescope Array, could address this issue. However, the source of the lower energy heavy composition remains a mystery. In that regard we note that there is a need to explore the energy region between to eV in order to connect our results with the measurements performed below eV. A measurement of the composition in this region may be crucial for the understanding of the sources of cosmic rays above the “knee”.
REFERENCES
- [1] L. F. Fortson et al., Proc. 26th ICRC (Salt Lake City, 1999) OG 1.2.02; K. H. Kampert et al., ibid., OG 1.2.11; F. Arqueros et al., Astro-ph/9908202.
- [2] D. J. Bird et al., Phys. Rev. Lett. 71, 3401, (1993).
- [3] Hayashida et al., J. Phys. G 21, 1101, (1995).
- [4] B. R. Dawson, R. Meyhandan and K. M. Simpson, Astropart. Phys. 9, 331, (1998).
- [5] T.Abu-Zayyad et al., ”The Prototype High Resolution Fly’s Eye Cosmic Ray Detector”, submitted to Nucl. Instrum. Methods A (1999).
- [6] T. Gaisser and A. M. Hillas, Proc. 15th ICRC (Plovdiv 1977), 8, 353.
- [7] R. M. Baltrusaitis et al., Nucl. Instrum. Methods A240 410 (1985); R. M. Baltrusaitis et al., Proc. 19th ICRC (La Jolla, 1985), 7, 159; C. Song et al., Proc. 26th ICRC (Salt Lake City, 1999) OG 4.5.09.
- [8] A. Borione et al., Nucl. Instrum. Meth. A 346, 329 (1994).
- [9] K. D. Green, in “High Energy Gamma Ray Astronomy”, AIP Conf. Proc., 220, 184 (1990).
- [10] D. J. Bird et al.,”CASA-MIA-HIRES: A Hybrid Detector For Measuring Multiple Properties of eV Extensive Airshowers”, submitted to Nucl. Instrum. Methods A (1999).
- [11] T. Abu-Zayyad et al., Proc. 26th ICRC (Salt Lake City, 1999) OG 1.3.05.
- [12] T.Abu-Zayyad et al., Proc. 25th ICRC (Durban 1997) OG 10 (Vol. 5) 345.
- [13] D. Heck et al., FZKA-6019,(Kernforschungszentrum, Karlsruhe) Feb (1998).
- [14] N. N. Kalmykov, S. S. Ostapchenko & A. I. Pavlov, Nucl. Phys. B52 (Proc. Suppl.) 17 (1997).
- [15] R. S. Fletcher et al., Phys. Rev. D50, 5710, (1994).
- [16] M. A. K. Glasmacher et al., Astropart. Phys. 10, 291 (1999).