Mass and mass-to-light ratio of galaxy groups from weak lensing
Abstract
We have measured for the first time the weak lensing signal due to groups of galaxies. The groups are at intermediate redshifts, and have been identified in the CNOC2 field survey, which was kindly made available by Ray Carlberg and Howard Yee. The ensemble averaged group velocity dispersion, based on a preliminary selection of 59 groups, is found to be km/s, which is in fair agreement with the dynamical estimate from the spectroscopic redshifts. Under the assumption that mass traces light, we find an average mass-to-light ratio in restframe of . Using this result we obtain .
1 Kapteyn Astronomical Institute
P.O. Box 800, 9700 AV Groningen, The Netherlands
e-mail: hoekstra, kuijken@astro.rug.nl
2 Leiden Observatory
P.O. Box 9513, 2300 RA Leiden, The Netherlands
e-mail: franx@strw.strw.leidenuniv.nl
1. Introduction
Galaxy groups, like the Local Group, are the most common structures in the universe. Despite being numerous, groups are hard to identify because the contrast with the smooth background of galaxies is low, and their galaxy properties are that of the field. To date most systems have been found using large redshift surveys or X-ray observations.
Measuring the mass locked up in these systems is important, but difficult (cf. Gott & Turner 1977). Nolthenius & White (1987) showed that the masses inferred from redshift surveys depend on the survey parameters, the group selection procedure, and the way galaxies cluster. Consequently, an independent measure of the group mass is needed. Here we study the groups by their weak lensing effect on the shapes of the images of the faint background galaxies.
The weak lensing signal is maximal if the lenses are at intermediate redshifts, but even then, given the low masses of these systems, the expected signals are too low to yield significant detections for individual groups. Thus we have to study the ensemble averaged signal of a large number of groups at intermediate redshifts.
The groups identified in the Canadian Network for Observational Cosmology Field Galaxy Redshift Survey (CNOC2) (e.g. Carlberg et al. 1998; Lin et al. 1999) are ideal targets for our study. The aim of the CNOC2 survey is to study the population of field galaxies at intermediate redshifts . To do so, four widely separated patches on the sky were selected, for which multi-colour data were obtained, as well as spectroscopic redshifts for galaxies brighter than . The survey allows the identification of a large number of groups at intermediate redshifts.
2. Data analysis
We obtained deep -band images of the central 31 by 23 arcminutes of two patches from the CNOC2 survey using the 4.2m William Herschel Telescope. To date, the combination of deep imaging an a large spectroscopic survey is unique, enabling us for the first time to study a large number of galaxy groups through weak lensing. A detailed discussion about the object analysis, including the corrections for the PSF can be found in Hoekstra et al. (1999b). We end up with catalogues of galaxies with in each field. These galaxies are used to measure the weak lensing signal, enabling us to study the average properties of an ensemble of 59 groups from the CNOC2 survey.
3. Weak lensing analysis
Most of the groups are relatively poor, and many of these systems have been selected on the basis of only a few members. The first question that comes to mind is whether the selected structures are genuine. The detection of a weak lensing signal provides an important test to check the validity of the group selection.
Ideally one would like to scale the signals of the various groups with an estimate of their mass, but the uncertainty in the observed velocity dispersions are too large. Therefore we assume that all groups have the same mass and mass profile, and scale the signals of the various groups to that corresponding to the ‘average’ group at .
Figure 1 shows the ensemble averaged tangential distortion as a function of radius around the 59 groups taken from the CNOC2 survey. The amplitude of the signal, which is significant at the 99.8% confidence level, corresponds to that of the ‘average’ group at a redshift of . Various tests, like increasing the phase of the distortion by , placing the groups at random positions, or randomizing the ellipticities of the sources yield no signal. Furthermore the results are robust against imperfect corrections for the PSF anisotropy. We therefore conclude the detected signal is due to weak lensing by galaxy groups.
The lensing signal is detected out to a large distance from the group centre. As the group members are believed to reside in a common group halo, it is evident that the presence of the galaxy groups will complicate attempts to constrain the sizes of halos of field galaxies.
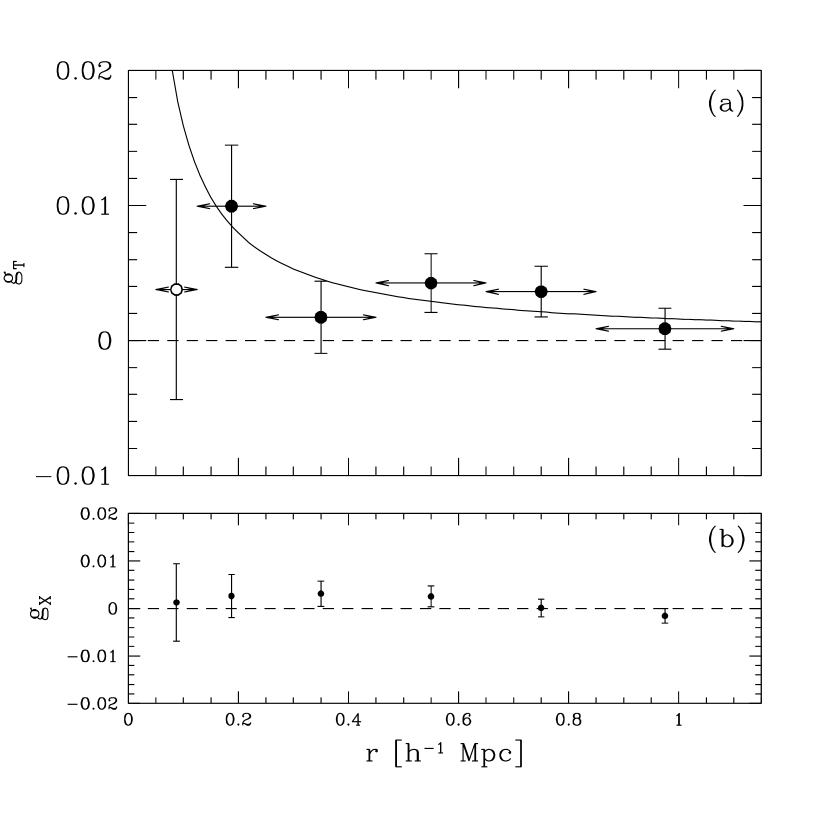
Fitting a singular isothermal sphere model to the observed distortion yields . To relate this measurement to an estimate of the average mass of the groups we use the photometric redshift distribution inferred from both Hubble Deep Fields (cf. Hoekstra et al. 1999a), converted to the band. As the groups are on average at relatively low redshifts, the dependence of the mass estimate on the redshift distribution is rather weak.
Thus we find that the observed distortion corresponds to km/s. This result is in good agreement with the dynamical estimate of km/s, based on the group velocity dispersions.
3.1. Mass-to-light ratio
Under the assumption that the light traces the mass we computed the lensing signal corresponding to the ensemble averaged light distribution and fitted this to the observed lensing signal. We do not observe a trend of the mass-to-light ratio with radius, and we find an average value of in the restframe band. After correction for luminosity evolution (e.g. Lin et al. 1999) we find a value of , which is somewhat lower than what is typically found for rich clusters of galaxies (e.g. Carlberg et al. 1997).
Similar to what is done for rich clusters of galaxies (e.g. Carlberg et al. 1997; Carlberg et al. 1999) or galaxy groups (e.g. Gott & Turner 1977), we can use our measurement of the group mass-to-light ratio to obtain an estimate of the density of the universe, for which we find taking . A detailed analysis will be given in Hoekstra et al. (1999b).
4. Conclusions
The detection of the weak lensing signal of a preliminary selection of galaxy groups first of all shows that the CNOC2 survey allows the identification of these systems at intermediate redshifts. This is supported even more by the agreement between the weak lensing, and dynamical mass estimates. The ensemble averaged group velocity dispersion, based on the 59 selected groups, is found to be km/s, which is in fair agreement with the dynamical estimates.
Under the assumption that mass traces light, we find an average mass-to-light ratio in the restframe band of . This yields an estimate for of . A detailed discussion of the preliminary results presented here can be found in Hoekstra et al. (1999b).
This work was done in collaboration with Ray Carlberg and Howard Yee.
References
Carlberg, R.G., Yee, H.K.C., & Ellingson, R. 1997, ApJ, 478, 462
Carlberg, R.G., et al. 1998, astro-ph/9805131
Carlberg, R.G., et al. 1999, ApJ, 516, 552
Gott III, J.R., & Turner, E.L. 1977, ApJ, 213, 309
Hoekstra, H., Franx, M., & Kuijken, K. 1999a, ApJ, in press, astro-ph/9910487
Hoekstra, H., et al. 1999b, to be submitted
Lin, H., Yee, H.K.C., Carlberg, R.G., Morris, S.L., Sawicky, M., Patton, D.R., Wirth, G., & Shepherd, C.W. 1999, ApJ, 518, 533
Nolthenius, R., & White, S.D.M. 1987, MNRAS, 235, 505