SCUBA Observations of the Elliptical Galaxy NGC 4374
Abstract
We present SCUBA imaging and photometry of the elliptical galaxy NGC 4374. The imaging observations are used to examine the spatial distribution of thermal emission from dust and the radio to infrared continuum spectrum. In the SCUBA 850 image, the galaxy is found to be a point source, constraining the emission to less than (1.5 kpc for a distance of 20.74 Mpc). The simplest interpretation is that the 2000 m to 850 m SCUBA emission is synchroton from a compact core or inner-jet, and most unlikely thermal emission from cold diffuse dust. We cannot exclude free-free emission, but this would be very unexpected. The thermal emission from dust is shown in data and these along with the 450 m SCUBA datum give a dust temperature of 35 K, corresponding to a dust mass of . These are pilot observations in a program to look for cold, diffusely distributed dust in elliptical galaxies, however much deeper 450 m imaging is required to investigate this in NGC 4374.
keywords:
galaxies: individual: NGC 4374 - radio continuum: galaxies - radiation mechanisms: thermal1 Introduction
The interstellar medium (ISM) in elliptical galaxies is not easily probed by optical observations, however observations at a range of other wavelengths have revealed unexpected amounts of gas in these galaxies (Roberts et al. 1991). With the gas we also expect some dust to be present, since red giant stars lose dust to the ISM. Small amounts of dust are seen in dust lanes and patches in ellipticals (Sparks et al. 1985, Goudfrooij et al. 1994). The submillimetre (submm) camera SCUBA (Holland et al. 1999) provides an opportunity to test if there is cold (less than about K), diffusely distributed dust present in elliptical galaxies as suggested from far-infrared observations. Dust temperatures (25 to 35 K) and masses ( to few ) were estimated from observations for a sample of ellipticals by Goudfrooij & de Jong (1995). They showed that dust masses derived from fluxes exceeded (by typically an order of magnitude) the dust masses estimated from optically identified dust lanes and patches in many ellipticals.
However, the data are limited for studying dust since gave little information about the spatial distribution of the dust in galaxies, so cannot be used to check directly if the dust is diffusely distributed or not. We also note that many ellipticals contain haloes of hot gas at around K with masses of a few (Canizares, Fabbiano & Trinchieri 1987). This X-ray emitting plasma is expected to destroy any dust grains through sputtering by hot gas particles in a short time ( years, Draine & Salpeter 1979). So, for diffusely distributed dust to be present in a typical giant elliptical galaxy, the dust would have to be protected or shielded from the plasma in some way. SCUBA, being an imaging device, offers an opportunity to map out the distribution of any cool dust.
The giant elliptical NGC 4374 was chosen from the sample of Goudfrooij & de Jong (1995) as a candidate in which to look for diffusely distributed dust because it has optical dust lanes in the central region (). The dust mass estimated from the dust lanes is and the dust mass estimated from the infrared () fluxes (at 60 and 100 ) is (for a dust temperature of 35 K), a factor of greater than from the optically identified dust (Goudfrooij & de Jong 1995). 111Note that there was a typographical error in Goudfrooij & de Jong 1995: the dust mass they estimated from the data should have read Log=5.13 (not 5.3) (Goudfrooij - private communication). We quote the correct dust mass here. Since most of this dust is not seen in the optical dust lanes, Goudfrooij & de Jong (1995) suggest that it must be diffusely distributed throughout the galaxy. Such dust would affect the colours in galaxies. However, this affect could be difficult to disentangle from age and metallicity variations in the stellar population, which also produce colour changes (Worthey 1994). Therefore the presence of a few million solar masses of dust, distributed throughout a galaxy, could well have escaped optical detection. On the other hand, spatially resolved submm observations, sensitive to thermal emission from cool dust, may directly reveal the presence of any such distribution.
NGC 4374 (M84) is an E1 galaxy in the Virgo cluster lying at a distance of 20.74 Mpc. It is classified as a steep spectrum Fanaroff-Riley I (FRI) radio galaxy with an infrared excess. Two-sided jets emerge from its compact core, which is less than 2 arcseconds (Jenkins, Pooley & Riley 1977). In the context of the Blandford & Rees (1974) jet model, the jets transport energy from the core to symmetrical, edge-darkened lobes which extend to about 2 arcminutes and dominate the core emission (Laing & Bridle 1987, Wrobel 1991). The jets are perpendicular to the dust lanes. There is a low ionization region near the nucleus, extending for about 20 arcsecs along the direction of the optical dust lanes (Baum, Heckman & Breugel 1992). Bower et al. (1997) publish images showing the central structure and estimate a dust mass of (for Mpc) from their (V-I) image. The images indicate central line emission from three components: a nuclear disk, an ‘ionization cone’ and outer filaments.
NGC 4374 also has a hot X-ray halo with of hot gas (Goudfrooij 1994). Its spectrum from the radio to infrared was previously studied by Knapp & Patten (1991), who did not detect any submm emission above that expected from the continuation of the power-law emission at radio wavelengths. They used a previous generation detector in the submm (Duncan et al. 1990). Knapp & Patten (1991) infer dust contents in a sample of radio galaxies (mostly ellipticals) of the order of that found in luminous spiral galaxies ( to ). They assumed a dust temperature of 18 K ( 15 to 20 K estimated range) for the galaxies in their sample and estimated a dust mass of in NGC 4374. Their low estimate of the dust temperature leads to a significantly larger dust mass estimate than that of Goudfrooij & de Jong (1995).
In this paper we explore whether SCUBA jiggle mapping at 850 and 450 m and photometry at 2000, 1350, 850 and 450 m can confirm the presence of diffusely distributed, cold dust in the giant elliptical galaxy NGC 4374. We use the SCUBA observations together with radio and infrared data from the literature to place tighter constraints on the spectral components, including the dust temperature and the size of the infrared emitting region.
2 Observations and Reductions
| UT Date | 2000 m | 1350 m | 850 m | 450 m | 850/450 m | 850/450 m | Calibrators | |
| 146 GHz | 221 GHz | 350 GHz | 677 GHz | 350/677 GHz | 677/350 GHz | |||
| Total Int. | Observing | |||||||
| Time (s) | Mode | |||||||
| ’990319 | 2160 | Photometry | 0.06 | Mars | ||||
| ’980214 | 1260 | Photometry | 0.05 | CRL2688 | ||||
| ’980201 | 2640 | Mapping | 0.05 | IRC+10216 | ||||
| ’980122 | 2340 | Mapping | 0.04 | IRC+10216 | ||||
| ’970703 | 2220 | Mapping | 0.1 | Uranus |
Imaging and photometric observations of NGC 4374 were obtained on 1997 September 3 as well as 1998 January 22, February 1, February 14 and 1999 March 19, with SCUBA, the Submillimetre Common-User Bolometer Array on the JCMT (see Table 1). In the imaging observations, we operated the 91 bolometers of the short wave array (SW) at 450 m and the 37 bolometers of the long wave array (LW) at 850 m, giving beam widths of and (FWHM) respectively. The arrays have a 2.3 arcminute field of view, and a dichroic beam-splitter allows both arrays to be used simultaneously. The observations employed a 64-point jiggle pattern, fully sampling both arrays. Similarly, the submm photometric observations were obtained by operating the central bolometers of the SW and LW arrays at m and m simultaneously, employing a 9-point jiggle pattern in a 3 by 3 grid of . The 1350 m and 2000 m observations used the single photometry bolometers and also employed a 9-point jiggle pattern. Averaging the source signal in an area slightly larger than the beam is intended to achieve the best photometry accuracy under good-to-moderate seeing, and, in case of the simultaneous observations with the LW and SW arrays, to also compensate for the very small offset between the arrays. During the observations, the telescope was nodded and the secondary chopped in a specified scheme in order to eliminate sky emission as is convention in submillimetre and infrared astronomy.
Residual sky emission was removed off-line by using quiet SCUBA array bolometers in which there was no source emission, usually the bolometers in the first ring (for LW) and second ring (for SW) from the centre (Jenness et al. 1998, Robson et al. 1998). The pointing stability was checked before and after each map and before each photometry observation. The focus was checked every three hours or when there were noticeable dome temperature fluctuations. The atmospheric opacity was measured regularly by performing SCUBA skydips. The sky monitor at 225 GHz on the Caltech Submillimetre Observatory (commonly known as CSO tau or , see Masson 1993) updates every 15 minutes and so was used to monitor sudden changes in atmospheric opacity, and, in cases where the SCUBA skydips were not measured or produced poor fits, the CSO data were used to extrapolate SCUBA atmospheric opacities as described in the SCUBA observing manual.
The dedicated SCUBA data reduction software SURF (Jenness et al. 1998), as well as the Starlink packages Kappa and Figaro were used to reduce and analyse the observations. The data reduction consisted of first flat-fielding, correcting for atmospheric extinction, and then residual sky emission removal (see above). Noisy bolometers and integrations were blanked and spikes removed. For the 1350 m and 2000 m photometry observations no residual sky emission removal was done as the observation used only a single bolometer. Spike removal was performed by clipping the data at a specified sigma. The resulting data were calibrated using instrumental gains that were determined from beam maps of Mars or Uranus nightly and in the same observation mode as the target observation (see Table 1). Planetary fluxes for each filter were obtained using the JCMT utility program FLUXES. During the January and February 1998 runs, the planets were not available and the JCMT secondary calibrators CRL2688 and IRC+10216 were used (Sandell 1994; Sandell in preparation). On nights when the (see above and Table 1) the atmosphere was opaque to 450 emission and observations could be made only at longer wavelengths.
3 Results and Discussion
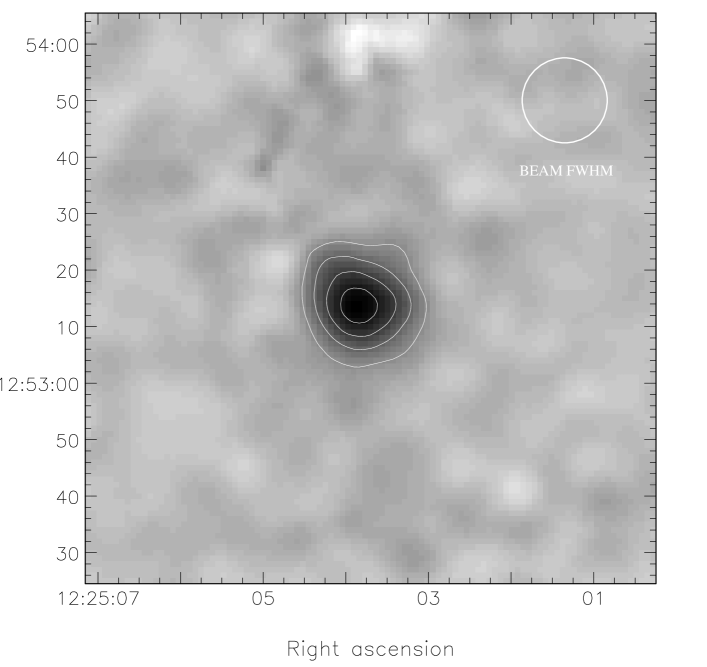
Figure 1 shows the 850 image of NGC 4374 together with the beam-width determined from observations of 3C 273, a standard point source for the JCMT, made in the same way and conditions as NGC 4374. The rms uncertainty on the map is less than 20 mJy/beam. The image of NGC 4374 has small northeastern and southwestern spurs that are not real features of the galaxy but a manifestation of the beam smearing as a result of chopping. These spurs are in the chop direction and are detected at a much lower level than the central emission. An examination of the point spread function of the NGC 4374 image yielded FWHM and FWHM The result shows that the image of NGC 4374 is no more than greater than the JCMT beam. This insignificant spatial extension is probably a result of a small pointing drift during the long observation (hr). We conclude that NGC 4374 is not extended in the SCUBA 850 image which constrains the spatial origin of the observed emission to less than (1.5 kpc for a distance of 20.74 Mpc) in diameter. It is worth noting that although the SCUBA beam is at 850 m, the arrays have a 2.3 arcminute field of view, and therefore, at the distance of NGC 4374, we do not detect any diffused emission to kpc in extent, as we observed with the array pointed at the centre of the galaxy and our observations were spatially sensitive to the entire field of view of SCUBA.
The results from the imaging and photometric observations are shown in Table 1. The uncertainties are a quadratic sum of the uncertainty arising from the measured signal-to-noise-ratio and a systematic calibration uncertainty, which varies from 10% at 850 and lower, to 27% at 450 . The 450 fluxes listed for the 1998 Feb 01 and 14 and Jan 22 runs are upper limits. The submillimetre flux variation over the four observing runs was within the errors on the fluxes.
3.1 Decomposing the SED

Figure 2 shows the spectral energy distribution (SED) for NGC 4374, including data from radio (Jenkins, Pooley & Riley 1977) to infrared () wavelengths. The infrared fluxes were obtained from NED (the NASA/IPAC Extragalactic Database) and have been interpreted as thermal emission from dust (Knapp & Patten 1991, Goudfrooij 1994). At longer radio wavelengths, the lobes dominate the integrated flux from NGC 4374 (by a factor of 8 at 5 GHz, Wrobel 1991) and give an excellent power law of spectral index () of , as shown by the dotted line in Figure 2. This spectral index is consistent with the classification of NGC 4374 as a steep spectrum radio galaxy. The good fit suggests variability larger than the errors on the fluxes is uncommon for the synchrotron power-law of the radio emission.
The submm data points for fluxes within the SCUBA beam and previous submm measurements fall below an extrapolation of this steep radio power-law from the integrated flux. We see no sign of extended emission from the radio lobes on any of our maps, and the upper limit on the 850 m integrated flux within a region approximately the size of the lobes is 0.6 Jy. This is much higher than the extrapolation of the radio power-law from the integrated fluxes, showing that we are insensitive to the radio lobes (Figure 1). As we show later, this indicates that if the observed SCUBA 850 m emission is non-thermal in nature it is dominated by the compact core (or inner-jet).
3.1.1 The Core SED
In Figure 2 we have plotted the single available core radio flux for NGC 4374, at 5GHz (Jenkins, Pooley & Riley 1977, Wrobel 1991); the circles are the means of the SCUBA data listed in Table 1. The 5 GHz core flux together with the SCUBA data give a power-law slope of . In compact radio galaxies, such flat spectra have been found to comprise spectra from many unresolved components, each with its own synchrotron spectrum, the sum of which results in the observed flat power-law. Although we do not wish to over-interpret our results, since we only have one radio core point and the SCUBA data, we note that the observed flatter power-law of the NGC 4374 core could be a consequence of such unresolved synchrotron components. At 5GHz, the northern jet in NGC 4374 is brighter than the southern jet for the first 10 arcseconds (Bridle and Perley 1984). This one-sided inner-jet may comprise such unresolved components.
It is worth noting that the SCUBA fluxes at 850 m, m and 2000 m alone give a spectral index of in the submm, forming a flat spectrum resembling that of a free-free emission component. While this 2000 m to 850 m spectral index is consistent with that of free-free emission (), the large uncertainty on its value limits our ability to conclusively prove its origin. Our 450 m point lies well below this spectrum, which does not help to prove or disprove its origin, but instead adds the complication that this free-free component might have a high-frequency cut-off between 850 m and 450 m. In steep spectrum radio galaxies such as NGC 4374, it is uncharacteristic for a free-free component to dominate the power-law in the mm-submm wavelength range. Therefore if this component is real it would have to come from very high ionization and it would be an interesting discovery. We cross-correlated the ‘submm flat spectrum component’ in Figure 2 with the well known spectrum of 3C273 using data taken with SCUBA on 1998 February 15, just one night after and under very similar conditions as the photometry observations of NGC 4374. The spectrum of 3C273 gives a much steeper slope and a spectral index of , as expected of this variable object during its quiescence phase (Robson et al. 1993). Therefore with our current, limited data we cannot say the 850 m, m and 2000 m fluxes come from significant free-free emission, if any at all.
To model the radio to infrared SED we used a combination of a power-law (non-thermal radio emission from the active nucleus) plus greybody (re-processed emission from dust in the infrared, Hughes, Gear & Robson 1994). The greybody allows for the fact that we see to different physical depths at different wavelengths, for a given optical depth. The composite model flux is then:
| (1) |
In equation (1) is the normalisation for the power-law component, the power-law spectral slope, the solid angle for the greybody component, the Planck function at temperature , the wavelength at which the optical depth is unity and the emissivity index of the grains. The normalisation factors ( and ) are obtained by forcing the model to agree with the 5GHz core radio and IR (60 and 100 m) fluxes respectively, since the two components dominate in these different wavebands. The power-law index and its uncertainty were estimated from linear regression fits to the core radio plus SCUBA data in a log-log plot. We assume that the emission comes from a region less than due to lack of extension seen at 450 m. The best fit temperature and its uncertainty for the greybody component were estimated by eye from plots of the composite model versus the data. Other parameter values (m and ) were fixed at the values given in Hughes et al. (1994) in their study of M82. The parameter values determined from the model are summarised in Table 2, and the model is plotted as a solid line in Figure 2.
| Parameter | Value | Error | Units |
| -0.23 | - | ||
| 3.96E-11 | - | Steradians | |
| 1.46 | - | arcseconds | |
| 35 | K |
We note that the greybody fit demands that the warm dust emission comes from a very compact zone, much smaller that the SCUBA 450 m resolution (see Table 2). Because the 450 m data point lies below the sum of the thermal and non-thermal emission (see Figure 2), the simplest explanation is that the synchrotron spectrum steepens between 850 m and 450 m (or somewhat long-ward of 850 m, given the uncertainties). Also, some small part of the 450 m emission could be due to low surface brightness dust of K to 20 K. Better spectral coverage and higher signal-to-noise data in the submm are clearly needed to test more complex spectral models.
3.2 Dust Mass and its Implications
The temperature that fits the data and is constrained by the SCUBA 450 m measurement is K (see Figure 2). Not surprisingly, this is the same temperature as Goudfrooij (1994) found for this galaxy from his analysis of the data alone. Changing between 2.0 and 1.0 makes very little difference to the best fit temperature. The mass of emitting dust can be derived from a simple model adapted from Hildebrand (1983), where
| (2) |
In equation (2) is the measured flux, the distance to the source (20.74 Mpc for NGC 4374 as assumed by Goudfrooij 1994), the Planck function and the grain mass absorption coefficient. We assumed (Hildebrand 1983) and estimated a dust mass of for Jy and K. The dust mass we have calculated for NGC 4374 is about the same as Goudfrooij & de Jong (1995), as expected since they used the same temperature. Furthermore, it is similar to that found in a recent () study of dust lane in NGC 4374 by Bower et al. (1997), who found the dust mass to be in agreement with that derived from data, in contrast with the dust deficit found in other optical studies of ellipticals (Goudfrooij & de Jong 1995). However for NGC 4374 it is at least one order of magnitude lower than Knapp & Patten (1991), who assumed a cooler temperature of 18 K (based on objects in their sample of nearby radio galaxies for which m, 800 m and 450 m fluxes were detected). Also, they obtained the higher mass even though they assumed a smaller distance of 13 Mpc. While the low dust temperatures estimated by Knapp & Patten (15 to 20 K) are similar to the Galactic Plane value of K, they are inconsistent with the SCUBA plus observations of NGC 4374 if the dust is assumed to be all a single temperature.
As for the extended radio lobe emission, we have not detected the extended low-level emission from diffusely distributed dust with SCUBA. We have shown that the 2000 m to 850 m data are most unlikely due to diffuse cold dust, but some small part of the 450 m emission could be due to dust of K to 20 K. Also, our upper limit to the surface brightness at 450 m is too high and not useful for setting dust mass upper limits on this possibly colder dust. Deeper SCUBA imaging observations are clearly needed to address this question and will be undertaken in the 2000 observing season.
4 Conclusions
Following the suggestion that elliptical galaxies may contain diffusely distributed dust (Goudfrooij 1994) we searched for this dust with submm imaging observations of the elliptical galaxy NGC 4374, using SCUBA on the JCMT. We have not detected low-level, diffusely distributed dust with SCUBA. The emission at 850 m is spatially unresolved (diameter ; 1.5 kpc).
Adding the SCUBA submm data to existing radio through IR data for this galaxy we can constrain the dust component to a single temperature of 30 to 40 K, implying a dust mass of . The model fitting in section 3.1 gives an angular extent of the dust to be in diameter. Mindful that this result is too simplistic for a radiative model of an AGN torus, we note in passing that if we assume a co-mixing of the molecular gas and dust, this constrains the size of any molecular torus around the AGN core of NGC 4374 to pc in diameter.
The mm-submm observations show a flat spectral index that is consistent with the 5 GHz radio core flux. The spectral index of the 850 m to 2000 m fluxes alone is consistent with that expected from free-free emission. The possibility of a free-free component is very unusual and intriguing. Given the care we took over calibration, we see no systematic reasons for our peculiar mm-submm SED. Future observations of NGC 4374 will aim to achieve very high signal-to-noise observations in order to determine the spectral index to a much higher accuracy and therefore prove or disprove the presence of a third spectral component.
In future observations of dusty ellipticals, we will concentrate on those with luminous infrared emission, coldest dust and less non-thermal radio emission in order to try to resolve the distribution of cold dust in ellipticals. We will obtain short mm images of the central regions of NGC 4374 to determine the spatial extent of the emitting region(s) and deeper SCUBA imaging observations to address the possibility of extended low-level emission from cold dust. These observations together with data will be used in order to get a tighter constraint, and thus a better handle, of the radio to submm SED. These observations have important consequences for the interpretation of colours and colour gradients in elliptical galaxies, which are attributed to age and metallicity changes in the absence of diffusely distributed dust.
Acknowledgments
Thanks to Rob Ivison for helping with some of the observations and to Goran Sandell for useful discussion during the reduction and analysis of the SCUBA images. LLL acknowledges the University of Central Lancashire for a full-time research studentship. We thank an anonymous referee for very helpful comments and for pointing out the possibility for cold diffuse dust. The JCMT is operated by the Joint Astronomy Centre, on behalf of the UK Particle Physics and Astronomy Research Council, the Netherlands Organization for Scientific Research and the Canadian National Research Council. This research has made use of the NASA/IPAC Extragalactic Database (NED) which is operated by the Jet Propulsion Laboratory, California Institute of Technology, under contract with the National Aeronautics and Space Administration.
References
- [1] Baum S.A., Heckman T.M., Van Breugel, W., 1992, ApJ, 389, 208
- [2] Blandford R.D., Rees M.J., 1974, MNRAS, 169, 395
- [3] Bower G.A., Heckman T.M., Wilson A.S., Richstone D.O., 1997, ApJL, 483, L33
- [4] Bridle A.H., Perley R.A., 1984, ARA&A, 22, 319
- [5] Canizares C.R., Fabbiano G., Trinchieri G., 1987, ApJ, 312, 503
- [6] Draine B.T., 1990, in Thronson H.A., Shull J.M., eds. Proc Vol 161, The Interstellar Medium in Galaxies, Kluwer Academic Publishers, Netherlands
- [7] Draine B.T., Salpeter E., 1979, ApJ, 231, 77
- [8] Duncan W.D., Robson E.I., Ade P.A.R., Griffin M.J., Sandell G., 1990, MNRAS, 243, 126
- [9] Goudfrooij P., 1994, PhD thesis, Amsterdam
- [10] Goudfrooij P., Hansen L., Jorgensen H.E., Norgaard-Nielsen H.U., 1994, A&AS, 105, 341
- [11] Goudfrooij P., de Jong T., 1995, A&A, 298, 784
- [12] Hildebrand R.H., 1983, QJRAS, 24, 267
- [13] Holland W.S. et al., 1999, MNRAS, in press
- [14] Hughes D.H., Gear W.K., Robson E.I., 1994, MNRAS, 270, 641
- [15] Jenkins C.J., Pooley G.C., Riley J.M., 1977, MmRAS, 84, 61
- [16] Jenness T., Lightfoot J.F., Holland W.S., 1998, in Phillips T.G., eds, Proc SPIE vol. 3357, in press
- [17] Knapp G.R., Patten B.M., 1991, AJ, 101, 1609
- [18] Laing R.A., Bridle A.H., 1987, MNRAS, 228, 557
- [19] Masson C., 1993, in Ishiguro M., Welch W.J., eds. ASP Conf. Ser. Vol. 59, Astronomy with Millimeter and Submillimeter Wave Interferometry, Astron. Soc. Pac., San Francisco
- [20] Roberts M.S., Hogg D.E., Bregman J.N., Forman W.R., Jones C., 1991 ApJS, 75, 751
- [21] Robson E.I. et al., 1993, MNRAS, 262, 249
- [22] Sandell G., 1994, MNRAS, 271, 75
- [23] Sparks W.B., Wall J.V., Thorne D.J., Jorden P.R., van Breda I.G., Rudd P.J., Jorgensen H.E., 1985, MNRAS, 217, 87
- [24] Worthey G., 1994, ApJS, 95, 107
- [25] Wrobel J., 1991, AJ, 101, 127