Rayleigh scattering and laser spot elongation problems at ALFA
Abstract
This paper describes the qualitative effects of LGS spot elongation and Rayleigh scattering on ALFA wavefront sensor images. An analytical model of Rayleigh scattering and a numerical model of laser plume generation at the altitude of the Na-layer were developed. These models, integrated into a general AO simulation, provide the sensor sub-aperture images. It is shown that the centroid measurement accuracy is affected by these phenomena. The simulation was made both for the ALFA system and for the VLT Nasmyth Adaptive Optics System (NAOS).
keywords:
adaptive optics, laser guide star, Rayleigh scattering, spot elongationNGSNatural Guide Star; \abbrevLGSLaser Guide Star; \abbrevAOAdaptive Optics; \abbrevFWHMFull Width Half Maximum;
1 Introduction
In LGS-AO systems, many issues have to be studied and tested on real hardware and the ALFA system in Calar Alto is a remarkable test bench for the characterization and improvement of LGS-AO operation. In Shack-Hartmann systems, it can be observed that the laser spot shape, as seen from different wavefront sensor sub-apertures, varies as a function of the launching telescope position relative to the sensor. The spot shape depends on 2 phenomena :
-
1.
the Na-layer thickness : producing a 3-D laser plume of about 10 km which is seen from different angles by the different wavefront sensor sub-apertures and leads to different laser spot elongations for each sub-aperture ;
-
2.
the presence of Rayleigh scattering in the lower atmosphere : which gives a cone of light below the laser plume itself ; the Rayleigh cone can be seen by the sensor sub-apertures under certain circumstances to be studied here.
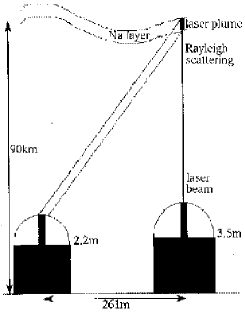
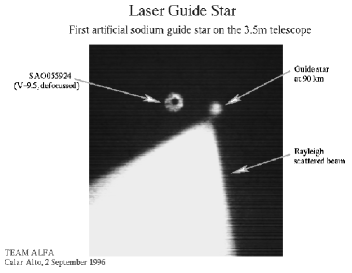
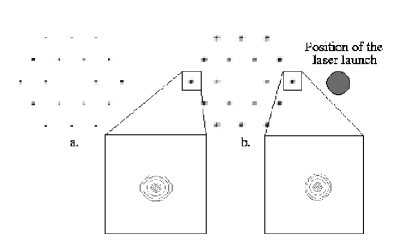
We have modeled both phenomena independently. Then to calibrate and verify these t‘heoretical and analytical models a common observation programme was conducted (in August 1998) at Calar Alto. The Na plume elongation and the Rayleigh cone due to the ALFA laser beam were observed from the neighboring 2.2 m telescope. The experimental results [Delplancke et al. (1998)] were used to constraint the models, as well as to study the evolving Na layer density profile. The experimental set-up is shown in figure 1.
The models were introduced into a general AO software package, also developed in the frame of the LGS network, to get the wavefront sensor sub-aperture images and the corresponding centroid positions in any experimental conditions. We have computed the Rayleigh scattering and the Na spot as seen from wavefront sensor sub-apertures, both in the ALFA case and in the case of a 8-m telescope (typically the Nasmyth Adaptive Optics System - NAOS- of the ESO Very Large Telescope project).
The influence of the LGS shape on the wavefront sensor performances
and on noise propagation in the AO system can be evaluated. The modal
optimization of the AO closed loop can be adapted accordingly for
optimal results, based on noise propagation. This technique must then
be compared with other proposed ways of removing the perspective
elongation effects [Beckers (1992)].
Here are presented the modeling principles, their correlations with
observations, and the qualitative results (sections
2 for the Rayleigh scattering, and 3
for the spot elongation) as well as a first analysis of the LGS shape
influence on measurement noise in section 4.
2 Rayleigh scattering modeling
The Calar Alto experiment was modeled using analytical Rayleigh single
scattering theory and geometrical optics.
The hypotheses made in the modeling are the following :
-
•
the geometry is as shown in Fig. 2 with a Na-layer altitude of 90 km.
-
•
the scattering is only due to Rayleigh scatterers (of size than the wavelength), air molecules were used. We did not take the aerosols into account for 2 reasons : first, their concentration is highly variable with the period of the year, with the observatory location, and with the local weather, making the modeling very difficult. Moreover, as we are interested in the top of the Rayleigh cone close to the Na-layer, it corresponds to high altitudes where there are few aerosols.
-
•
we considered only single scattering.
-
•
we neglected the loss of power of the laser beam due to the scattering when it is going up in the atmosphere (in case of pure Rayleigh scattering, this loss is lower than on a path length of 100 km).
-
•
the beam is supposed to have a constant width all along its path. Indeed, even if the beam is focalised on the Na-layer, its diameter does not change significantly due to the turbulence which is widening the spot. This was verified during Calar Alto run where the laser plume was observed to have a FWHM diameter of about 1 m (for a launched beam of 0.25 m).
-
•
the beam is assumed wide enough to be resolved by the wavefront sensor camera on several pixels. Again, it was verified during last August observations.
-
•
the laser launch telescope has no central obscuration.
-
•
we neglected the influence of the beam polarization because we are working in backscattering where the scattered light polarization is identical to the propagating beam one.
-
•
the atmospheric density model as a function of the altitude is the USSA-1962 model [McCartney (1976a)] whose profile is given in Fig.2.
-
•
the Rayleigh scattering analytical formula is the classical one [van de Hulst (1981)] [McCartney (1976b)] :
(1) where is the intensity of the light scattered by a single particle, per unit of solid angle in the direction (close to 180∘ in backscattering), the power of the incident light per unit of surface, the atmospheric refractive index at sea level (=1.000292), the number of particles (molecules) per unit of volume at sea level(= particles per cubic meter), the wavelength, the angle between the scattering plane and the direction of polarization of the incident light.
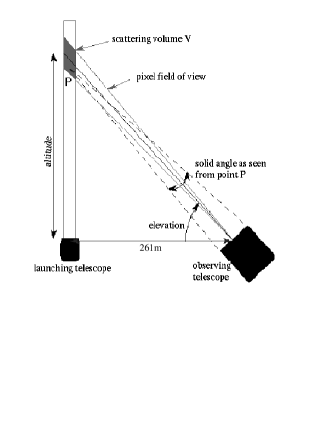

The model predicts correctly the presence of a maximum in intensity per pixel at a certain elevation depending mainly on the distance between the launching and observing telescopes, as observed during Calar Alto observation run from a telescope placed at 261 m from the launching one. This results from 3 effects :
-
•
the decrease in atmospheric density with the altitude,
-
•
the increase of the scattering volume (corresponding to one camera pixel, with the telescope elevation) and
-
•
the increase of the distance between that volume and the observing telescope.
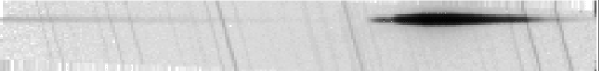
The model gives the right shape and the right intensity ratio between
the Na plume (set, in the model, to a cumulated magnitude of 9, as
observed from ALFA [Quirrenbach et al. (1997)]) and the top of the Rayleigh
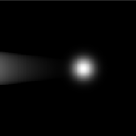
cone as seen in figure 3.
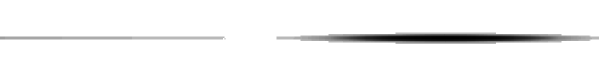
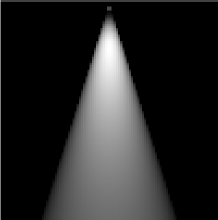
The simulation gives also results comparable with images taken with
the tv-guider camera of the 3.5 m telescope in Calar Alto
(Fig. 4). The tv-guider camera is much closer to the
laser launch telescope and corresponds more to the close configuration
encountered with the wavefront sensor.
The simulation helps us to predict that the elevation of the apparent intensity maximum increases when the observing telescope gets closer to the launching one; the top of the Rayleigh cone approaches the Na-layer LGS. For close configurations (separation between the launching telescope and the observing sub-aperture lower than 1 m), the top of the Rayleigh cone can even apparently touch the Na plume.
 |
 |
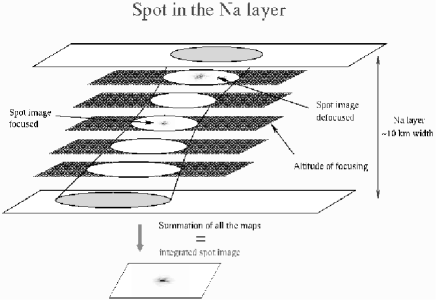
3 Sodium layer spot modeling
The Na layer spot simulation is divided into 3 steps whose parameters are the following :
-
•
the launch of the laser beam by a telescope of adjustable diameter (here set to 0.25 m in ALFA case), without central obscuration. The beam is supposed gaussian, its waist (related to the full width half max) was chosen here equal to of the diameter, its focalization was set on the Na-layer supposed to be at 90 km altitude, and its power was set to 2 W continuous.
-
•
the upward conical propagation of the laser beam through a von Kármán atmosphere (here with and ) made of several layers (here 2 layers at 10 m and 10 km respectively). Fraunhofer propagation [Born and Wolf (1959)] is assumed here taking into account the focalization on the Na-layer.
-
•
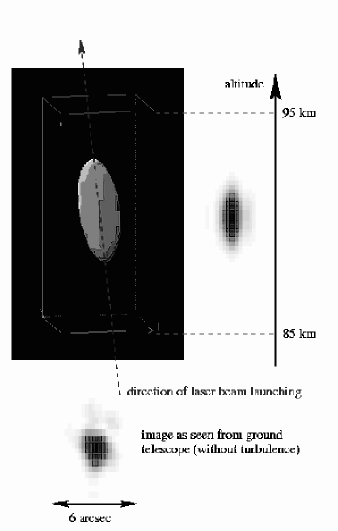
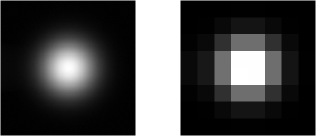
the generation of the 3-D spot in the Na-layer by computing the intensity pattern at different levels in this layer (supposed of FWHM equal to 7 km centered around an altitude of 90 km), supposing a gaussian distribution of the Na column density as a function of the altitude, and not considering saturation (because of the use of a continuous laser). The resonant backscattered number of photons is computed following the results obtained by \inlinecitegardner89. The principle scheme of such a simulation is given in Fig. 5. An example of the so obtained 3D spot shape, as seen from the ground, is given in figure 6.
4 Influence on Shack-Hartmann wavefront sensor performances
4.1 Rayleigh cone
As shown by the simulation and by the Calar Alto experiments, the Rayleigh cone intensity per pixel angularly close to the Na layer spot, increases when the observing aperture gets closer to the laser launching telescope. It will be the most important for the closest wavefront sensor sub-apertures in a LGS AO system. This situation was modeled both for ALFA (5x5 hexagonal sensor) and NAOS (14x14 square sensor) systems, considering that the minimum distance between sub-aperture and launching telescope is equal to 1 m. The results of such simulation are shown in figures 7 and 8.
 |
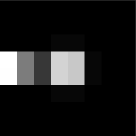 |
In ALFA case, the Rayleigh cone is very important in the sub-aperture,
closest to the laser launch. The total intensity due to the Rayleigh
on the sub-aperture field of view is of the same order of magnitude as
the total Na spot intensity. As the Rayleigh is situated only on one
side of the Na spot, it is inducing a large bias on the centroid
measurement. Fortunately it is not so affecting the other
sub-apertures : for a laser-sub-aperture distance of 1.7 m, the
Rayleigh total intensity is reduced to about of the Na spot
total intensity.
A solution to remove the Rayleigh scattering cone is to take the
sub-aperture images with a detuned laser so that only the Rayleigh
cone can be seen. This reference image is then subtracted from the
real closed loop image before getting the centroid. It only works when
the laser is launched from the center of the telescope so that the
configuration is centrally symmetric. Indeed, if the laser is launched
sidewise, the pupil rotation on the Shack-Hartmann sensor will induce a
displacement of the laser launch position relative to the
Shack-Hartmann axes. The Rayleigh cone aspect on each sub-aperture will
vary with time and no easy calibration is possible. On the contrary,
when the laser is centrally launched, the pupil rotation does not
induce this displacement and the Rayleigh cone aspect (orientation and
shape) remains the same at any moment (as long as the Rayleigh is
constant). Still, the Rayleigh added noise has to be taken into
account. This parasitic noise is of the order of 5 per pixel per
ms, at his highest point. This is not negligible relative to the other
noise sources : read-out noise (around 6 rms) and sky background
noise.
The Rayleigh cone can also be reduced by windowing the sub-aperture
field of view and by temporal filtering in case of pulsed laser. Other
means will be investigated, e.g. using the beam polarization
properties.
On the contrary, Fig. 8 shows that the Rayleigh cone can be neglected in the case of NAOS. This is due to the fact that, in NAOS, the pixel scale is much smaller than in ALFA (0.29 arcsec versus 0.75 arcsec). The sub-aperture field of view is thus smaller, providing a kind of spatial filtering. Moreover, in NAOS, the Rayleigh cone is distributed on a larger number of pixels than in ALFA while the Na spot is not diluted so much. The intensity per pixel due to the Rayleigh scattering goes down to of the Na spot intensity per pixel. This represent a parasitic noise, after Rayleigh cone substraction, of 0.4 per pixel per ms, which is negligible relative to the read-out noise.
4.2 Spot elongation
The 3-dimensional Na spot image, obtained as described the
section 3, is then used in the wavefront sensor image
computation.
Again Fraunhofer and weak fluctuations approximations are used : the
scintillation is neglected and we propagate only phase variations
through the same atmosphere as used in upward propagation, taking the
cone effect into account. Phase at the entrance of the telescope is
obtained and Shack-Hartmann wavefront sensor sub-aperture images are
computed using Fourier optics :
-
•
the 2-D Na spot source maps are obtained by projecting the 3-D map on each sub-aperture taking the perspective effects into account ;
-
•
the sensor point-source images are computed by Fourier transform of the phase on the sub-apertures ;
-
•
the convolution of the point-source images with the 2-D Na spot maps gives us the final sensor images.
This simulation was made in 2 cases : ALFA (3.5 m telescope with a 5x5
hexagonal Shack-Hartmann wavefront sensor) and NAOS (8 m telescope
with a 7x7 square Shack-Hartmann sensor).
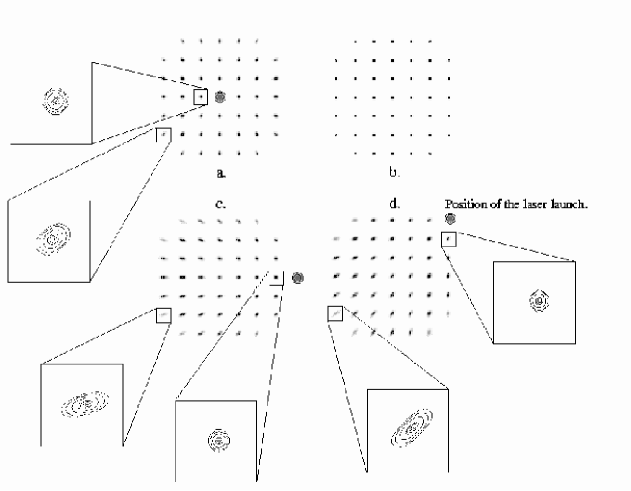
The 2-D Na spot maps are shown in Fig. 9 for ALFA
and in Fig. 10 for NAOS and for different positions
of the laser launch telescope relative to the pupil. The differential
elongation of the spots as a function of the sub-aperture can be
easily seen on the extracted contour plots. It is more noticeable with
the 8 m telescope than with the 3.5 m.
The spot elongation modifies the accuracy of the centroid measurement
along its long axis. As the spot elongation is not the same for each
sensor sub-apertures and as a function of the laser position, the
noise on the centroiding measurement is different and therefore the
noise propagation into the reconstructed modes is affected. This
effect is negligible for ALFA. Indeed the measurement noises (read-out
noise, background noise …) are very large relative to the LGS signal
and the laser spots are deformed due to atmospheric turbulence. The
very slight spot elongation shown in figure 9
without noise nor perturbation is so completely dominated by other
ALFA noise sources in real situations.
On the contrary, in system like NAOS where the measurement noises are
considerably reduced, the spot elongation will have to be taken into
account and the laser launch telescope position well chosen. Indeed,
in an alt-azimutal telescopes, the pupil rotates on the sensor and if
the launching laser is not located behind the telescope secondary
mirror (central position), the shape of the spots on each sub-aperture
will vary with time. This effect is well shown in
Fig. 10 c and d.
In LGS AO operation, the differential noise propagation must be
compensated via the reconstruction matrix and via an adapted modal
optimization in the time and mode filtering. If the spot elongation on
one sub-aperture varies with time (i.e. with a lateral launching
telescope), various reconstruction matrix have to be implemented as a
function of the pupil position on the Shack-Hartmann sensor. The
quantitative effects of these phenomenon on the adaptive optics loop
performances have to be evaluated.
5 Conclusion and Perspectives
Experiments were conducted in Calar Alto with the 2.2 and 3.5 m
telescopes and with ALFA, in order to study the Rayleigh scattering
induced by the laser beam, and the spot elongation due to the
non-negligible Na-layer thickness.
The observations allowed us to develop and calibrate models of these
phenomena. The models have been used to study the impact of Rayleigh
scattering and spot elongation on the Shack-Hartmann wavefront sensor
image and on the centroiding performances.
The spot elongation was shown to be negligible in ALFA case while it
is more important with an 8 m telescope. On the contrary, the presence
of the top of the Rayleigh scattering cone appeared to be more
noticeable in ALFA case and to induce a non-negligible bias in the
centroiding measurements close to the laser launch telescope.
We are planning to make new observations in Calar Alto to exactly
calibrate the photon returns from the Na spot and from the Rayleigh
cone, together with Lidar measurements of the atmosphere. These data
will be used to certify our developed models.
We will also test the polarization method for suppressing the Rayleigh
cone in the sub-aperture images.
Finally, the investigation of noise propagation in the AO loop with
spot elongation will be pursued quantitatively. We plan to propose
strategies to correct for this effect.
Acknowledgements.
This work is being performed in the frame of the ‘Laser Guide Star for 8-m Class Telescopes” network of the European Commission Training and Mobility of Researchers programme (Contract no. FMRX-CT96-0094). The present research was a collaboration between the Max-Planck-Institut für extraterrestrische Physik in Garching, the European Southern Observatory and the National University of Ireland-Galway.Special thanks go to the ALFA team (W. Hackenberg, M. Kasper, Th. Ott and S. Rabien) and the operators (J. Aceituno and L. Montoya) for their essential help with the laser.
References
- Beckers (1992) Beckers, J.: 1992, ‘Removing perspective elongation effects in Laser Guide Stars and their use in the ESO Very Large Telescope’. Proceedings of ESO conference on Progress in Telescope and Instrumentation Technologies (April 27-30, 1992, Garching, Germany) pp. 505–514.
- Born and Wolf (1959) Born, M. and E. Wolf: 1959, Principles of Optics, pp. 381–385. Pergamon Press (London).
- Delplancke et al. (1998) Delplancke, F., N. Ageorges, N. Hubin, and C. O’Sullivan: 1998, ‘LGS light pollution investigation in Calar-Alto’. In: Proceedings of ESO-OSA Conference on Astronomy with Adaptive Optics ( April 7-11, 1998, Sonthofen, Germany). pp. 501–512.
- Gardner (1989) Gardner, C.: 1989, ‘Sodium resonance fluorescence Lidar applications in atmospheric science and astronomy’. In: Proceedings of IEEE, Vol. 77. pp. 408–418.
- McCartney (1976a) McCartney, E.: 1976a, Optics of the Atmosphere - Scattering by Molecules and Particles, pp. 81–86. John Wiley & Sons (New York).
- McCartney (1976b) McCartney, E.: 1976b, Optics of the Atmosphere - Scattering by Molecules and Particles, Chapt. 4. John Wiley & Sons (New York).
- Quirrenbach et al. (1997) Quirrenbach, A., W. Hackenberg, H. Holstenberg, and N. Wilnhammer: 1997, ‘The Sodium Laser Guide Star System of ALFA’. In: Proceedings SPIE in Adaptive Optics & Applications, Vol. 3126. pp. 35–43.
- van de Hulst (1981) van de Hulst, H.: 1981, Light scattering by small particles, p. 65. Dover Publications (New York).