1 Introduction
A very good fraction of stars in the sky are believed to be in binary (or multiple) systems. Therefore, we expect a good fraction of pulsars to have originated in binary systems. However, observations of pulsars have shown that most of the pulsars are not in binary system now. This would imply that these pulsars must have become solitary after the disruption of their progenitor binary system during (or shortly after) the supernova explosion.
Well before the discovery of pulsars, the work Blaauw (1961) showed that if a star explodes in a binary system, if the mass lost in that process is greater than half the initial total mass, then the final system will be unbound. This would imply that the resultant pulsar will have a spatial velocity equal to the orbital velocity of the exploded star at the time of the explosion.
After the discovery of pulsars, from their statistical analysis of the pulsar population, Trimble and Rees (1970) showed that in order to explain the distribution of pulsars, one needs a large spatial speeds for pulsars when compared to what they would have got from the orbital velocities of their progenitor binary systems.
Following this, two main mechanisms were suggested to explain the origin of pulsar velocities (other than from the binary orbital velocities).
-
1.
Shklowskii (1970) conjectured that supernova explosions are asymmetric in nature, and that helps pulsars to acquire substantial velocities during their birth.
-
2.
In 1975, Harrison & Tademaru came up with another mechanism, where pulsars acquire their velocities by “Rocket-effect”, by having Oblique-offcentred magnetic dipole.
They showed that if we have such a magnetic field arrangement the radiation pattern of that dipole is asymmetric with respect to the two poles defined by the rotation axis. The reaction force on the neutron star in such a case is prportional to the fifth power of the angular velocity (). This implies two important results: () Young new-born fast-rotating pulsars can be accelerated to very high velocities, () This effect is strong enough to disrupt the binary system where the pulsars were born! Therefore, with this mechanism, the authors could explain both the problems (that pulsars have large spatial velocities, and they are solitary).
Although this method, in principle could give qualitative explanation to the nature of pulsar population, it failed a very important observational test. As Morris, Radhakrishnan & Shukre (1976) showed, the acceleration of a pulsar in the direction of its rotation axis would necessarily mean that in the plane of the sky the projected direction of rotation axis is the same as that of the measured proper motion direction. From the measured proper motion and polarisation data, they proved that this correlation is not seen (see also Anderson & Lyne 1983; Lorimer et al. 1995; Deshpande, Ramachandran, Radhakrishnan 1999). Therefore, we can assume that this elegant mechanism is not relevant for understanding the origin of pulsar velocities.
In this paper, I would summarise the main developments in this subject so far.

Jname l b d err err (deg) (deg) (kpc) (mas/yr) (mas/yr) km/s 0152–1637 179.3 –72.5 .79 –10 50 –150 50 563 0452–1759 217.1 –34.1 3.14 19 8 35 18 593 0525+1115 192.7 –13.2 7.68 30 7 –4 5 1102 0601–0527 212.2 –13.5 7.54 18 8 –16 7 861 0738–4042 254.2 –9.2 11.03 –56 9 46 8 3789 0826+2637 197.0 31.7 .38 61 3 –90 2 644 0922+0638 225.4 36.4 2.97 13 29 64 37 919 1509+5531 91.3 52.3 1.93 –73 4 –68 3 913 1604–4909 332.2 2.4 3.59 –30 7 –1 3 511 1645–0317 14.1 26.1 2.90 41 17 –25 11 660 1709–1640 5.8 13.7 1.27 75 20 147 50 993 1720–0212 20.1 18.9 5.43 26 9 –13 6 748 1935+1616 52.4 –2.1 7.94 2 3 –25 5 944 2149+6329 104.3 7.4 13.64 14 3 10 4 1112 2225+6535 108.6 6.8 1.95 144 3 112 3 1686 2305+3100 97.7 –26.7 3.93 13 8 –33 6 661
2 Observational facts
There are two ‘direct’ ways of measuring pulsar proper motions. The first is by an interferometer, where observations at two well separated epochs can give an accurate measurement of positional displacement of the pulsar in the sky. The second is by Timing measurements, where the positional errors (due to the proper motion) lead to annual oscillations in timing residuals, and this gives an estimate of their proper motion. So far, we have proper motion measurements for about 100 pulsars by the above two methods.
Figure 1 shows the observed transverse velocity of pulsars after correcting for the differential galactic rotation. As we can see, though the maximum velocities go all the way to about 1000 km/sec, majority of pulsars have velocities of about 150 to 200 km/sec. While understanding this distribution, apart from the measurement errors associated with these proper motion measurements, it is also important to appreciate the uncertainties in the estimated distances to these pulsars (, where and are the measured proper motion and distance to the pulsar). Table 1 gives a list of pulsars for which transverse velocities are suspected to be greater than 500 km/sec. Distances to these objects are estimated with the help of the Galactic free-electron density distribution model of Taylor & Cordes (1993). It is clear that for half of them, we have only a lower limit on their distance. Even for these pulsars, a “lower limit” doesn’t necessarily mean that the actual distance is greater than the lower limit! As Deshpande & Ramachandran (1998) showed from their scattering measurements, the distance to PSR J0738–4042 is as small as about 4 kpc, whereas the lower limit from the Taylor & Cordes model is kpc. After accounting for all these uncertainties, what we can conclude from this table is that there are a few pulsars, like 0826+2637, 1509+5531, and 2225+6535, which have sufficiently well measured proper motions and well determined distances, which are moving with transverse velocities well in excess of 500 km/sec. Therefore, we do see some fraction of pulsars having such high velocities.
Observationally, many reasons have emerged over the years to justify the idea that one needs an impulse (‘kick’) due to asymmetric supernova explosion. They are,
-
•
The rotation axis of the Be-star companion of PSR J0045–7319 is misaligned with the orbital angular momentum axis, strongly suggesting that the supernova explosion must have been asymmetric (Kaspi et al. 1996; Lai 1996).
-
•
Large orbital eccentricities of Be X-ray binaries
-
•
Low incidence of double neutron star binary systems in the Galaxy. Observational estimates show a birthrate of yr-1 (Phinney 1991; Narayan et al. 1991; van den Heuvel & Lorimer 1996). To reproduce this, we need a kick speed of a few hundred km/sec (Portegies Zwart & Spreew 1996; Ramachandran 1996; Lipunov et al. 1996; Bagot 1996; Fryer & Kalogera 1997).
-
•
Low incidence of Low Mass X-ray Binaries, and their kinematics in the Galaxy (van Paradijs & White 1995; Brandt & Podsiadlowski 1995; Ramachandran & Bhattacharya 1997; Cordes & Chernov 1997; Kalogera 1996; 1998; Tauris & Bailes 1996).
-
•
It is necessary to have kick velocities to produce systems like PSR B1913+16 (Wex et al. 2000)
Considering all the above observational constraints, it seems that an asymmetric supernova explosion leading to a “kick” seems to be most probable. However, it is also important to understand the fractional contribution of binary orbital velocities to the observed pulsar velocities.
3 Distribution of pulsar speeds
To understand the intrinsic distribution of pulsar speeds in the Galaxy, we need to do a detailed statistical analysis of the pulsar population. There are many observational selection effects biasing our sample of pulsars, and they need to be understood and corrected for, before attempting to quantify any statistical property of the pulsar population. A brief description of the selection effects is as follows (see Lorimer’s talk in this volume for further details).
-
•
Pulsar radio luminosities have a wide ranging distribution. Faint objects don’t get detected, biasing our sample against the ‘fainter’ side of the luminosity distribution.
-
•
The probability of detecting farther pulsars reduces due to the smearing of the pulse due to dispersion and scattering of radio signals in the interstellar medium.
-
•
Slow pulsars don’t migrate to large heights above the plane, whereas fast pulsars do. This gives an over-estimation of the scale factors for slow pulsars (Hansen & Phinney 1997).
-
•
Farther slow pulsars don’t show significant (measurable) proper motion, biasing the sample against slow pulsars.
-
•
Distances are over-estimated due to the presence of (unaccounted) HII regions (or Strömgren spheres of OB stars) which introduce significant extra dispersion measure. This results in over-estimation of the transverse velocities (Deshpande & Ramachandran 1998).
Any statistical study of pulsar population must take into account all these effects to get an unbiased idea about the properties of the pulsar population.
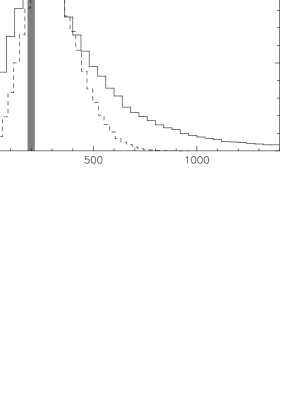
Figure 2 shows the distribution of three dimensional speeds of the pulsar population estimated by three different works. Lyne & Lorimer (1994) considered a sample of 28 pulsars whose ages are less than 3 Myr for their analysis. With the assumption that there are no selection effects on such sample of young pulsars, they estimated the speed distribution, which has a long ‘tail’ extending to well above 1000 km/sec. This predicts an average speed of about 450 km/sec, with an r.m.s. speed of 535 km/sec and the peak of the distribution around 250 km/sec (solid line in the figure). Hansen & Phinney (1997), from their detailed analysis of the Galactic population of pulsars came to the conclusion that the pulsar population is quite consistent with a Maxwellian distribution with an one-dimensional r.m.s. velocity of about 190 km/sec (‘dash’ curve). With their detailed analysis of the local population of pulsars, Blaauw & Ramachandran (1998) concluded that the speed distribution of pulsars in the solar neighbourhood is consistent with even a ‘delta-function’ distribution at about 200 km/sec! The idea that predominant fraction of pulsars may be moving with substantially lower velocities ( km/sec) was also supported by the analysis by Hartman (1997). Therefore from all these analyses, we can conclude that bulk of the population is moving with 3-D speeds of about 200 – 250 km/sec.
4 Kinematics of pulsars in the Galaxy
From the above analysis, it is clear that pulsars do have large peculiar speeds of the order of about 200 – 250 km/sec. With the addition of the Galactic rotation, the resultant velocities of these objects could be very much comparable to the escape velocity of the Galaxy. Therefore, study of the evolution of these objects in the Galactic potential becomes important. I will present here a ‘quick’ Monte Carlo simulation to understand some important aspects of their evolution. We will address some of the questions related to their kinematical properties like ‘asymmetric drift’ in the Galactic plane, their migration along the Galactocentric radius, etc. Let us generate a large number of pulsars in the Galaxy with the following properties.
-
•
The surface density distribution of these objects along the Galactocentric radius is a Gaussian, with an r.m.s. of kpc.
-
•
Along the height from the galactic plane, let us assume a scale-height of 75 pc.
-
•
Evolve each pulsar after including the Galactic rotation contribution corresponding to its place of birth, for a total length of time , where is distributed uniformly between zero and a maximum of yrs. After evolving each object, store the values of its initial and final coordinates, and its final velocity components in the Galaxy.
-
•
Study the spatial and velocity distributions, after correcting for the observational selection effects as indicated in section 3.
The Galactic potential function is assumed to be the one given by Kuijken & Gilmore (1989):
| (1) |
This potential function has three components, namely the Disc-Halo, Nucleus, and the Central Bulge. For the Disc-Halo component, . The values of all the constants are tabulated in Table 2
Parameter Disc-Halo Nucleus Bulge Mass (M⊙) 0.4 0.5 0.1 0.325 0.090 0.125 2.4 5.5 0.25 1.5
4.1 Asymmetric Drift
When a pulsar evolves in the galaxy, due to its peculiar velocity it migrates along both and . When a pulsar is born in the Galaxy, its initial angular momentum is determined by the Galactocentric radius at which the pulsar is born, and its velocity around the galactic centre. Given this, and the flat rotation curve of the Galaxy, when the pulsar migrates to a different galactocentric radius, it either leads ahead, or lags behind the local flow, depending on whether the present galactocentric radius is less or more than its initial radius. Since, on the average, objects flow to the outer portions of the Galaxy from the inner portions, we expect more objects laging behind. In other words, any virialised population with a significant radial velocity component will revolve more slowly around the Galactic centre. This effect is known as ‘asymmetric drift’, and is seen in many stellar populations in the Galaxy (Mihalas & Binny 1981).
Pulsars, though they are relatively young objects, they have far greater velocity than almost all the stellar populations. Therefore, even within a relatively short time ( Myr) they exhibit this important property. Hansen & Phinney (1997) showed through their detailed analysis that 90% of those pulsars whose ages are greater than about 4 Myr show this effect.
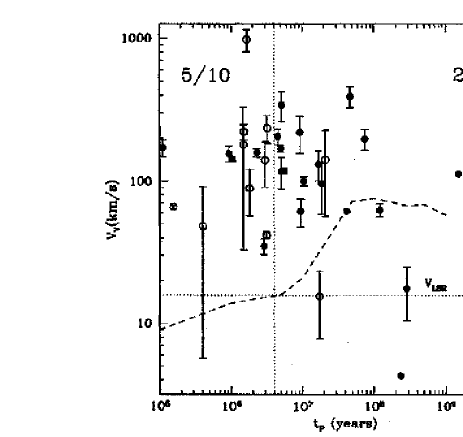
Figure 3 shows the plot of Hansen & Phinney of the characteristic age and the component (velocity in the azimuthal direction with respect to the Galactic centre) derived from their proper motion measurements. Though they have calculated only the azimuthal velocity with respect to the position of the Sun (not with respect to the position of each of the pulsars), it gives a clear idea about the significance of the asymmetric drift.
To get an idea about how severe is the migration of pulsars along the radial direction, in Figure 4 I have plotted the distribution of the initial galactocentric radius of those pulsars which end up in the Solar neighbourhood ( kpc) after their evolution. We can see that the migration becomes very significant even in 10 Myr, for velocities of 250 km/sec. At 100 Myr, practically the objects come from everywhere to the solar neighbourhood. This suggests that a complete understanding of the kinematical properties of pulsars is possible only if we study their evolution in the full galactic potential, and not in the approximated ‘local potential’.

5 Velocities of millisecond pulsars
The population of millisecond pulsars (MSPs) differ from the ordinary pulsars in many properties. First of all, they are much older (more than years old). Moreover, a good fraction of them are in binary systems. These make the kinematic properties of millisecond pulsars quite distinctly different from the ordinary population.

In the standard evolutionary scenario of MSPs (see Bhattacharya & van den Heuvel 1991 for a detailed review), they originate from Low Mass X-ray Binaries (LMXBs). These LMXBs acquire their space velocities during the primary (and the only) Supernova explosion in the system. Even if the supernova explosion is a symmetric one, the surviving binaries will acquire some space velocity, since the explosion is symmetric only with respect to the exploding star, and not with respect to the centre of mass of the binary system. During this process, a significant fraction of the binary systems may get disrupted. The survival probability gets reduced further if the explosion is an asymmetric one (Flannery & van den heuvel 1975; Hills 1983; Ramachandran & Bhattacharya 1997; Tauris & Bailes 1996).
Jname l b err err d (deg) (deg) (mas/yr) (mas/yr) (km/s) J0437-4715 253.394 -41.964 114 2 -72 4 0.14 88 J0613-0200 210.41 -9.30 2.0 0.4 -7 1 2.19 58 J0711-6830 279.53 -23.28 -15.7 0.5 15.3 0.6 1.03 118 J1024-0719 251.70 40.52 -41 2 -70 3 0.35 121 J1045-4509 280.85 12.25 -5 2.0 6 1 3.24 188 J1300+1240 311.301 75.414 46.4 0 -82.9 0 0.62 279 J1455-3330 330.72 22.56 5 6.0 24 12 0.74 97 J1603-7202 316.63 -14.50 -3.5 0.3 -7.8 0.5 1.64 73 J1643-1224 5.67 21.22 3.0 1.0 -8.0 5 4.86 Undef J1713+0747 28.751 25.223 4.9 0.3 -4.1 1.0 0.89 22 J1730-2304 3.14 6.02 20.5 0.4 0.0 0 0.51 51 J1744-1134 14.79 9.18 18.64 0.08 -10.3 0.5 0.17 15 J1857+0943 42.290 3.061 -2.94 0.04 -5.41 0.06 1.00 16 J1911-1114 25.14 -9.58 -6 4 23 13 1.59 187 B1937+21 57.509 -0.290 -0.130 0.008 -0.464 0.009 3.58 80 B1957+20 59.197 -4.697 -16.0 0.5 -25.8 0.6 1.53 189 J2019+2425 64.746 -6.624 -9.9 0.7 -21.3 1.4 0.91 83 J2124-3358 10.93 -45.44 -14 1 -47 1 0.24 45 J2129-5721 338.01 -43.57 7 2 -4 3 2.55 Undef J2145-0750 47.78 -42.08 -9.1 0.7 -15 2 0.50 43 J2322+2057 96.515 -37.31 -17 2 -18 3 0.78 82.24
Over past few years, many detailed analyses have been done to understand the kinematic properties of these two populations. Through their analysis, van Paradijs and White (1995) argued that to explain the distribution of LMXBs we need high asymmetric kick velocities, and the distribution is consistent with the kick speed distribution given by Lyne & Lorimer (1994). Through their Monte Carlo simulation, Brandt & Podsiodlowski (1995) supported this conclusion. Tauris & Bailes (1996), from their evolutionary calculations, showed that it is almost impossible to produce any MSP system with speeds km/sec. Later, Ramachandran & Bhattacharya (1997) showed through their detailed Monte Carlo analysis of the evolution of LMXBs and MSPs in the Galactic potential, that the spatial distribution of LMXBs and the speed distribution of MSPs are consistent with the Lyne & Lorimer distribution, but it is even more consistent with even ‘zero’ kick speed! This uncertainty (mainly by low number statistics) was again shown by the analysis by Kalogera (1998) where she showed that the distribution is consistent with speeds in the range 100 - 500 km/sec.
Given all these, let us see what we can infer from our simple simulation with new proper motion measurements of many MSPs. Table 3 gives a list of MSPs with their measured proper motions and transverse velocities. It is understandable that these objects, on the average, are moving slower than the ordinary pulsars, since high velocities acquired during the supernova explosion would have disrupted the binary system.
In order to get an idea about their intrinsic birth speeds, I have evolved the sample pulsars for about years. Then, I have compensated for all the observational selection effects. For this process, I have assumed that the Parkes 70 cm survey (Manchester et al. 1996) can observe all directions in the Galaxy. This is just to improve the statistics in the final ‘observable’ distribution of pulsars in the simulation. Then, from the velocities of those ‘observable’ pulsars, I have calculated their transverse velocity as measured from the position of the Sun, so that they can be directly compared with the measured transverse velocities of MSPs. Figure 5 shows the cumulative distribution of the ‘true’ distribution (‘dash’ line) and the simulated distribution for an assumed initial Maxwellian speed distribution with 1-D r.m.s. of 100 km/sec (solid line). The Kolmogorov-Smirnov probability (K-S probability) of this fit comes to about 61%. The K-S probability of many other distributions seem to be less than this value. For instance, for km/sec, it is 20%. And for of 250 and 500 km/sec, the probabilities were 12% and 0%, respectively.
6 Observational evidences pertinent to kick mechanisms
From various reasons we presented above, it is clear that the formation process of neutron stars must be asymmetric, so that pulsars gain significant velocities. The reasons, as we saw, are purely empirical, with different kinds of observations pointing to the existance of an impulsive transfer of momentum to the protoneutron star at birth (Shklowskii 1970; Gunn & Ostriker 1970; van den Heuvel & van Paradijs 1997). The mechanisms suggested for this range from hydrodynamical instabilities to those in which asymmetric neutrino emission is postulated (Burrows 1987; Keil et al. 1996; Horowitz & Li 1997; Lai & Qian 1998; Spruit & Phinney 1998).
Whatever is the mechanism to create such an asymmetry, it is important to understand if the direction of asymmetry is random, or it is associated with some physical property of the system. Two such axes are the rotation and the dipole magnetic axes of the neutron star. Many mechanisms suggested to produce the asymmetry have invoked both these axes for the direction of the asymmetry (Harrison & Tademaru 1975a,b; Burrows & Hayes 1996; Kusenko & Segre 1996).
The recent analysis by Deshpande, Ramachandran & Radhakrishnan (1999) explores into the observational tests to prove (or disprove) the mechanisms predicting any relation between the direction and magnitude of the observed velocities and the magnetic and the rotation axis of the star. As they show, observations do not support any relation between () the magnitudes of velocities and magnetic field, and () the direction of velocities and the magnetic axis and rotation axis.
The recent work by Spruit & Phinney (1998) suggests that the cores of the progenitors of neutron stars cannot have the angular momentum to explain the rotation of pulsars. They propose that the rotation of pulsars and their spatial velocities must have a common origin. This suggestion was first made by Burrows et al. (1995). As Spruit & Phinney state, if the asymmetry is not directed radially during the formation, then the star acquires both linear and angular momentum. Cowsik (1998) has also advanced such a possibility.
In order to test this hypothesis, we need to understand a number of possibilities. In this case, the variables are, () number of impulses which the (proto-) neutron star receives, () duration of each impulse, () direction of each impulse. Let us assume that the direction of the impulses are random. From the numerical simulations of Deshpande et al. (1999), it is clear that if we have only one impulse (of any duration), the resultant direction of the velocity is perpendicular to the direction of the spin axis. After taking account of the projection effects in the plane of the sky, they show that the angle between the rotation and the proper motion axes should be biased towards . However, this is not what is seen observationally. Figure 6a shows that the distribution is consistent with a uniform distribution from zero to 90 degrees. Therefore, single impulses being responsible for both the velocity and the rotation of the star can be ruled out.


If the number of impulses are more, then the problem becomes complicated, and is a sensitive function of the duration of each of the kicks. First of all, we expect that the strength of the impulses required to produce the observed range of velocities goes down by , where is the number of impulses. The velocity dispersion as a function of the duration of a momentum impulse of a given magnitude remains constant up to a certain critical duration (), above which the azimuthal averaging reduces the resultant velocities. For impulse durations much smaller than , both the linear and angular momenta grow as , but the angle between them becomes random. However, for relatively longer duration impulses a significant preference of the direction of the linear momentum develops towards the spin axis, which itself is evolving. This is shown in Figure 6b, where the angle has a preferential bias towards zero degrees. Since observations do not support this either, we can conclude that long duration multiple impulses can also be ruled out.
To summarise, observationally we can conclude the following: (1) velocity magnitudes are not correlated to the magnetic field strength, (2) pulsar velocities are not in the direction of their magnetic axis or rotation axis, (3) if non-radial kicks produce both pulsar velocities and rotation, then the single kicks of any duration are ruled out, and (4) multiple kicks of long duration are ruled out.
7 Concluding remarks
I have given a brief summary of the kinematic properties of pulsars in this article. Though there are some pulsars which have significantly large spatial velocities (of the order of 1000 km/sec), on the average, there are strong evidences to show that the population has a three dimensional speed of about 200 to 250 km/sec. All the derived speed distributions show that the predominant number of pulsars move with such speeds. There are many empirical evidences to show that pulsars acquire a significant fraction of their velocities through an asymmetric supernova explosion.
Pulsar population shows a great deal of migration along both galactocentric radius and height from the plane. Because of this, they show significant asymmetric drift. This is one of the remarkable properties observed on pulsar population.
Millisecond pulsars, due to their evolutionary history, have significantly lower space velocities. Their average velocity is around 100 km/sec, and their kinematic properties in the Galaxy match well with those of the Low Mass X-Ray Binaries, supporting the idea that MSPs are born from LMXBs.
There are many models which have advanced many different ways of producing asymmetries during supernova explosions. Given the latest high-quality proper motion measurements and polarisation information with which we can determine the direction of rotation axis in the plane of the sky, one can test these models. These tests reveal that
-
•
Mechanisms predicting correlation between the rotation axis and the pulsar velocities are ruled out.
-
•
There is no correlation between the direction of magnetic axis and the direction of velocities.
-
•
There is no correlation between the strength of the magnetic fields and the magnitude of velocities.
-
•
If non-radial asymmetric impulses is responsible for both velocity and rotation of pulsars, then the scenario where the star receives a single impulse (of any duration) can be ruled out.
-
•
Even multiple impulses of long durations can be ruled out.
In principle, multiple short-duration impulses are not ruled out, as they would produce randomly oriented rotation and velocity axis. Similarly, we cannot rule out the possibility of having completely radial kicks as the origin of pulsar velocities. In this case, then the rotation of the pulsar will have nothing to do with the asymmetric explosion.
Acknowledgements
I would like to thank D. Bhattacharya, A. Blaauw, A. A. Deshpande, V. Radhakrishnan and E. P. J. van den Heuvel, for many fruitful discussions.
References
- [] Anderson, B. and Lyne, A. G. (1983) Nat, 303, 597
- [] Bagot, P. (1996) A&A, 314, 576
- [] Bhattacharya, D. and van den Heuvel, E. P. J. (1991) Phys. Rep., 203, 1
- [] Blaauw, A. (1961), Bull. Astr. Inst. Netherlands, 15, 265
- [] Blaauw, A. and Ramachandran, R. (1998), JApA, 19, 19
- [] Brandt, W. N. and Podsiadlowski, Ph. (1995), MNRAS, 277, 35
- [] Burrows, A. (1987) ApJ, 318, L57
- [] Burrows, A. and Hayes, J. (1996) PRL, 76, 352
- [] Burrows, A., Hayes, J. and Fryxell, B. A. (1995) ApJ, 450, 830
- [] Cordes, J. M. and Chernoff, D. F. (1997) ApJ, 482, 971
- [] Cowsik, R. (1998) A&A, 340, L65
- [] Deshpande, A. A. and Ramachandran, R. (1998) MNRAS, 300, 577
- [] Deshpande, A. A., Ramachandran, R. and Radhakrishnan, V. (1999) A&A, Accepted for publication
- [] Flannery, B. P. and van den Heuvel, E. P. J. (1975) A&A, 39, 61
- [] Fryer, C. and Kalogera, V. (1997) ApJ, 489, 244
- [] Gunn, J. E. and Ostriker, J. P. (1970) ApJ, 160, 979
- [] Hansen, B. M. S. and Phinney, E. S. (1997) MNRAS, 291, 569
- [] Harrison, E. R. and Tademaru, E. (1975a) ApJ, 201, 447
- [] Harrison, E. R. and Tademaru, E. (1975b) Nat, 254, 676
- [] Hills, J. G. (1983) ApJ, 267, 322
- [] Horowitz, C. J. and Li, G. (1998), PRL, 80, 3694
- [] Kalogera, V. (1996) ApJ, 471, 352
- [] Kalogera, V. (1998) in Neutron stars and Pulsars held in Rikkoyo University, Japan. eds. N. Shibazaki et al. p.27
- [] Kaspi, V. M. Bailes, M., Manchester, R. N. et al. (1996) Nat, 381, 584
- [] Keil, W., Janka, H.-Th. and Muller, E. (1996) ApJ, 473, L111
- [] Kuijken, K. and Gilmore, G. (1989) MNRAS, 239,571
- [] Kusenko A. and Segre, G. (1996) PRL, 77, 24
- [] Lai, D. (1996) ApJ, 466, 35
- [] Lai, D. and QIan, Y. (1998) ApJ, 495, 103
- [] Lipunov, V. M., Postnov, K. A. and Prokhorov, M. E. (1996) A&A, 310, 489
- [] Lorimer, D. R., Lyne, A. G. and Anderson, B. (1995) MNRAS, 275, L16
- [] Lyne, A. G. and Lorimer, D. R. (1994) Nat, 369, 127
- [] Manchester, R. N., Lyne, A. G., D’Amico, N. et al. (1996) MNRAS, 279, 1235
- [] Mihalas, D. and Binney, J. (1981) Galactic Astronomy, W. H. Freeman, New York
- [] Morris, D., Radhakrishnan, VB. and Shukre, C. S. (1976) Nat, 260, 124
- [] Narayan, R., Piran, T. and Shemi, A. (1991) ApJ, 379, 17
- [] Phinney, E. S. (1991) ApJ, 380, 17
- [] Portegies Zwart, S. F. and Spreeuw, H. N. (1996) A&A, 312, 670
- [] Ramachandran, R. (1996) Ph.D. Thesis, Osmania University
- [] Ramachandran, R. and Bhattacharya, D. (1997) MNRAS, 288, 565
- [] Shklowskii, I. S, (1970) Astr. Zu., 46, 715
- [] Spruit, H. C. and Phinney, E. S. (1998) Nat, 393, 139
- [] Tauris, T. and Bailes, M. (1996) A&A, 315, 432
- [] Taylor, J. H. and Cordes J. M. (1993), ApJ, 411,674
- [] Trimble, V. and Rees, M. (1971) IAU Symposium no. 46 held at Jodrell Bank, 1970, eds. Rodney Deane Davies, Francis Graham-Smith, Dordrecht, Reidel, p.273
- [] van den Heuvel, E. P. J. and Lorimer, D. R. (1996) MNRAS, 283, 37
- [] van den Heuvel, E. P. J. and van Paradijs, J. (1997) ApJ, 483, 399
- [] van Paradijs, J. and White, N. (1995), ApJ, 447, 33
- [] Wex, N., Kalogera, V. and Kramer, M. (2000) ApJ, 528 (in press, astro-ph/9905331)