Far infrared and Ultraviolet emissions of individual galaxies at z=0: selection effects on the estimate of the dust extinction
Abstract
We have cross-correlated Far Infrared (IRAS) and UV (FOCA) observations of
galaxies to construct a sample of FIR selected galaxies with a UV
observation at 0.2 m.
The FIR and UV properties of this sample are compared to the mean properties
of the local Universe deduced from the luminosity distributions at both
wavelengths. Almost all the galaxies of our sample have a FIR to UV flux ratio
larger than the ratio of the FIR and UV luminosity densities, this effect
becoming worse as the galaxies become brighter: the increase of the UV (0.2
m) extinction is about 0.5 mag per decade of FIR (60 m) luminosity.
Quantitative star formation rates are estimated by adding the contribution of
the FIR and UV emissions. They are found consistent with the corrections for
extinction deduced from the FIR to UV flux ratio.
A total local volume-average star formation rate is calculated by summing the
contribution of the FIR and UV wavelengths bands. Each band contributes for an
almost similar amount to the total star formation rate with
at z=0. This is equivalent to a global extinction of 0.75 mag
to
apply to the local luminosity density at 0.2m.
The trend of a larger FIR to UV flux ratio for a larger FIR luminosity found
for our sample of nearby galaxies is extended and amplified toward the very
large FIR luminosities
when we consider the galaxies detected by ISOCAM in a CFRS field and the Ultra
Luminous Infrared Galaxies at low and high redshift. A UV extinction is
tentatively estimated for these objects.
Key Words.:
Infrared: galaxies–Ultraviolet: galaxies–Galaxies: luminosity function–Galaxies: statistics1 Introduction
The problem of internal dust extinction in galaxies is difficult whereas its estimate is crucial for understanding the evolution of the Star Formation Rate from high redshift to now. At high z the emission observed in the visible corresponds to the UV rest frame where the effects of the dust extinction can be dramatic. For example the shape of the Madau plot (e.g. Madau et al. madau (1998)) depends a lot on the extinction adopted as a function of the redshift. Since the work of Calzetti, Kinney and collaborators from IUE data (e.g. Kinney et al. kinney (1993), Calzetti et al. calzkinn (1994)) the slope of the UV continuum in the range 1200-2600 Å() has been identified as a powerful indicator of the dust extinction. The reason is that only short lived stars contribute substantially to the emission in this wavelength range and the intrinsic shape of the spectrum is only sensitive to the recent star formation history. For example reaches a steady value as soon as the star formation rate has been constant for some years (Calzetti et al. calzkinn (1994)). An instantaneous starburst represents the most extreme case of a steep spectrum with equal to -2.7 ( Meurer et al. meurheckII (1995)). Once an intrinsic value for is adopted any deviation from this value is interpreted in terms of dust extinction which flattens the intrinsic slope. At high redshift is observable in the visible wavelength range and this has conferred a large interest to this approach.
Nevertheless, at least two difficulties arise when using this method: on the one hand the choice of an intrinsic UV slope (i.e. of a star formation history) can modify substantially the amount of extinction and has led to some discrepancies in the estimate of the extinction which can reach 1-2 mag in UV (Pettini et al. pettini (1998), Meurer et al. meurheckI (1997), Steidel et al. steidel (1999), Calzetti calzetti (1997)); on the other hand if the deviation of from its intrinsic value is indubitably a dust extinction tracer, deriving a quantitative value of the extinction from this deviation is difficult due to the various unknown factors like geometry or dust properties intervening in the estimate of the extinction (e.g. Calzetti et al. calzkinn (1994)). The quantification of the extinction is easier on nearby galaxies which can be obviously used as templates. The empirical approach of Calzetti and collaborators ( Calzetti et al. calzkinn (1994), Kinney et al. kinncalz (1994), Calzetti calzetti (1997)) had the advantage of providing a global attenuation curve for starburst galaxies accounting for geometrical effects in a statistical way.
Another powerful approach lies in making global energetic considerations. Indeed, for nearby templates, it is possible to perform a total energetic budget since the dust emission of these galaxies is almost always known from IRAS observations. Such considerations have led to quantitative estimates of the extinction (Buat & Xu buxu (1996), Meurer et al. meurheck (1999)). Recently, Meurer et al. (meurheck (1999)) have related the FIR to UV flux ratio and the UV slope to the extinction at 1600 Å. Their unreddened UV spectrum has a slope of -2.23 intermediate between a constant star formation rate and an instantaneous burst.
Uncertainties about the UV extinction are already present at low redshifts. Meurer et al. (meurheck (1999)) find an extinction around 1.8 mag at 1600 for the starburst templates observed by IUE whereas we find 1.3 mag at 2000 for a sample of nearby starburst galaxies (Buat & Burgarella bubu (1998)) and around 0.8 mag for more quiescent disk galaxies (Buat & Xu buxu (1996)). The difference is likely to be due at least in part to the properties of the individual galaxies used for these studies but also to different assumptions about the dust absorption as it will be discussed below.
We need to know how to correct individual galaxies for extinction but also how
the properties of these individual cases can be extrapolated to the entire
population of galaxies. This problem is especially important at high z since as
we go farther only the brightest objects become visible. With the availability
of the luminosity functions at various wavelengths we have now the possibility
to test if the results deduced from the properties of individual galaxies are
representative of the mean characteristics deduced from the local luminosity
functions.
The basic idea of this paper is to compare the FIR (60 and 100
m) and UV(0.2m) of a sample of nearby galaxies for which selection
biases are well known. The sample will be FIR selected and the aim is to
study how much these individual galaxies thus selected trace the mean properties
of the local universe. After a presentation of our IRAS/FOCA sample (section
2), we discuss the FIR and UV properties of the individual galaxies in terms of
extinction and selection biases in section 3. The section 4 is a comparison with
the luminosity functions at both wavelengths. In section 5 we derive
quantitative star formation rates from the FIR and UV emissions. Endly, in
section 6 we compare
the FIR and UV properties of Ultra Luminous Infrared Galaxies
both at low and high redshift and of the ISOCAM detections of
intermediate redshift galaxies in a CFRS field with those of our IRAS/FOCA
sample of
nearby galaxies.
2 The IRAS/FOCA sample
| Field number | (1950) | (1950) | Exposure | time (s) | Field diameter |
|---|---|---|---|---|---|
| h m s | d m s | FOCA1000 | /FOCA1500 | deg | |
| 12 | 00 34 43.9 | +40 03 27 | 1200 | / | 2.3 |
| 54 | 03 46 58.4 | +22 05 37 | 600 | / | 2.3 |
| 10 | 08 17 26.1 | +20 54 25 | 1400 | / | 2.3 |
| 51 | 08 48 36.0 | +43 54 51 | 600 | /800 | 2.3 |
| 18 | 08 51 57.6 | +78 20 18 | 600 | / | 2.3 |
| 82 | 09 58 57.0 | +69 01 41 | 2400 | / | 2.3 |
| 67 | 11 42 45.5 | +20 10 03 | 600 | /1600 | 2.3 |
| 33 | 11 59 04.1 | +65 13 04 | 2000 | / | 2.3 |
| 81 | 12 19 29.2 | +47 27 34 | 600 | / | 2.3 |
| 71 | 12 18 16.7 | +15 49 06 | /800 | 1.5 | |
| 50 | 12 25 09.4 | +08 53 13 | 450 | / | 2.3 |
| 34 | 12 26 02.3 | +12 23 39 | 1800 | / | 2.3 |
| 28 | 12 57 08.1 | +28 20 06 | 3000 | / | 2.3 |
| 30 | 13 03 47.1 | +29 17 48 | 3000 | /1200 | 2.3 |
| 31 | 13 09 32.4 | +28 07 52 | 1050 | / | 2.3 |
| 96 | 13 29 50.2 | +47 29 28 | /1200 | 1.5 | |
| 90 | 13 39 52.9 | +28 37 38 | 300 | /3600 | 2.3 |
| 29 | 14 01 04.2 | +54 54 21 | /1200 | 1.5 | |
| 91 | 15 16 01.9 | +02 15 51 | /1200 | 1.5 | |
| 89 | 15 36 52.8 | +34 50 13 | /3600 | 1.5 | |
| 36 | 16 39 16.7 | +36 17 46 | /800 | 1.5 | |
| 39 | 17 15 35.0 | +43 11 21 | /1200 | 1.5 |
2.1 Construction of the sample of galaxies
The FOCA balloon borne wide-field UV camera (Milliard et al. milliard (1994)) has observed a cumulated sky surface of square degrees in a 150 wide band-pass centered near 0.2 . The camera (a 40-cm Cassegrain telescope with an image intensifier coupled to a IIaO emulsion film) was operated in two modes, the FOCA 1000 (f/2.6) and FOCA 1500 (f/3.8), which provide 2.3 field of view, 20 resolution, and 1.5 field of view, 12 resolution, respectively. The typical limiting depth in one hour observing time is where the magnitude is defined by where the flux f is in (Donas et al. donas (1991)). Here we have considered the 22 calibrated fields ( 70 square degrees), in order to cross correlate them with the observations of the IRAS satellite. Table 1 gives the coordinates of the guide star (near the field center), the total exposure time and the size for each field.
The infrared objects of the IRAS Faint Sources Catalog (FSC) have been associated to sources from other astronomical catalogs. Such cross-correlations are very useful to determine the nature of the sources detected. Unfortunately only a small proportion of UV sources have an identification in an other catalog. So we have chosen to start from the IR detections for which much data are available and to search for their UV counterparts. Therefore our sample will be FIR selected.
For each UV field, we have extracted the FIR sources detected by IRAS at 60
and/or 100 microns and listed in the IRAS FSC. This has been done using the
VIZIER facility of the Centre de Données astronomiques de Strasbourg (CDS).
364 IR sources have been selected.
Since we are only interested by the
extragalactic targets we have kept only the objects associated to known galaxies
from the catalog of associations of the FSC. 102 from the 364 sources at 60 or
100 microns have been securely identified as galaxies. We have only kept
galaxies which are
not confused with a neighboured source present in cross-correlated catalogs
Then we have searched for a UV
source matching each FIR detection of a galaxy in a circle of 45 arcsec radius
centered on the IRAS coordinates. 94 galaxies have been identified both in UV
and FIR. 8 FIR sources identified as galaxies have no UV counterpart. Few
cases of several UV sources present in the circular area have been judged
doubtful and discarded.
To
avoid a contamination in the IR detection only galaxies with a cirrus flag lower
than or equal to 2 are selected as adviced in the IRAS Faint Source Catalog. We
are then left with 80 galaxies with a UV measurement and with 8 galaxies
detected by IRAS and not identified in UV.
Endly we exclude nearby ellipticals
and S0 galaxies present in our sample since we are only concerned by star
forming galaxies. Very extended galaxies like M101 or M51 are excluded from the
study since the photometry of these objects needs a special treatment. Our
final sample contains 76 galaxies.
Complementary data necessary to the study of this sample like the optical identification, the B magnitude, the distance modulus are taken from the LEDA and NED databases. The fluxes are corrected for Galactic extinction using the Milky Way extinction curve of Pei (pei (1992)). Throughout the paper h will be defined as .
| IRAS name | ||||||
|---|---|---|---|---|---|---|
| Jky | Jky | mag | mag | mag | ||
| F11431+2037 | 0.329 | |||||
| F12041+6519 | 0.206 | 0.60 | 17 | 17.2 | 1.11: | 2.3: |
| F12235+0914 | 0.260 | 15 | ||||
| F12242+0919 | 0.331 | 14.75 | ||||
| F12259+1141 | 0.266 | 18.4 | ||||
| F13041+2907 | 0.297 | 0.53 |
2.2 The galaxies not detected at 0.2 m
8 galaxies detected by IRAS at least at 60 m do not appear in our UV
frames. For one of them (F15451+0132), the non detection is explained by the
fact that the galaxy is located on the edge of the UV image. Another source,
F13038+2919, lies on the wings of the UV bright guide star (spectral type A3,
). The UV identification of F12041+6519 (identified as
MCG 11-15-022 in NED) at 60 arcsecs from the IRAS coordinates is quite
uncertain
. In table 2 are gathered the galaxies for which we can estimate an upper
limit
for their UV flux and F12041+6519 whose identification is uncertain. These
galaxies are faint even in FIR: 4 of them are only detected at 60 m with
a
very low flux.
F13041+2907 and F11431+2037 have no optical counterpart,
F13041+2907 is also
detected at 1.4 GHz by FIRST (NED database).
F12259+1141, F12235+0914 and F12242+0919 are three galaxies located
in the
Virgo cluster area and identified by Yuan et al. (yuan (1996)):
F12259+1141 (VCC1099) is a faint galaxy classified as
dE;
F12242+0919 (VCC0934) a background blue galaxy classified Sa with a
radial velocity equal to 6938 km/s; F12235+0914 is identified as VCC0864 and
classified as Im or dE.
3 The FIR to UV flux ratio of individual galaxies
3.1 The FIR to UV flux ratio as an indicator of dust extinction
The FIR to UV ratio in star forming galaxies is now well recognized as a
powerful indicator of extinction. The basic idea is to perform an energetic
budget: the amount of stellar emission lost due to the extinction is
re-emitted by the dust in the FIR. Nevertheless the quantitative calibration
relies on models. In galaxies with an active star formation activity the
heating of the dust is mostly due to the emission of young and massive stars;
therefore the FIR to UV flux ratio is expected to be tightly related to the
extinction. Following this approach, Buat and Xu (buxu (1996)) have estimated
the extinction at 0.2 m in star forming galaxies using a radiation
transfer
model. Meurer et al. (meurheck (1999)) have followed a more empirical way to
relate the FIR to UV ratio to the extinction at 0.16 m using a dust screen
model and various extinction curves. They obtained a relation between the
extinction and the FIR to UV flux ratio and then between the extinction and the
UV slope .
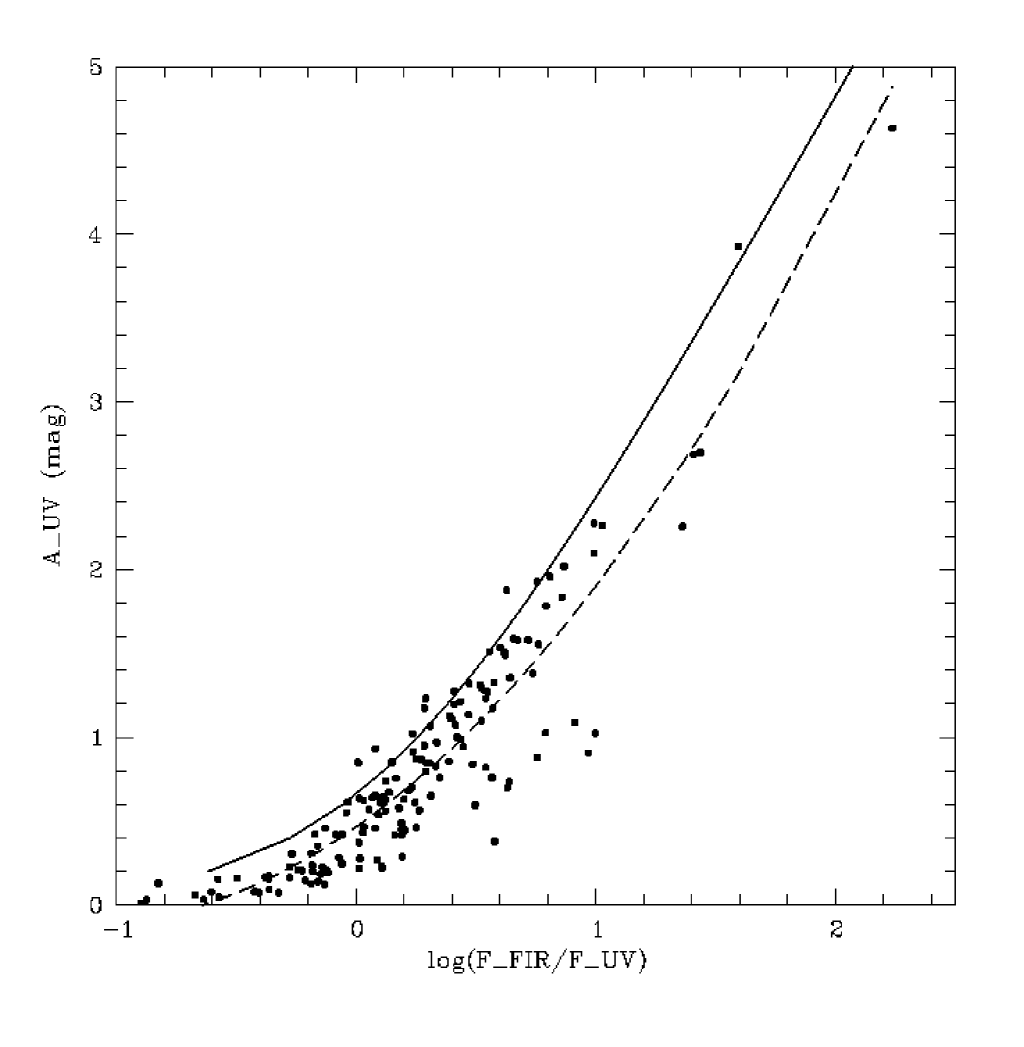
The results of both studies are compared in figure 1. The FIR flux is taken in
the range 40-120 m as a combination of the emission at 60 and 100 m
(Helou et al. helou (1988)) and the UV flux is defined as where is a flux per unit wavelength.
The extinction estimated by the model of Meurer et al. is calculated using
their
relation between the FIR to UV flux ratio and the extinction:
It is shown as the
solid curve in figure 1.
The results found by Buat and Xu (buxu (1996)) for their sample of nearby
galaxies are also reported in figure 1. A polynomial fit on the individual
points gives:
The fit is reported as the dotted curve in figure 1.
We must account for the difference in wavelengths used in the two studies. First, we discuss the difference between the UV flux of galaxies at 0.2 or 0.16 m which affects the x-axis of the figure 1. Deharveng et al. (deharveng (1994)) have found the fluxes at 0.165 m of a sample of nearby galaxies systematically higher by 29% than the fluxes at 0.2 m. Adopting this result, the definition of the UV fluxes as almost cancels the effect of wavelength and we can consider the fluxes at 0.16 and 0.2 m as similar.
The extinctions at 0.16 m and 0.2 m ( and ) plotted along the y-axis of the figure 1 can also be considered as similar: their ratio is expected to vary from 0.9 to 1.1 using the extinction curve of the MW, LMC (Pei pei (1992)) or that of Calzetti (calzetti (1997)). Therefore we will note both values as without any correction.
The UV extinctions derived from the two methods when the FIR to UV flux ratio of a galaxy is known are tightly correlated (correlation coefficient 0.99) since both are directly related to this FIR to UV flux ratio: the calculations of Meurer et al. lead to an extinction systematically larger than ours, The difference is mag for low FIR to UV flux ratio () and reaches mag for . This difference may arise from the different assumptions and calculations made in the two studies. Since they are interested by starburst galaxies Meurer et al. use a galaxy spectrum obtained from a constant star formation rate for at most years whereas we use empirical broadband spectra: the contribution of the old evolved stars to dust heating is certainly larger in our approach leading to a lower UV extinction for the same amount of dust emission. Another major difference is the treatment of geometrical effects. Meurer et al. use a screen model and we calculate the extinction with a radiation transfer model in an infinite plane parallel geometry where dust and stars are uniformly distributed and which accounts for scattering effects and disk inclination (Xu & Buat xubu (1995)). Finally we assume a Milky Way extinction curve whereas Meurer et al. adopt a uniform UV extinction for the entire spectrum of the starburst. Therefore, our model is probably more appropriate for normal star-forming galaxies and the entire disk of starburst galaxies whereas the calculations of Meurer et al. are made for starburst regions. Given these fundamental differences and the rather large uncertainties on the corrections for extinction the two methods are in reasonable agreement. The FIR to UV flux ratio appears relatively insensitive to the dust characteristics (type, distribution) and the stars/dust geometry. This has been confirmed by the recent study of Witt & Gordon (witt (1999)) who explore various dust distributions (homogeneous or clumpy), extinction properties (Milky Way or Small Magellanic Cloud) and stars/dust distributions ( uniform mixture or shells). Such a robustness makes the FIR to UV flux ratio a reliable quantitative tracer of the dust attenuation in star forming galaxies.
3.2 The variation of the FIR to UV ratio: the influence of the FIR selection
One basic difficulty of these studies based on individual galaxies is that the samples used are all biased and sometimes in a very complicated sense. The diagnostics on the UV slope of nearby galaxies all derive from the compilation of Kinney et al. (kinney (1993)) of IUE observations of starburst galaxies which is not complete in any sense. Buat and Xu (buxu (1996)) have used samples of star forming galaxies selected on their UV and FIR emissions leading to very complicated biases. Whereas the use of sample of galaxies which may be strongly biased is probably not a limitation to calibrate the physical link between the FIR to UV flux ratio and the extinction, the presence of these biases must be accounted for when generic properties of galaxies are deduced from these samples.
Our purpose is to use our FIR selected galaxy sample to test the influence of such a selection on the deduced value of the FIR to UV ratio. We will consider both fluxes at 60 m and in the range 40-120 m, the so-called FIR flux. Each one has its own advantages: on one hand more galaxies have a measured flux at 60 m than at 100m and the luminosity function has been derived at 60 m, on an other hand the FIR emission over the range 40–120 m is more easily related to the total emission of the dust and hence to the amount of extinction than a single band flux.
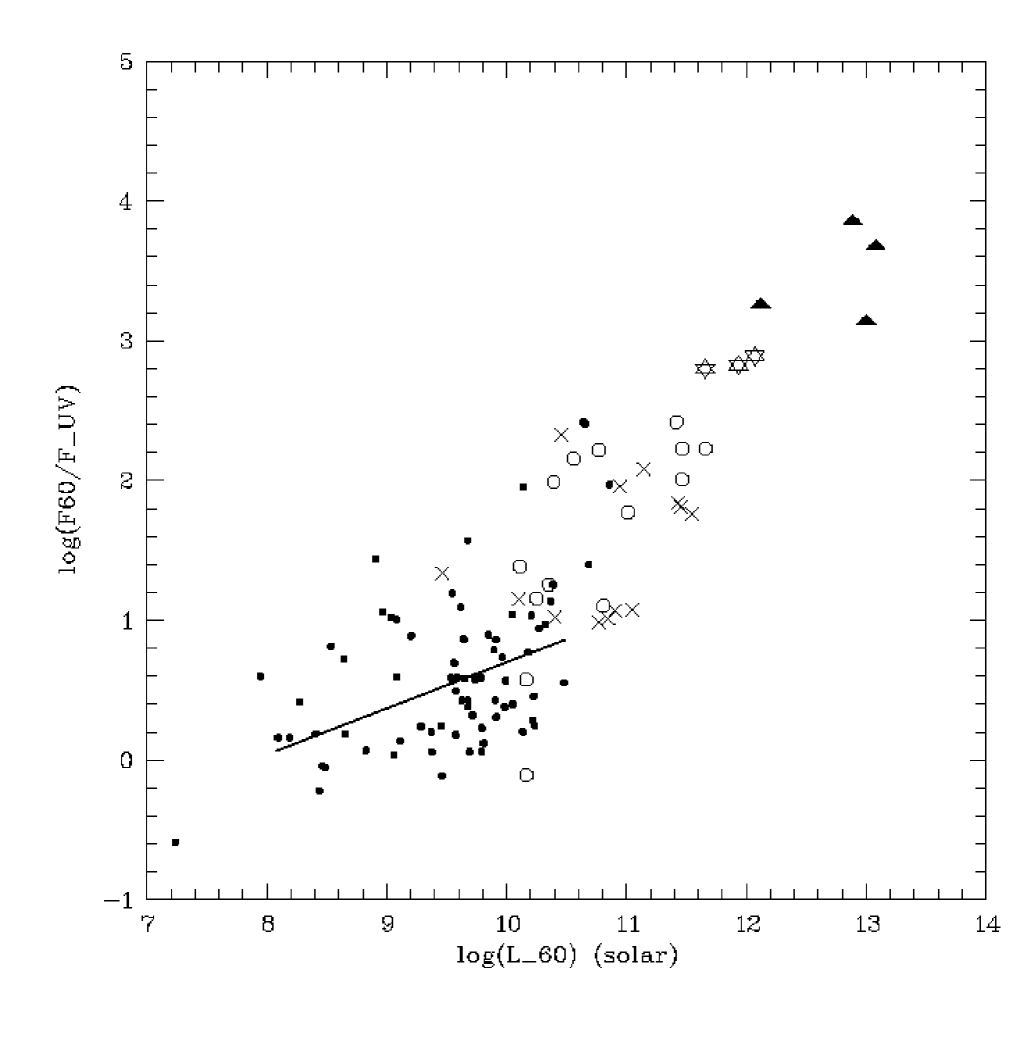
In this section, we only discuss the observational biases and therefore use the data at 60 m. In figure 2 is reported the ratio of fluxes at 60 m and 0.2 m, as a function of the flux and luminosity of the galaxies at 60 m. and are of the form where is a flux per unit wavelength. The figure 2a with the flux of the galaxies can be used to study the selection bias in limited flux samples. The figure 2b where are reported the luminosities of the galaxies is useful to discuss the intrinsic properties of the galaxies.
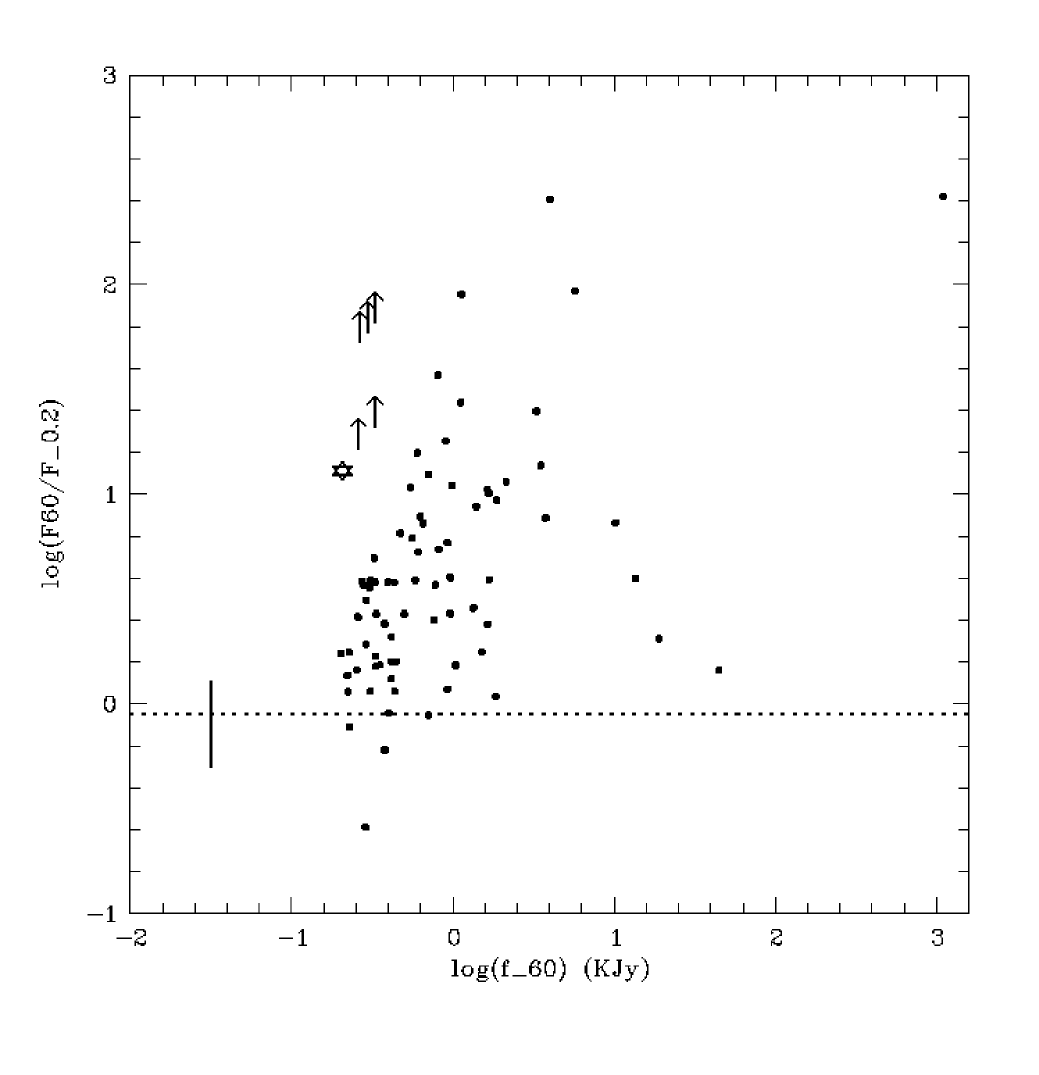
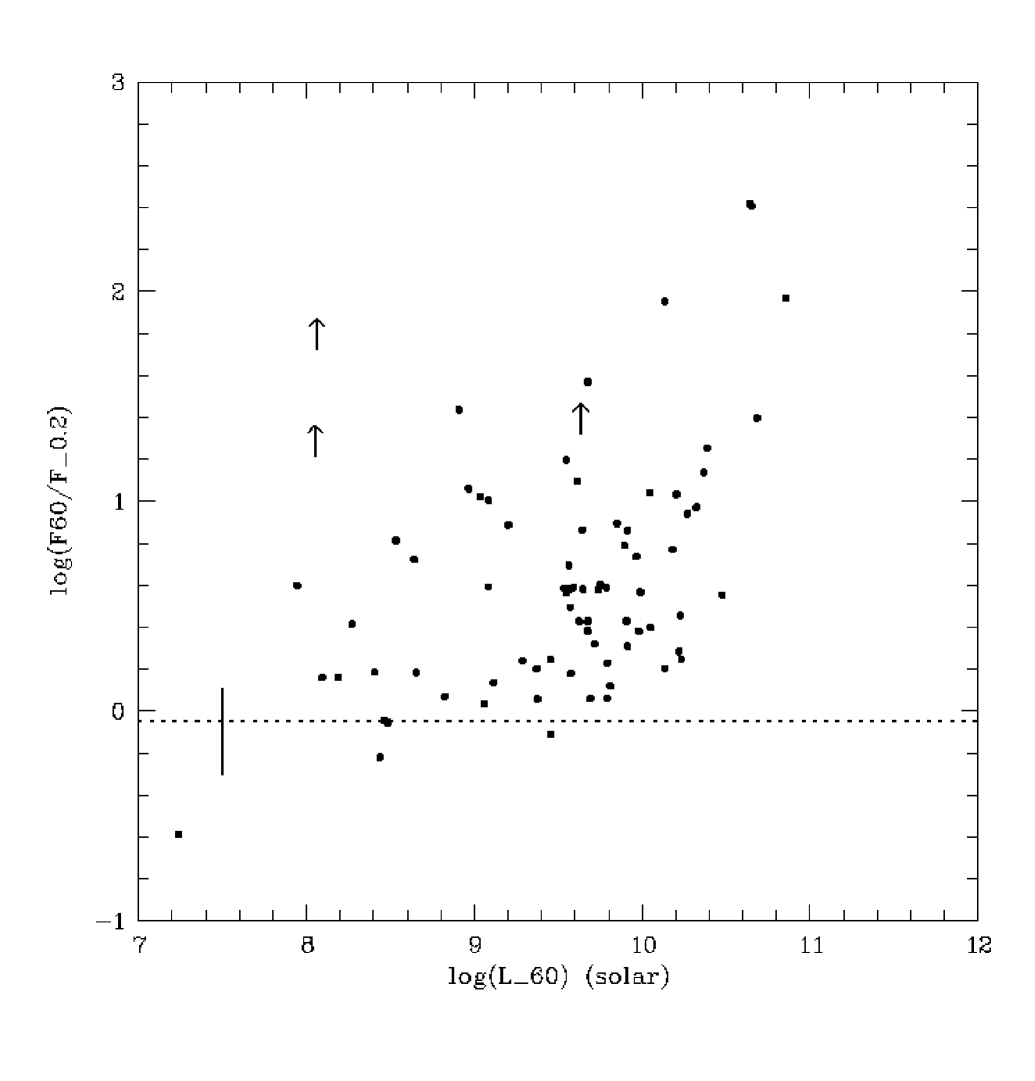
There is a clear trend in both figures in the sense of a larger ratio for brighter galaxies at 60 m. The tail found in figure 2a at large 60 m flux toward low ratios is due to very nearby galaxies. This effect of distance disappears when the luminosity is considered (figure 2b). In order to highlight the general trend we have calculated a moving median on the sample. The data are sorted according to the 60 m luminosity, then a median is calculated for bins of 11 objects each time shifted by 5 objects. The result is shown in figure 3. As expected the moving median has reduced the dispersion of the data and flattened the dispersed trend of the figure 2b. A linear fit gives
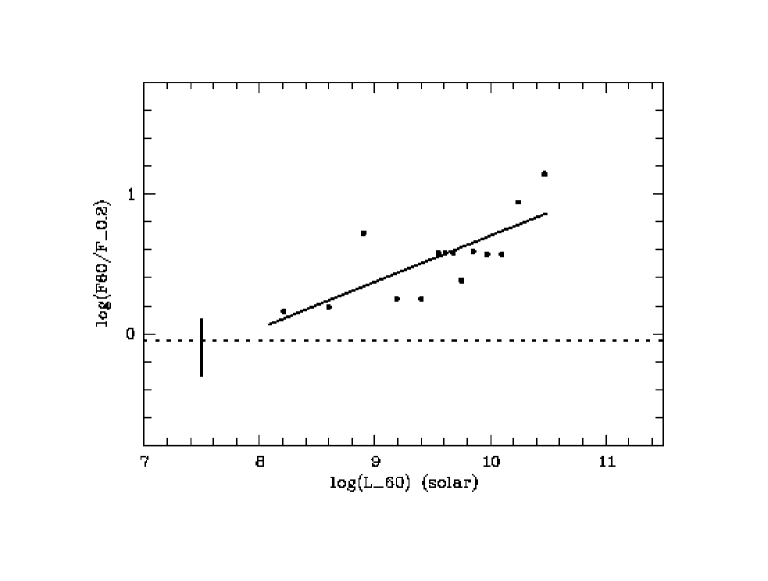
These figures illustrate the bias introduced by a FIR selection. As we consider galaxies with an increasing 60 m flux or luminosity, their ratio also increases and is less and less representative of the mean properties of the local Universe as we will see below.
3.3 The galaxies detected at 60 m and not at 0.2 m
The case of these galaxies is especially interesting since they are good candidates for very obscured galaxies. Nevertheless their low number (5 cases, section 2.2) makes them having no or little influence on the statistical properties discussed in this paper. Moreover, little information is known about these objects. Only one galaxy (F12242+0919) has a known redshift in the NED database.
The ratio of each object is reported in table 2 and plotted in figure 2a. The upper limits found for these galaxies are compatible with the values found for some galaxies of the IRAS/FOCA sample but their location in the figure is surprising since they do not follow the general (although dispersed) trend of a larger flux for a larger ratio. However, only the figure 2b where the luminosity of the galaxies are reported has a physical meaning and unfortunately only one object (F12242+0919) has a measured redshift. Since F12235+0914 and F12259+1141 are classified by Yuan et al. as members of the Virgo cluster we assign them a distance of 17 Mpc. These three galaxies are reported in figure 2b. For the most luminous (F12242+0919) the upper limit of is compatible with the general trend, the two faint Virgo dwarfs clearly disagree. Due to their faintness not much information is available for them, F12259+1141 is classified as dE and F12235+0914 dE or Im. A large FIR to UV ratio is not expected for elliptical galaxies, therefore these objects are probably not dE. We will see in section 6 that even the most FIR bright and extincted objects known in the Universe follow and extend the trend found in figure 2b so the behavior of these two objects is difficult to understand.
We can try to estimate an extinction for the objects listed in table 2. Only two (F12041+6519, F13041+2907) have been detected at both 60 and 100m. For these two galaxies we have the FIR flux to estimate the UV extinction (a lower limit for F13041+2907) using the formula (polynomial fit) established in section 3.1. For the galaxies not detected at 100 m we estimate arbitrarily this flux such as which is intermediate between the values for warm and cool dust (Lonsdale & Helou lonsdale (1987)), if this value is incompatible with the upper limit, we adopt the upper limit. The extinctions are listed in table 2. Adopting the relation of Meurer et al. leads to extinctions larger by 0.4 mag.
Three galaxies have a UV extinction larger than 3.5 mag, they are the two objects without any optical identification and the faintest galaxy of the table 2 detected in B. The three other cases (two non detections and the uncertain one) are less extreme ().
Note that the upper limits found for these galaxies are compatible with the values found for some galaxies of the IRAS/FOCA sample (figures 2). For example the two most extincted galaxies of our sample, namely M82 and IC732, have a UV extinction larger than 5 mag and a ratio larger than 2 in log unit.
4 Comparison with the luminosity functions and densities in the local universe
4.1 The ratio of the luminosity densities
The luminosity functions and luminosity densities of the local universe are available at both wavelengths (0.2 and 60 m). Therefore we can compare some of their properties to the characteristics of individual galaxies. The 60 m local luminosity function and density at z=0 have been calculated by Saunders et al. (saunders (1990)). The 0.2 m luminosity function and density have been derived by Treyer et al. (treyer (1998)) at a mean z=0.15. From these studies we can calculate the ratio of the local luminosity densities at z=0. To this aim we correct the UV density for the redshift evolution. From Madau et al. (madau (1998)) we estimate that the luminosity density increases by a factor from z=0 to z=0.15 which is consistent with the estimates of Lilly et al. (lilly (1996)) and Cowie et al. (cowie (1999)). Applying this factor to the estimate of Treyer et al. we obtain . With we find at z=0. In the same way, from (Saunders et al. saunders (1990)), we calculate .
is reported in figures 2 and 3. The ratio appears lower than almost all the ratios found for individual galaxies and is systematically lower than all the median values calculated for increasing 60 m luminosity (figure 3). Therefore the study of individual galaxies of our sample does not lead to a reliable estimate of the mean FIR to UV ratio of the local Universe.
Our sample is FIR selected since we have searched for FIR galaxies detected in UV, therefore a bias toward large FIR to UV flux ratio is expected and this bias increases as we select brighter galaxies (figure 2). For comparison, we can also re-consider the sample used by Buat & Xu (buxu (1996)) : the galaxies were primarily selected to have a UV measurement and then searched in the IRAS database. Only galaxies detected both in UV and FIR are considered. Whereas the selection biases of this sample are very complicated since the primary selection is on the UV the bias toward the FIR is certainly less strong than for the IRAS/FOCA sample.
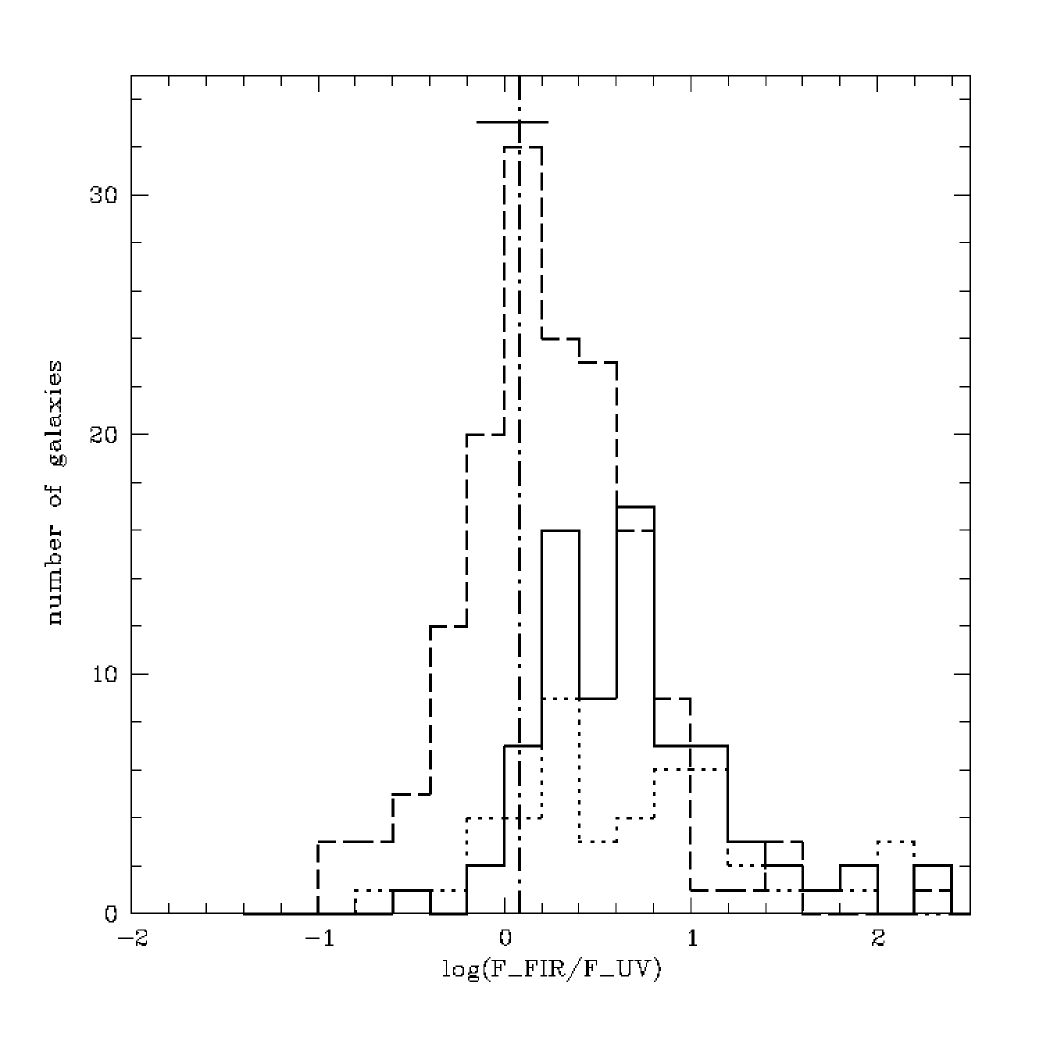
In figure 4 the histograms of ratio are reported for three samples: the IRAS/FOCA sample (solid line), the IUE/IRAS templates of Meurer et al. (meurheck (1999)) (dotted line) and the sample of Buat & Xu (dashed line). We can see that almost all the IRAS/FOCA galaxies and the local IUE/IRAS templates exhibit a larger ratio than the ratio of the local luminosity densities . The situation is less extreme for the Buat & Xu sample for which the median of the flux ratio is 1.66, translating to (0.94 mag with the formula of Meurer et al.). This difference in the FIR and UV properties of the samples explains the rather low extinction found by Buat & Xu for this sample as compared with those obtained by Meurer et al.
The mean property of the local Universe in terms FIR to UV luminosity density ratio is not well represented by the samples of galaxies considered here. Therefore much caution must be taken to estimate global correction for extinction to be applied to the luminosity function.
4.2 The local luminosity functions
An explanation for the discrepancy between the ratio of individual galaxies and the ratio of the local luminosity densities is that it is not the same galaxies which form the bulk of the UV emission on one hand and the FIR emission on the other hand. Indeed, the large difference found in the shape of the two luminosity functions is consistent with this explanation as already discussed in Buat & Burgarella (bubu (1998)). The adopted value of depends on the reliability of the luminosity functions and is subject to some uncertainties. Nevertheless very large modifications must be invoked to make consistent the ratios in our IRAS/FOCA sample and the mean value of the local universe. Moreover it would not explain the trend found of an increase of the ratio with the FIR luminosity of the galaxies.
We have evaluated the contribution to the luminosity function and the luminosity density at 0.2 m (resp. 60m) of the galaxies as a function of their intrinsic luminosity (per decade of luminosity). These values are reported in table 3 (resp 4) together with the number of galaxies of our IRAS/FOCA sample in each bin of luminosity (in log unit). The luminosity functions are truncated at .
| percentage of galaxies | relative contribution | percentage of galaxies | |
| solar unit | from the luminosity function | to the local UV density | in the IRAS/FOCA sample |
| 7-8 | 77.3 | 17 | 11 |
| 8-9 | 19.3 | 36 | 33 |
| 9-10 | 3.2 | 36 | 56 |
| 10-11 | 0.2 | 11 | 0 |
| percentage of galaxies | relative contribution | percentage of galaxies | |
| solar unit | from the luminosity function | to the local 60 density | in the IRAS/FOCA sample |
| 7-8 | 45.4 | 2 | 3 |
| 8-9 | 35.6 | 15 | 17 |
| 9-10 | 16.2 | 40 | 56 |
| 10-11 | 2.7 | 34 | 24 |
| 11-12 | 0.1 | 8 | 0 |
As expected for a magnitude limited sample, our individual galaxies do not
truly sample the luminosity functions. This effect is dramatic in UV: the
steepness of the faint end slope of the UV luminosity function (Treyer et al.
treyer (1998)) implies a large number of faint galaxies. These objects largely
contribute to the UV luminosity density. The relative numbers of galaxies in
each bin of UV luminosity are similar to those used by Treyer et al. to
calculate the
UV luminosity function.
Conversely, the FIR luminosity function is better sampled in the sense that the
deficiency of low luminosity galaxies has less implications than in UV. Indeed,
the FIR luminosity function is extremely flat at low luminosities (Saunders et
al. saunders (1990)) and the contribution of the faint FIR galaxies to the
local luminosity density is very low. As a consequence the number of galaxies
in each bin of luminosity is more representative of its contribution to the FIR
luminosity density than in UV. The bright end of both luminosity functions is
not represented in the IRAS/FOCA sample because of the scarcity of these objects
and the small statistics. In terms of global (cumulated) luminosity of our
sample of individual galaxies we are entirely dominated by the galaxies between
and at both wavelengths (0.2 and 60 m) but
this does not influence our results since each galaxy is considered individually
whatever its luminosity is, without any summation on individual objects.
Hence our sample IRAS/FOCA sample of individual galaxies is more representative of the FIR properties of the universe. If the faint UV galaxies are dwarf galaxies they probably have a low extinction and therefore a low FIR to UV ratio. Our sample being FIR selected, it is probably biased against these objects.
A consequence of these effects is that when a correction for extinction is calculated from individual galaxies using such a correction to correct the entire luminosity function can lead to some mistakes as we will discuss in the next subsection.
4.3 Consequences on the estimate of the UV extinction for large samples of galaxies and statistical studies
Most of the time neither the FIR flux nor the UV continuum ( slope) are available for large and/or deep surveys of galaxies and one cannot use these dust extinction calibrators. The situation is better at high z due to the redshifting of the UV continuum. For instance Meurer et al. (meurheck (1999)) have performed individual corrections on the Lyman break U-dropouts galaxies at in the HDF by estimating the slope from the V and I measurements. Nevertheless they sampled only bright galaxies ( i.e. whose UV luminosity is larger than ) since only such bright objects are reachable at high z.
The problem of the correction for extinction arises when one has to derive an intrinsic UV luminosity distribution (Treyer et al. treyer (1998), Steidel et al. steidel (1999)). At low redshift the UV slope is not available for the moment on a large sample of galaxies and cannot be used to correct the UV luminosity function for dust extinction. The extinction has been found to vary as a function of the absolute bolometric magnitude of the galaxies (e.g. Wang wang (1991), Heckman et al. heckrob (1998), Buat & Burgarella bubu (1998)). Unfortunately, the UV luminosity is not a good tracer of the bolometric luminosity of a galaxy since it is expected to be very influenced by the current star formation activity. Moreover the extinction (larger for brighter galaxies) adds an anti correlation between the observed UV luminosity and the bolometric one. Therefore, relating the extinction to the UV luminosity is not possible. Indeed no correlation exists between the UV luminosity and the FIR/UV ratio in the IRAS/FOCA sample or that previously used by Buat & Xu (buxu (1996)). In the same way Heckman et al. (heckrob (1998)) have used the sum of the FIR and UV luminosities as a tracer of the bolometric luminosity.
The use of the absolute B magnitude is also far from ideal since it suffers from the same caveats as the UV luminosity (star formation history and extinction), although in a less extreme way. Actually a trend has been found between the ratio of the dust to UV emission and for a sample of nearby starburst galaxies (Buat & Burgarella bubu (1998)) but the relation is too dispersed to be used as a quantitative calibrator of the extinction. More promising is the use of data at longer wavelengths like the R or I band: the effects of extinction will be largely reduced and we can hope to better trace the mass of the galaxies. Such investigations are devoted to a subsequent paper.
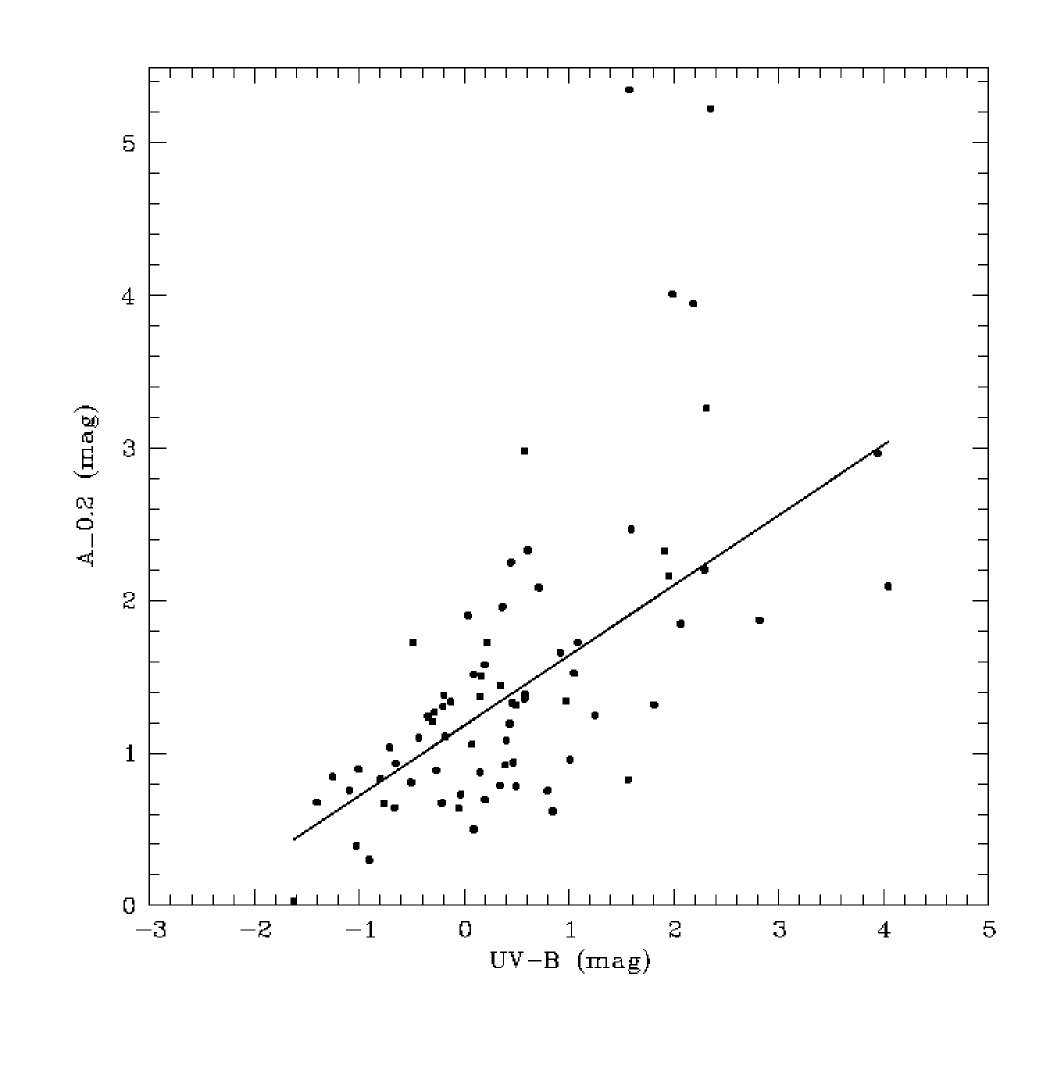
We have also compared the extinction deduced from the FIR/UV flux ratio (, section 3.1) to the UV-B color since this color is often available for large samples (e.g. Treyer et al. treyer (1998)). The extinction is plotted against the UV-B color for our IRAS/FOCA sample in figure 5.
A correlation is found between these two quantities (R=0.70). Indeed, a clear correlation has already been found between the FIR/UV flux ratio and the UV-B color (Deharveng et al. deharveng (1994)) which has been interpreted to be due at least in part to the influence of the dust extinction (Buat et al. buetal (1997)). The UV-B color is also sensitive to the star formation history on timescales of the order of some years: it is likely to be at the origin of the dispersion found in figure 5 and only rough tendencies can be securely deduced. Nevertheless, it appears necessary to account for the variation of the extinction among galaxies which can vary by three magnitudes. In particular galaxies with a UV-B color lower than are very little affected by the extinction and it would seem reasonable to apply no correction of extinction to them.
5 Estimating star formation rates
Both FIR and UV emissions are powerful star formation tracers. To derive reliable star formation rates (SFRs) one must account for the repartition of the emission of young stars in both wavelength ranges since the stellar emission lost by dust extinction is re-emitted in the FIR.
As already proposed by Heckman et al. (heckrob (1998)), perhaps the best way
is
to consider both UV and FIR emissions: each emission can be related to the
star formation rate and the sum of the two SFRs deduced from the FIR and the
UV
should account for the total emission of young stars.
In such an approach the uncertainty resides in the translation of the UV and FIR
emissions into quantitative star formation rate. The UV flux is directly
proportional to the star formation rate provided that the star formation has
been constant for some years and assuming a universal initial mass
function (IMF). We have used the models of Leitherer et al. (leitherer (1999))
for different IMFs (Salpeter IMF (-2.35) or -2.5, upper mass limit 100 or 125
M for a lower mass limit equal to 0.1 M). The metallicity is
taken solar. After 5 years of constant star formation the production of
the UV luminosity reaches stationarity : at 0.2 m for a Salpeter IMF and an upper mass limit of 125
M. Nevertheless after 5 years the UV luminosity reaches more than
80 of this stationary value. For the same IMF, using Madau estimations
(madau (1998)) based on the models of Bruzual & Charlot Treyer et al.
(treyer (1998)) have adopted a conversion factor equal to
i.e. a difference of . The
uncertainty due to the IMF is around . Therefore we can
conservatively estimate that the uncertainty on the conversion of the UV
luminosity in star formation rate is provided that the galaxy has formed
stars continuously for some years.
The link between the SFR and the FIR luminosity is more indirect than for the UV
luminosity since it depends of the dust heating which involves all types of
stars. Nevertheless, in starbusting galaxies the situation is expected to be
less complex since the dust heating is dominated by the young stars. Under such
conditions Kennicutt (kennicutt (1998)) has related the FIR luminosity to the
star formation rate where is the total FIR luminosity. This conversion factor
is obtained using synthesis population models and is also subject to
uncertainties on the stellar tracks, the IMF or the star formation history.
From a comparison with the calculations of Lehnert & Heckman (lehnert (1996)),
Meurer et al. (meurheckI (1997)) and Buat & Xu (buxu (1996)) we estimate the
uncertainty of the order
of 50 for .
Therefore we can reasonably estimate that the SFR deduced from the observed UV luminosity added to that deduced from the FIR one is also uncertain by a factor . Nevertheless it must be noticed that the conversion formulae only apply to galaxies which have experimented a continuous star formation for at least years and will not be valid for galaxies with more episodic star formation, especially post starbursting galaxies.
5.1 The IRAS/FOCA sample
The IRAS/FOCA sample is FIR selected, thus it is biased against very blue dwarf galaxies which may exhibit episodic bursts of star formation as suggested by Fioc & Rocca-Volmerange (fioc (1999)). Therefore we can expect that the derivation of a SFR from the FIR and UV emissions is valid for this sample of galaxies. The comparison of the star formation rates obtained by adding the FIR and UV (observed) emissions to those deduced from the UV fluxes after a correction for extinction can be useful to test the consistency of both methods. Therefore we have calculated the star formation rates for the IRAS/FOCA sample of galaxies adding the contribution of the FIR and UV (not corrected for extinction) emissions and using the conversion formula of Treyer et al. (treyer (1998)) for the UV and Kennicutt (kennicutt (1998)) for the FIR. Total FIR fluxes have been estimated using the relation found by Buat & Burgarella (bubu (1998)) between the ratio of the total dust flux to the FIR (40-120m) flux and . The estimated SFRs can be compared to the ones obtained after correction of the UV fluxes from extinction. The correlation between the two estimates is very good but the SFRs deduced from the () emissions are higher than the SFRs deduced from the UV corrected emission by a factor 1.4. Another interesting comparison is that of the relative contribution of the UV (not corrected for extinction) and FIR emissions to the total () SFR. For our sample of IRAS/FOCA galaxies the relative contribution of the UV and FIR emissions to the total SFR are 0.3 and 0.7 respectively. However, these calculations assume that the FIR flux is exclusively due to the heating by young stars. Since all our galaxies are certainly not starbursting objects the contribution of the emission of dust heated by old evolved stars must be deduced from the FIR flux before translating it into star formation rate reducing the contribution of the FIR emission to the SFR. Let us assume that old stars contribute for 30 of the dust heating (Xu xu (1990), Buat & Xu buxu (1996)), then the ratio of the SFR deduced from the () emissions and the SFR deduced from the UV corrected emission is reduced from 1.4 to 1.1 and the relative contributions of the UV and FIR emissions to the total SFR are now 0.4 and 0.6.
Given all the uncertainties inherent to these calculations we must be cautious in our conclusions. We can say that the corrections for dust extinction deduced from the FIR/UV flux ratio and applied to the UV observed emissions lead to a SFR consistent with that obtained by adding the SFRs deduced from both the FIR and observed UV emissions. This makes us confident in our estimate of the extinction.
5.2 The local volume-average star formation rate
Under the hypothesis of an average star formation of the local universe continuous over years, we can derive global star formation rates from the local FIR and UV luminosity densities:
is calculated using the value of (section 4.1) multiplied by 1.5 to account for the total dust luminosity density (e.g. Xu & Buat xubu (1995), Meurer et al. meurheck (1999)); is calculated from . We find:
This time the contributions of the FIR and UV are very similar, this is due to
the lower value of the FIR to UV density ratio as compared to the FIR to UV
flux
ratio of individual galaxies. Then the volume-average star formation rate
deduced from the UV luminosity density not corrected for dust extinction must
be
multiplied by a factor to account for the global extinction, this
corresponds
to a mean extinction of 0.75 mag at 0.2 m. As discussed before this rather
low value is due to the contribution of faint blue galaxies to the UV
luminosity
density.
Actually, using the ratio gives an extinction of
0.77 mag using the model of Meurer et al. and 0.55 mag for our polynomial fit
(section 3.1)
As already underlined, the difference is likely to come from the contribution
of
the old stars to the dust heating: let us assume that 30 of the FIR
emission
comes from these old stars and is not related to the recent star formation
then
we find that of the star formation is locked in FIR and in
UV. The resulting UV extinction is 0.58 mag and .
Therefore we can conclude that the derivation of the global star formation rate is in agreement with our estimate of the global extinction in UV and that the same amount of star formation rate is traced by the global FIR and UV (not corrected for extinction) luminosity densities.
6 Comparison with FIR bright galaxies
Since the IRAS survey, FIR bright galaxies have been the subject of numerous studies because these objects experiment an intense star formation activity. The extreme case is that of UltraLuminous Infrared Galaxies (ULIGs) with a bolometric luminosity larger than essentially emitted in FIR and star formation rates of several hundreds solar masses per year: they generally are violent mergers and may represent an important phase in the formation of large galaxies like ellipticals (Mirabel & Sanders sandmir (1996)). Such objects are known to be rare at low z but they might be far more numerous at high z as suggested by the sub millimetric surveys with SCUBA (e.g. Sanders sanders (1999)).
With the launch of the ISO satellite, the sensitivity of the ISOCAM camera has allowed mid-infrared surveys at intermediate redshift (). In particular Flores et al. (flores (1998)) have observed one CFRS field, therefore UV (0.28m) and infrared data are available for these galaxies.
We now compare the FIR and UV properties of these galaxies (ULIG and ISOCAM/CFRS) to that of our IRAS/FOCA sample of nearby galaxies. The comparison is rather straightforward since all these objects are IR selected.
6.1 Ultraluminous Infrared Galaxies (ULIG)
6.1.1 nearby ULIGs
Trentham et al. (trentham (1999) ) have obtained HST observations for three ultra luminous infrared galaxies: VII Zw031, IRAS F12112+0305, IRAS F22491-1808. These galaxies are selected to be cool in order to avoid a non thermal origin for the FIR emission. We can calculate directly their ratio using the data at 0.23 m for the UV emission. The three objects are reported in figure 6 (similar to fig.2b) with empty stars for symbols. As expected for this type of objects they appear to be very luminous at 60 m with a high FIR to UV flux ratio. Such objects are not represented in our FIR selected sample of nearby galaxies: this emphasizes how much these objects are rare in the local Universe and with extreme properties as often underlined (e.g. Sanders & Mirabel sanders (1999)). Since the three ULIG have also been detected at 100 m we can estimate their UV extinction (we neglect the difference in the UV wavelengths i.e. 0.23 m versus 0.2 m). We find mag: more than 99 of the UV flux of these objects is emitted in the FIR.
6.1.2 High redshift galaxies detected by SCUBA : ULIG candidates
Hughes et al. (hughes (1998)) have observed the HDF field at 850 m with
SCUBA. 5 objects detected by SCUBA in the HDF field have been tentatively
associated to optical sources for which photometric redshift are available but
such an identification is difficult because of the uncertainty on the 850 m
positions. Indeed, the identification of the most brightest source (HDF850.1)
has not been confirmed (Sanders, sanders (1999)). Moreover the nature of these
sources, starbursts or AGN, is not clear: at FIR luminosity larger than about half of the nearby ULIGs are predominantly powered by
AGNs (e.g. Sanders sanders (1999)).
The 60 m luminosity of the 4 remaining galaxies is obtained from their emission at 850 m accounting for the redshifting and an assumed spectral energy distribution chosen to be that of M82. The optical data from the HDF lead to the estimate of the UV flux at a rest frame wavelength of 0.28 m. All these estimates rely on the resemblance of all ULIGs with M82 and can lead to false results (e.g. Sanders sanders (1999)) . In spite of these caveats, we have reported the 4 high redshift galaxies in figure 6 (filled triangles). They appear very extreme, being more luminous in FIR and probably more extincted that all the other galaxies studied in this paper. A tentative estimate of the extinction is obtained by using the instead of the one. We find values spanning from 8 to 11 mag. As a comparison M82, which belongs to our IRAS/FOCA sample exhibit ”only” 5.4 mag of extinction at 0.2 m. These high redshift ULIGs seem also to be much more extincted than the most luminous Lyman break galaxies of the HDF studied by Meurer et al. (meurheck (1999)) for which they derive an extinction not larger than 3.5 mag. Although their UV luminosity corrected for extinction are comparable (), these two classes of galaxies do not seem to exhibit the same properties in FIR and UV as suggested by Heckman (heckman (1999)). Indeed we can try to roughly locate the most luminous galaxies of Meurer et al. in figure 6. The FIR luminosity can be estimated from their star formation rates and the ratio from their extinction using the figure 1. It gives and for an extinction of mag. Therefore it seems that the Lyman Break Galaxies detected in the HDF by their U-dropout do not follow the steep trend of figure 6 found for FIR bright galaxies but instead exhibit a lower increase of the extinction with the intrinsic luminosity of the galaxies. Such a difference may be due to the contribution of AGNs in ULIGs. Indeed the extrapolation of the mean trend found in the IRAS/FOCA sample (figure 3) reported as a full line in the figure 6 does not lead to the extreme case of ULIGs and seems more compatible with LBGs.
6.2 ISOCAM/CFRS galaxies
Flores et al. (flores (1998) ) have obtained ISO/ISOCAM Mid Infrared images
of
one CFRS
field, most of the detections are at 15 m. The infrared 8-1000 m
luminosities have been deduced from MIR and/or radio measurements using
templates of spectral energy distributions and are probably not very secure but
an approximate value is sufficient for our comparison with local templates. We
differentiate AGNs and starbursts as classified by Flores et al.
Only the global IR (8-1000 m) flux is available for these objects and not
the flux at 60
m. We adopt a mean value of for the ratio of the total
dust emission to that intercepted by the 40-120 m band (see section 5.2).
Then we estimate the ratio between the flux at 60 m and the FIR
(40-120 m) for our IRAS/FOCA sample: .
Therefore the total IR fluxes given by Flores et al. have been divided by
a factor 2 in order to roughly represent the flux at 60 m.
The UV emission is taken at 0.28 m as given by Flores et al. It is
difficult to estimate a correction factor to translate the UV data to 0.2m
in the absence of observations of a large sample of galaxies at both
wavelengths since the ratio depends on the star formation history and the dust
extinction. We can try to use synthesis models for this estimate: assuming a
constant star formation rate over 1 Gyr and using the models of Leitherer et
al. (leitherer (1999)) for a solar metallicity we find the flux being defined as .The
difference of extinction between 0.28 and 0.2 m has been calculated using
the extinction curves of the Milky Way and the LMC (Pei pei (1992)) and that of
Calzetti (calzetti (1997)). The ratio . Therefore
the two effects (star formation and extinction) roughly compensate each other
and we do not perform any correction between 0.28 and 0.2 m.
The galaxies are plotted in figure 6 as crosses for the true starbursts
and empty circles for the Seyferts. They all fill the gap between the IRAS/FOCA
sample and the ULIGs. Therefore,
they are not as extreme as ULIGs but their extinction is larger than the nearby
galaxies of the IRAS/FOCA
sample. For the galaxies classified as starbursts, we have tentatively estimated
this extinction from
their FIR to UV flux ratio. The
extinctions found span from 2 to 5.5 with a
mean at 3.3 mag
(and a median at 3 mag). This is much larger than that estimated by Flores et
al. by matching the global star formation rates deduced from the total FIR and
the UV
luminosities in the observed field: they find extinctions around 2 mag at
0.28
m. This discrepancy between the extinction occurring in individual
galaxies
selected in infrared and that deduced from the total FIR and UV luminosity of a
selected field (i.e. the sum of the luminosity of all galaxies detected in the
wavelength band (FIR or UV)) is well illustrated in the table 5 of Flores et
al.
where the ratio calculated for individual objects
observed at
both 15 and 0.28 m is times larger than the ratio of the
global luminosities IR and UV luminosities in the CFRS field. This is in full
agreement with our own results presented in section 4.
7 Conclusions
We have constructed a sample of 102 nearby galaxies detected by IRAS at 60 m and for which UV observations at 0.2 m are available down to . Only five galaxies have no UV detection implying an extinction larger than 2-3 mag for these objects which are also very faint in FIR.
The FIR and UV properties of our sample have been compared to the mean properties of the local Universe deduced from the luminosity functions and densities at both wavelengths. As the galaxies become brighter in FIR their FIR to UV flux ratio, i.e. their extinction increases: which translates to an increase of mag for the dust extinction in UV per decade of FIR luminosity.
The ratio of the FIR to UV local luminosity
densities is much lower than that found in individual galaxies. It is also
true
for other samples of nearby galaxies usually considered as low redshift
templates like the IUE sample of Calzetti Kinney and collaborators. Such a
difference
is likely to be due to the large contribution of low UV luminosity galaxies to
the UV luminosity density: these galaxies are deficient in any survey. At FIR
wavelengths
such faint galaxies do not significantly contribute and our sample is
more representative of the galaxy population in terms of its contribution to
the FIR luminosity density.
As a consequence, much caution must be taken to correct large samples of
galaxies for extinction. In particular a uniform correction deduced from the
study of some individual cases cannot be valid.
Star formation rates can be estimated by accounting for both the FIR and UV
emissions: each one is translated to a quantitative SFR; then, the two SFRs
are summed.
The SFRs such deduced are consistent with those calculated from the UV
emission corrected for extinction.
A local volume-average star formation rate is calculated from the FIR and UV
luminosity density: . This is consistent with a global extinction of mag
at 0.2 m.
Endly, we have compared the FIR and UV properties of our sample of galaxies to those of nearby and high redshift UltraLuminous Infrared Galaxies observed both at UV and FIR rest frame wavelengths and to the ISOCAM survey of a CFRS field. All these objects extend toward the large luminosities the trend found for the nearby galaxies of a larger FIR to UV ratio for brighter galaxies. The ULIGs are very extreme with UV extinctions reaching 8-11 mag. Although more moderate the extinctions we find for the ISOCAM/CFRS objects not classified as Seyfert are comprised between 2 and 5.5 mag. These calculations are only tentative due to the large uncertainties about the FIR emission of these objects.
Acknowledgements.
We thank J.-M. Deharveng and M. Treyer for their careful reading of the manuscript and A. Boselli for helpful and stimulating discussions about this work as well as for his help in the study of individual objects.References
- (1) Buat V., Burgarella D., 1998, A&A 334, 772
- (2) Buat V., Burgarella D., Xu C., 1997, The Ultraviolet Universe at low and high redshift, eds. M. Fanelli & B. Waller, AIP conference proceedings 408, 379
- (3) Buat V., Xu C., 1996, A&A 306, 61
- (4) Calzetti D., 1997, The Ultraviolet Universe at low and high redshift, eds. M. Fanelli & B. Waller, AIP conference proceedings 408, 403
- (5) Calzetti D., Kinney A.L., Storchi-Bergman T., 1994, ApJ 429, 582
- (6) Cowie L.L., Songaila A., Barger A.J., 1999, astro-ph/9904345
- (7) Deharveng J.M., Sasseen T.P., Buat V., Bowyer S., Wu X., 1994, A&A 289, 71
- (8) Donas J., Milliard B., Laget M., 1991, A&A 252, 487
- (9) Fioc M., Rocca-Volmerange B., 1999, A&A 344, 393
- (10) Flores H., Hammer F., Thuan T., Césarsky C., Désert F.X., Omont A., Lilly S.J., Eales S., Crampton D., Le Fèvre O., 1998, ApJ 517, 148
- (11) Heckman T., 1999, astro-ph/9903041
- (12) Heckman T., Robert C., Leitherer C., Garnett D., van der Rydt F., 1998, ApJ 503, 646
- (13) Helou G., Khan I.R., Malek L., Boehmer L., 1988, ApJS, 68, 151
- (14) Hughes D.H., Serjeant S., Dunlop J. et al., 1998, Nature 394, 241
- (15) Kennicutt R.C., 1998, ApJ 498, 541
- (16) Kinney A.L., Bohlin R.C., Calzetti D., Panagia N., Wyse R., 1993, ApJS 86, 5
- (17) Kinney A.L., Calzetti D., Bica E., Storchi-Bergman T., 1994, ApJ 429, 17
- (18) Lehnert M.D., Heckman T.M., 1996, ApJ 472, 546
- (19) Leitherer C., Schaerer D., Goldader J.D. et al., 1999, ApJS in press
- (20) Lilly S., Le Fèfre O., Hammer F., Crampton D., 1996, ApJ 460, L1
- (21) Lonsdale C.J., Helou G., 1987, ApJ 314, 513
- (22) Madau P., Pozzetti L., Dickinson M., 1998, ApJ 498, 106
- (23) Meurer G.R., Heckman T.M., Calzetti D., 1999, ApJ 521, 64
- (24) Meurer G.R., Heckman T.M., Lehnert M.D., Leitherer C., Lowenthal J., 1997 AJ 114, 54
- (25) Meurer G.R., Heckman T.M., Leitherer C., Kinney A., Robert C., Garnett D.R., 1995, AJ 110, 2665
- (26) Milliard B., Donas J., Laget M., Huguenin D., 1994, The balloon-borne 40-cm UV-(200 nm) imaging telescope FOCA: results and perspective, 11th ESA Symposium, Montreux, ESA SP.
- (27) Pei Y.C., 1992, ApJ 395, 130
- (28) Pettini M., Kellogg M., Steidel C.C., Dickinson M., Adelberger K.L., Giavalisco M., 1998, ApJ 508, 539
- (29) Sanders D.B., 1999, astro-ph/9904292
- (30) Sanders D.B., Mirabel I.F., 1996, ARAA 34, 749
- (31) Saunders W., Rowan-Robinson M., Lawrence A. et al., 1990, MNRAS 242, 318
- (32) Steidel, C.C., Adelberger, K.L., Giavalisco, M., Dickinson, M., Pettini, M., 1999, ApJ 519, 1
- (33) Trentham N., Kormendy J., Sanders D., 1999, AJ 117, 2152
- (34) Treyer M.A., Ellis R.S., Milliard B., Donas J., Bridges T.J., 1998, MNRAS 300, 303
- (35) Wang B., 1991, ApJ 383, L37
- (36) Witt A. N., Gordon K. D. 1999 astro-ph/9907342
- (37) Xu C., 1990, ApJ 365, L47
- (38) Xu C., Buat V., 1995, A&A 293, L65
- (39) Yuan Q.R, Zhu Z.H., Yang Z.L., Hu X.T., 1996, A&AS 128, 299