X-ray observations and mass determinations in the cluster of galaxies Cl0024+17 ††thanks: Based on observations with the ROSAT and ASCA satellites and with the Canada-France-Hawaii Telescope at Mauna Kea, Hawaii, USA.
Abstract
We present a detailed analysis of the mass distribution in the rich and distant cluster of galaxies Cl0024+17. X-ray data come from both a deep ROSAT HRI image of the field Böhringer et al. (1999) and ASCA spectral data. Using a wide field CCD image of the cluster, we optically identify all the faint X-ray sources, whose counts are compatible with deep X-ray number counts. In addition we marginally detect the X-ray counter-part of the gravitational shear perturbation detected by Bonnet et al. Bonnet et al. (1994) at a 2.5 level. A careful spectral analysis of ASCA data is also presented. In particular, we extract a low resolution spectrum of the cluster free from the contamination by a nearby point source located 1.2 arcmin from the center. The X-ray temperature deduced from this analysis is keV at the 90% confidence level. The comparison between the mass derived from a standard X-ray analysis and from other methods such as the Virial Theorem or the gravitational lensing effect lead to a mass discrepancy of a factor 1.5 to 3. We discuss all the possible sources of uncertainties in each method of mass determination and give some indications on the way to reduce them. A complementary study of optical data is in progress and may solve the X-ray/optical discrepancy through a better understanding of the dynamics of the cluster.
Key Words.:
Galaxies: clusters: general – Galaxies: cluster: individual: Cl0024+17 – Cosmology: observations – dark matter – Gravitational lensing – X-rays: galaxies1 Introduction
Clusters of galaxies are the most massive gravitationally bound systems in the Universe. They are dynamically young as most of their time scales for evolution (virialization, cooling of the intra-cluster gas, dynamical friction, two-body relaxation, …) are not small with respect to the age of the Universe. One important cosmological issue is to understand the distribution and the physical properties of the different components inside clusters of galaxies. The study of each component can allow an estimate of the total mass and its distribution through 3 independent methods of mass determination. The first and oldest one is the Virial Theorem which relates the galaxy distribution to the total mass Zwicky (1933). It is a global mass estimator which is mainly uncertain due to departures from dynamical equilibrium such as substructure and infall Geller and Beers (1982); Merrit (1987); Merrit and Tremblay (1994). More recently, progress in X-ray astronomy has stressed the importance of the intra-cluster gas both as a major component of clusters Sarazin (1986) and as a good tracer of the mass under the assumptions of spherical symmetry of the distributions and thermal equilibrium of the X-ray emitting gas. Another very promising mass estimator is the mass deduced from gravitational lensing. Two regimes of lensing are to be considered in rich clusters. The first one is the strong lensing regime, where multiple images can be formed (see Fort & Mellier Fort and Mellier (1994) for a review). Lens modeling of these multiple images gives strong constraints on the mass, but only the central projected mass can be estimated that way Mellier et al. (1993); Kneib et al. (1996). For the weak lensing regime, the shear-to-mass inversion is still rather uncertain, although recent theoretical progress opens new perspectives on the quantitative estimate of the deflecting masses Seitz et al. (1998); Mellier (1999).
Cl0024+17 () is one of the few lensing clusters for which a combined analysis of its mass distribution is now possible. It was initially studied by Butcher and Oemler Butcher and Oemler (1978) and was pointed out for its high content of blue cluster members. It is a rich cluster, highly concentrated in the center but not dominated by a cD galaxy. On the contrary, there is a concentration of bright galaxies. Dressler et al. Dressler and Schneider (1985) obtained a reasonable number of redshifts of cluster members, from which they measured a rest-frame velocity dispersion of 1300 km s-1 Schneider et al. (1986). The spectacular system of giant arcs in the center of the cluster was initially mentioned by Koo Koo (1988) and observed spectroscopically by Mellier et al. Mellier et al. (1991) with no clear redshift determination. A tentative measurement of has recently been claimed by Broadhurst et al. Broadhurst et al. (1999) for this very blue multiple system. Deep HST images revealed that this arc system corresponds to the merging of three images, with the clear identification of an additional counter-image Kassiola et al. (1992); Smail et al. (1996); Colley et al. (1996). Several arclets are also present in the same region. In addition to the strong lensing effect detected in the core of the cluster, a significant weak shear signal was measured by Bonnet et al. Bonnet et al. (1994) up to 3 Mpc from the center. This was indeed the first distortion map measured on a massive cluster and the shear was detected up to a 10% level at the periphery. Finally, Cl0024+17 was detected by the Einstein Observatory with an X-ray luminosity of erg s-1 Henry et al. (1982).
In this paper, we analyze X-ray data obtained with both the ROSAT HRI and with ASCA. Section 2 presents the X-ray data, while in Section 3, the spatial analysis of the deep ROSAT HRI image gives quantitative measures for the different sources detected in the field, in particular for the cluster emission. Section 4 deals with the spectral analysis of the ASCA data and Section 5 proposes a detailed evaluation of the different mass determinations available for this cluster. In Section 6 we discuss the different sources of uncertainties in mass estimates, which may be related to the strong mass discrepancy identified in this cluster. Section 7 summarizes the main results of this paper.
Throughout the paper, we use a Hubble constant of H km s-1 Mpc-1, with and . At the cluster redshift (), 1″ corresponds to 6.36 kpc.
2 X-ray data
2.1 ROSAT HRI data
Cl0024+17 was observed by the ROSAT HRI between January 1994 and July 1996 for a total integration time of 116550 sec. More details about the data reduction of the image can be found in Böhringer et al. Böhringer et al. (1999). For our purpose the data were smoothed with a Gaussian filter ( or equivalently 14″ FWHM). This value is slightly higher than the resolution of the HRI but it is a good compromise with the low signal level of the image. The final detection level on the smoothed image corresponds to cts s-1arcsec-2 and the measured background level is cts s-1arcsec-2 in good agreement with most of the data from the HRI David et al. (1995). Figure 2 displays a wide part of the HRI image of the field. The cluster extended emission is clearly detected, although rather faint and not prominent in the image. Several sources are also detected and discussed below (see Section 3.2).
2.2 ASCA data
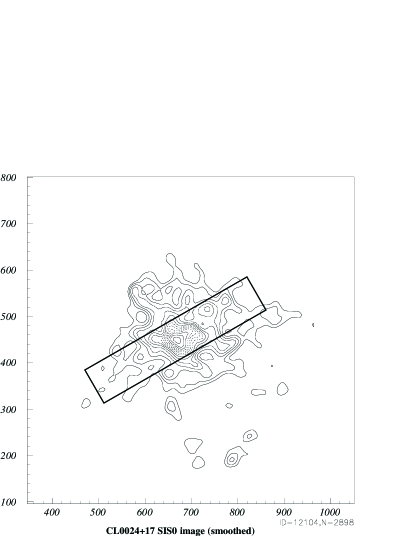
Cl0024+17 was observed with the ASCA GIS and SIS on July 21, 1996. X-ray emission centered at , is detected, with an error circle of 1 arcmin due to the uncertainty of absolute attitude determinations of ASCA. This is consistent with the cataloged position of Cl0024+17 Henry et al. (1982). There are several sources in the vicinity of the cluster in the SIS field (Figure 1). In this paper, we only use the SIS data because the nearby sources were not spatially resolved with the GIS. The total effective observation time after data filtering is 46 ksec for the SIS. The intrinsic cluster count rate is cts s-1 for the SIS within the cluster region defined in Section 4.1.
3 Spatial analysis of the X-ray emission
3.1 X-ray/optical centering
The coordinates of ROSAT in the center of the HRI image were given as and . The accuracy in the absolute pointing of the telescope is better than 10″ but still too large for a correct identification of the optical counter-parts of the X-ray sources. The optical centering was done with the help of a wide field mosaic of images taken at the ESO NTT in a 24′ 24′ field in total. Each frame is a 10 minute exposure, with a pixel size of . This kind of image is not very useful for a morphological analysis of the individual galaxies or for any weak shear measurement, but it can help with the optical identification of the X-ray sources. In the field, more than 20 stars selected from the Guide Star Catalog and not saturated on the CCD image were identified. The correspondence between their equatorial coordinates and their position on the CCD was obtained by a linear regression and the residuals were limited to typically. No rotation was necessary, as both images were correctly aligned along the North direction. The center of the X-ray image was then positioned with its own coordinates on the CCD image with a correct scaling. Another wide field image was used, taken with the UH8K camera at CFHT. It is a 20 minutes exposure in I, observed in very good seeing conditions ()and covering a field of view of 28′ 28′. Similar procedures for the astrometry were followed, using stars identified in the APM catalogue (http://www.ast.cam.ac.uk/~apmcat ), resulting in a non-linear astrometric solution for each CCD chip of the UH8K camera.
3.2 Identification of individual sources
| CR (s-1) | Flux [0.5–2 keV] | V | I | V–I | Comments | |||
|---|---|---|---|---|---|---|---|---|
| S1 | 00:26:31.3 | 17:10:16.2 | 20.56 | 18.84 | 1.72 | |||
| 19.56 | 18.08 | 1.48 | ||||||
| S2 | 00:26:26.4 | 17:09:38.1 | 20.01 | 19.42 | 0.59 | PC 0023+1653, | ||
| S3 | 00:26:46.2 | 17:12:31.6 | 20.31 | 19.36 | 0.95 | |||
| S4 | 00:26:46.1 | 17:13:05.2 | 21.59 | 20.65 | 0.94 | |||
| S5 | 00:26:18.1 | 17:09:46.3 | — | 17.88 | — | not separated in V | ||
| S6 | 00:27:04.1 | 17:07:20.6 | — | — | — | not separated in V, gap in I | ||
| S7 | 00:26:23.8 | 17:02:28.8 | 21.28 | 19.80 | 1.48 | |||
| S8 | 00:27:07.9 | 17:07:48.5 | 21.45 | 20.44 | 1.01 | |||
| S9 | 00:26:13.0 | 17:03:46.5 | 21.87 | 20.15 | 1.72 | |||
| S10 | 00:27:07.8 | 17:06:17.1 | 20.22 | 19.68 | 0.54 | |||
| S11 | 00:26:29.0 | 17:00:22.6 | 21.06 | 19.82 | 1.24 | |||
| S12 | 00:26:37.6 | 16:59:50.5 | 20.40 | 19.06 | 1.34 | 2E 0024.0+1643 | ||
| S13 | 00:26:36.5 | 16:59:22.0 | 20.94 | 19.28 | 1.66 | |||
| S14 | 00:26:30.1 | 16:56:52.9 | — | 19.75 | — | outside V field | ||
| S15 | 00:25:49.7 | 17:17:23.0 | 20.55 | 19.47 | 1.08 | 2E 0023.2+1700 | ||
| S16 | 00:27:32.7 | 17:06:53.5 | — | 18.42 | — | outside V field |
The first goal after the X-ray/optical centering was to search for a possible X-ray counter-part of the weak shear perturbation detected by Bonnet et al. Bonnet et al. (1994). This perturbation was claimed to be a massive structure which might be a cluster substructure or a chance superposition of a group of galaxies at a different redshift. In the X-ray image, a weak over-density is seen close to the location of the shear perturbation, with a maximum detected at a 5 level above the background. The total number counts is around photons above the background in the image, or a total count rate of s-1 above the background. It is a poor detection (extended low surface brigthness object) which requires deeper data to confirm whether it is real or not. In the case this X-ray emission is at the cluster redshift, we can roughly estimate its luminosity, using the conversion factor discussed in Section 4.2 and a temperature of 1 keV, giving a luminosity in the ROSAT band of erg s-1, typical of group emission. A similar result was found by Erben et al. Erben et al. (1999) in the cluster Abell 1942: a so-called “dark clump” inducing a significant perturbation of the shear field may have an X-ray counter-part with similar luminosity, if indeed this perturbation is at the same redshift as the cluster.
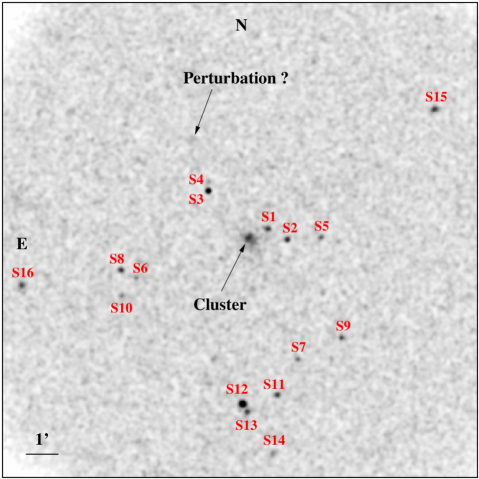
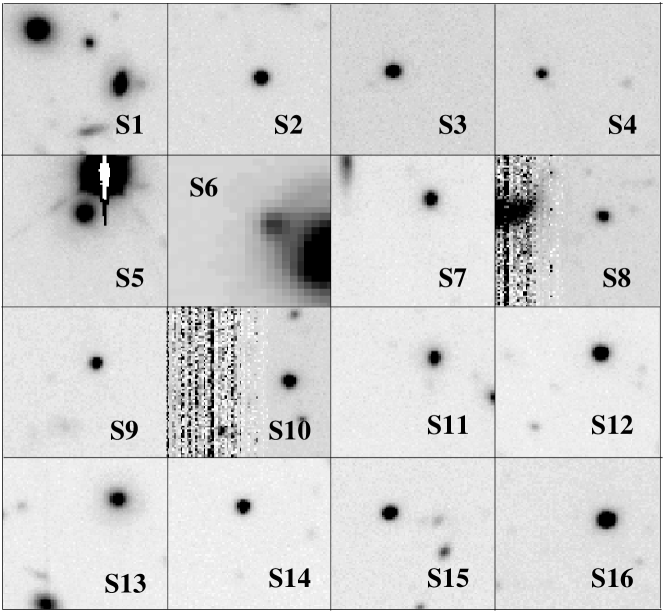
In addition, several other sources are detected in the field within a radius of 14′ around the cluster center (which corresponds to the unvignetted field of the HRI). We limited our sample to a total of 40 counts on the image, corresponding to a count rate of s-1 or a flux limit of erg s-1 cm-2 with the assumptions for the input spectra specified in the caption of Table 1. They are labeled S1 to S16 with increasing distance from the cluster center and their properties are summarized in Table 1. All these sources are compatible with point-like sources, although for the faintest ones this is less clear. For each source, we searched for an optical counter-part in a 8″ radius circle which corresponds to the typical ROSAT error box (Figure 3). The source S2 was immediately identified with the quasar J002626.2+170937 Véron-Cetty and Véron (1998), initially observed by Schmidt et al. Schmidt et al. (1986). This object is also labeled PC 0023+1653 and is at redshift . This is the most secure identification in this X-ray map, so we decided to make this source exactly coincident with its optical counter-part for a final X-ray/optical centering. Its luminosity, computed assuming a power-law index for its spectrum is erg s-1 in the [0.5-2] keV band, a typical value for such an object. For most of the sources, a relatively bright point-like object can be identified within the ROSAT error box (). In the case of S1, there is an uncertainty in the optical identification. From a spectroscopic program dedicated to a wide field redshift survey in the cluster Czoske et al. (2000) we have got the spectra of the two brightest objects located in the ROSAT error box. The most central one is a typical cluster member () while the second, more distant and brighter object, is a foreground star-forming galaxy at . None of the spectra present strong signs of nuclear emission, although the foreground object is an emission line galaxy, but with only weak forbidden lines. For S5 and S6 there is a point-source object close to a much brighter source (a star for S5 and a spiral galaxy for S6). We also mention S13 which is clearly an extended object at redshift showing an extended disc viewed face-on. Its spectrum shows absorption lines and no signs of nuclear activity. Unfortunately no spectra are available for the other objects and the spectroscopic identification remains to be done.
We also checked if any of these sources could be identified with previously know X-ray sources. Indeed, S12 and S15 correspond to sources detected with the HEAO-2 Einstein satellite McDowell (1994) although their positions differ by 10 to 20″. But this can be due to uncertainties in the distortion correction in the ROSAT image for these off-center sources or to uncertainties in the previous localization of these sources.
Finally, the number counts of X-ray sources (excluding the cluster) in our HRI image can be compared to the expected number, for a given flux limit. For erg s-1 cm-2, we find 16 sources within 600 sq. arcmin, and 12 sources with erg s-1 cm-2. These values are compatible with the counts observed in deep surveys Hasinger et al. (1998) with a slight excess not exceeding a level.
3.3 The cluster emission
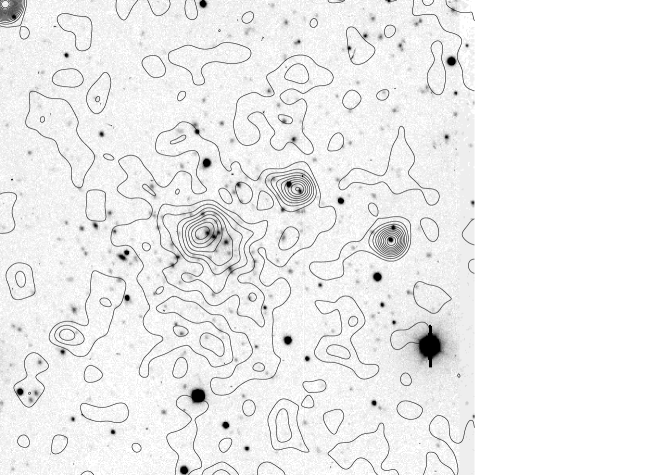
With the correct matching between X-ray map and optical CCD image, we first verified that the X-ray cluster center coincides roughly with the location of the central galaxies (Figure 4). In addition, the cluster X-ray emission clearly displays an elliptical shape, so we proceeded to an elliptical fit of the isophotes, with the ELLIPSE package in the IRAF/STSDAS environment. In order to avoid contamination by the individual sources, S1 and S2 were masked. Because of the small number of photons detected from the cluster contribution, a good elliptical fit was not possible far from the center and we let the ellipse parameters fixed at radius larger than 30″ with the values found at 30″. In the inner part there is a significant twist of the isophotes, with a change in the PA of nearly 90 degrees (Figure 5). The inner ellipticity is rather constant () while the outer one is fixed to , with in both cases. The main axis orientation is 40° clockwise from the North direction in the center and changes to 40° counter-clockwise in the outer part of the cluster. There is also a significant shift of the X-ray centroid, of about 12″ with respect to the centroid of the outer ellipses. This may be an indication of some physical processes occurring in the cluster center which deviates from a regular isothermal distribution of the gas. Anyway, the outer elliptical shape of the X-ray isophotes is quite similar to the isoluminosity distribution of the cluster galaxies Czoske et al. (2000), with an ellipticity of about 0.3 and a position angle of –45° from the North direction. The X-ray signal from the cluster contribution is detected up to 150″ from the center, which corresponds to a 1 Mpc radius at the cluster redshift.

The fit of the surface brightness profile was done in two ways. First, we used the radial intensity profile extracted from the elliptical fit and second, we extracted a profile inside circular annuli, which better corresponds to the use of the standard de-projection techniques. In both cases we fitted the profile with the “classical” -profile Cavaliere and Fusco-Femiano (1976); Jones and Forman (1984). Our results are quite consistent with those found by Böhringer et al. Böhringer et al. (1999) who use a more refined technique including de-convolution by the ROSAT HRI PSF, except in one point: in order to avoid the un-physical meaning of a low value, we limited the fit to larger than 0.5, and consequently found a larger value for the core radius . But in the rest of the paper, we will use their values of the X-ray profile which seem quite reliable, especially due to the correction for the instrumental PSF:
4 Spectral analysis
4.1 ASCA observations
Since the angular separation between the centre of Cl0024+17 and S1 is only 1.2 arcminutes, the contamination of the Cl0024+17 spectrum by the source S1 should be carefully treated. In order to obtain the intrinsic cluster spectrum, we performed 1-dimensional image fitting and separated the cluster and S1 spectra from each other. This fitting method was developed by Uno et al. Uno et al. (1999) and also presented in Mitsuda et al. Mitsuda et al. (1997). We summarize below the flow of the method and show the results. In this analysis, the SIS-0 and -1 are added together and the 0.5–8.5 keV energy band is used.
First we defined a rectangular region of 10′ length and 2′ width as shown in Figure 1, in which the cluster and S1 are located along the major axis of the rectangle. We set the position of the X-ray peak of the cluster in the SIS image at the origin of the axes. We then made a 1-dimensional intensity profile as a function of the position along the major axis by integrating the photons along the minor axis. In order to fit the observed projected profile, we constructed a model function consisting of three components: a cluster, point source, and background. For the cluster component, we generated a projected cluster surface brightness profile by convolving an image which has our best-fit -profile (as determined from the HRI image) with the PSF of the ASCA XRT and integrating along the minor axis in the same manner as above. Then for the point source, we derived a projected Point Spread Function by integrating the Point Spread Function also in the same way. We assumed the background flux to be constant along the major axis.

We fitted the observed 1-dimensional profile of seven energy bands with the model derived above. The width of each energy band was adjusted so that we can perform the image fitting with reasonable statistics. Thus we employed seven bands: 0.50–0.90, 0.90–1.14, 1.14–1.40, 1.40–1.78, 1.78–2.61, 2.61–4.00 and 4.00-8.49 keV. In Figure 6, we show an example of the 1-dimensional fit. The centroid of the projected -profile was fixed at the origin and the angular distance from the cluster to the point source was at the value expected from the ROSAT HRI image i.e. 1.2 arcmin. The best-fit normalizations give fluxes of Cl0024+17 and S1 in each energy bin.

Then combining these flux values in multiple energy bins, we obtained the spectrum of both Cl0024+17 and S1. We fitted the contamination-free cluster spectrum with a thin-thermal Raymond-Smith model (Figure 7). The neutral absorption was fixed at the galactic value; . We fixed the metal abundance at 0.3 solar. The chi-squared value is 3.3 for 5 degrees of freedom. The X-ray temperature is determined to be 5.7 keV with a 90% error range of 3.6 – 10.6 keV.
4.2 Total luminosity of the cluster
The cluster luminosity can easily be estimated from the total counts measured on the ROSAT HRI image. In this image, we estimate a count rate of cts s-1 (or a total number of 765 counts) for the cluster emission only. This value is evaluated directly from the cluster model issued from the fit, with no contribution from S1 or S2. It is probably underestimated as we had to stop the integration at a radius of about 900 kpc, when the signal could not be distinguished from noise. Assuming again a hydrogen column density of cm-2 for the cluster and a temperature of 5.7 keV for a Raymond-Smith plasma, we deduce a measured flux of erg s-1 cm-2 and a luminosity in the [0.1–2.4] keV ROSAT band of erg s-1. This value is quite similar to previous measurements in this cluster from Einstein data Henry et al. (1982) and consistent with the measurement given in Böhringer et al. Böhringer et al. (1999) but is clean from the contribution of the contaminants S1 and S2. Note however that the X-ray emission in Cl0024+17 is relatively weak when compared to other cluster lenses Fort and Mellier (1994); Allen (1998). It is also satisfying to note that this X-ray luminosity is not very different from the expected value computed from the relation Markevitch (1998). Indeed, Markevitch (1998) discusses the scatter in the relation and finds not more than 20–30 % in for a given . Thus for the value quoted here for Cl0024+17, we find a temperature range keV, compatible with the low side of the spectroscopically measured value.
From the results of the previous fit and calculations, we also find a central electron density of cm-3. The resulting cooling time is about yr, of the same order as the cluster age at the redshift of , in particular if we take into account a redshift of formation for the cluster ( yr). So no cooling flow signature is expected in the X-ray signal, whatever the past merging history of the cluster.
5 Mass analysis
5.1 X-ray mass determination
The mass determination issued from the X-ray analysis was done in a classical way, assuming that the -profile also holds for the gas density, and that the gas is in hydrostatic equilibrium. Cl0024+17 is a distant cluster, so no radial temperature distribution is available. We will then consider the case of an isothermal cluster, with keV. At large distance from the center, the effect of the core radius vanishes and the main uncertainty in the absolute numbers is essentially related to the temperature uncertainty, and then to the underestimation of the parameter. Under these assumptions, the total mass inside a radius writes as:
and the 2D-projected mass, integrated within a cylinder of radius writes as:
The integration inside a radius of 1 Mpc gives a total mass for the cluster
and a projected mass inside a cylinder of radius 1 Mpc
5.2 Cl0024+17 as a gravitational lens
Two mass estimates were proposed for Cl0024+17 from the lensing analysis. The first one comes from the HST observations of the giant arc system and its modeling Kassiola et al. (1992); Smail et al. (1996). The mass distribution (projected dark matter) in the center is very peaked with a small core radius ( kpc) and a small ellipticity. The projected mass inside the radius of the arc is
with kpc. An updated value of this mass can be found in Broadhurst et al. Broadhurst et al. (1999) with the measurement of the arc redshift ():
It compares with the X-ray mass deduced from our analysis:
The weak lensing mass was detected by Bonnet et al. Bonnet et al. (1994) in their pioneering work on the weak shear detection at large distance from the cluster center. Although their mass inversion was rather simple, they were able to constrain the surface mass density profile and to estimate the projected mass of the cluster inside a radius of 3 Mpc, considering the mass profile of a singular isothermal sphere:
Changing the profile from a de Vaucouleurs law to a power law (close to isothermal) induces a mass range from . Further analysis is in progress to better invert this mass profile, using the inversion procedures developed by Schneider & Seitz Schneider and Seitz (1995) and Seitz et al. Seitz and Schneider (1995); Seitz et al. (1998). Again we can compare with the extrapolated total mass deduced from the X-ray profile:
In both cases there is a discrepancy between the mass estimates, from a marginal value up to a factor 3. This result is similar to what has already been found in many clusters such as Abell 2218 and Abell 1689 Miralda-Escudé and Babul (1995); Squires et al. (1996) and is discussed below.
6 Resolving the mass discrepancy ?
The combination of the different mass estimates presented here in a homogeneous scaling and with error bars leads to a typical mass discrepancy of a factor 1 to 3. We may ask how to solve this apparent paradox, in particular by looking in more detail through each set of data and through the methods used to derive mass measurements. First, concerning X-ray data, it is now well known that HRI data are limited by the background level and that the extrapolation of the X-ray profile underestimates the -value or equivalently the logarithmic slope of the profile. This error on can lead to an underestimate of the total mass by a typical factor of 1.5 Bartelmann and Steinmetz (1996). This effect is particularly important in the case of Cl0024+17 which is a distant cluster. So, due to detection limits, the X-ray flux is not measured at a radius large enough with respect to the core radius, and the X-ray mass is significantly underestimated. The extrapolation of the X-ray profile well above the detection limit is also questionable and we cannot exclude a steeper profile at large distance. The uncertainty on the temperature measure is a large source of error if we strictly apply the statistics. But with a-priori information coming from the well-known relation, it may be difficult to increase this measure by a factor of two necessary to solve the discrepancy. The satisfying consistency between the measured values of the temperature and the X-ray luminosity, coming from independant X-ray data is important and gives confidence in the X-ray mass determination of the cluster.
The shear mass is questionable for several reasons: first the shear measurement could be improved. In particular, better procedures correcting instrumental defects such as PSF anisotropy, instrumental flexure or atmospheric refraction have recently been developed Kaiser and Squires (1995); Van Waerbeke et al. (1997); Mellier (1999) and mass reconstructions are becoming more reliable. Second, the mass measured inside a radius of Mpc is strongly dependent on the slope of the potential at large distance. We can estimate that an uncertainty of a factor 2 remains in the mass derived from weak lensing measurements, the preferred value of a singular isothermal profile being an upper limit. Since the pioneering work of Bonnet et al. Bonnet et al. (1994) Navarro, Frenk & White Navarro et al. (1996) have shown from N-body/hydrodynamical simulations that massive dark matter halos may follow a “universal” profile. This profile has not been applied to the cluster Cl0024+17 yet, and could decrease the total mass at large distance with respect to the isothermal distribution. But whatever the exact dark matter profile shape (NFW or De Vaucouleurs), the assumption of an isothermal distribution of the gas cannot be applicable anymore. In that case, the mass reconstruction from the X-ray profile must be refined. A possibility should be to include a -model with a polytropic index representative of the departure from isothermality Cavaliere and Fusco-Femiano (1978). With values of in the range , such a model can be consistent with a steep potential like the NFW one and may reduce the discrepancy between the mass estimates. In addition, the -profile is mainly used as a practical parametrization to fit the X-ray surface brightness with a simple analytical de-projection. The main danger is that we fit only part of the profile seen, and then extrapolate to larger radii to reach the weak shear measures of Bonnet et al. Bonnet et al. (1994). We can justify this by observing that for clusters at low redshift where the X-ray emission can be traced at larger radii, a relatively straight power law slope is generally observed. But this approach is still not free from systematic errors, as also commented above.
Another point to mention is the redshift distribution of the sources. Bonnet et al. Bonnet et al. (1994) simply assumed that all the sources were located in a single plane of background sources, with , depending on the potential. Changing the source distribution from to would lower the lensing mass estimate by about 40 %. Recently, Athreya et al. Athreya et al. (1999) tried to give a correct scaling of their mass reconstruction of the weak lensing map in the cluster MS1008–1224 by using photometric redshift estimates of the background sources. Using deep multi-color VLT data, they were able to introduce a realistic redshift distribution, even for the very faint sources for which we presently do not have spectroscopically measured redshift distributions. A detailed comparison between all the mass determinations in this cluster Carlberg et al. (1996); Lewis et al. (1999) gave a X-ray/lensing discrepancy of a factor 2 in the central region of the cluster, while in the outer parts and on a larger scale, the agreement is much better. The agreement with the dynamical M/L ratio was also found quite satisfying. Finally, one should note that the weak lensing analysis of Cl0024+17 was only done in one sector of the distant regions of the cluster. It then may be subject to inhomogeneities in the background distribution of the sources or in the mass fluctuations on the line of sight. In the case of MS1008–1224, this is clearly the case in one of the quadrants of the image Athreya et al. (1999)!
Last, we can also question the validity of the velocity dispersion measured by Schneider et al. Schneider et al. (1986) as it corresponds to 38 cluster members only. From a deep and wide field spectroscopic survey aimed at studying in detail the dynamics of the galaxies in this cluster, preliminary results show a bi-modal redshift distribution of the galaxies Czoske et al. (1999) with no clear spatial separation between the two modes. The main component of this distribution corresponds to a velocity dispersion of 900 km s-1 only, which decreases the virial mass by a factor of 2. This also reconciles the virial mass with the X-ray mass, and the cluster characteristics then match the correlation. In addition, this confirms the fact that Cl0024+17 has a complex dynamical structure, and that the X-ray gas may not be in a fully hydrostatic state. Departures from an hydrostatic equilibrium possibly traced by the elliptical shape of the X-ray emission or by the dynamics of the galaxies in the field of the cluster may fix some of the discrepancy in the different mass estimates. More details on the galaxy dynamics and the shape of the potential will be discussed in a forthcoming paper Czoske et al. (2000), as well as the effects of the projection of several mass components on the different mass estimators.
7 Conclusion
The detailed analysis of both spatial and spectral X-ray data presented in this paper leads to several results. First and as one of the initial goals of this work, we marginally detect a weak X-ray counter-part of the shear perturbation identified by Bonnet et al. Bonnet et al. (1994). This definitely needs to be confirmed by deeper X-ray data, waiting for the new generation of X-ray satellites (XMM and Chandra) for a better sensitivity. In addition our results are quite similar to what was found by Erben et al. Erben et al. (1999). We may be close to resolve the nature of the so-called “dark clumps” which begin to be detected in wide field shear maps around clusters. They may correspond to either small but massive groups in the vicinity of rich clusters of galaxies or distant clusters, too faint in the optical to be associated with the shear perturbations. In both cases, hot gas seems to be present, although in small quantities. Further studies and a better statistics on these “dark clumps” are required to better understand the cosmological consequences.
From our deep ROSAT HRI image, one of the deepest fields observed with this instrument, we were also able to derive number counts of X-ray sources at levels as faint as erg s-1 cm-2, quite compatible with number counts observed in other fields with the PSPC instrument. Only one optical identification is presently available and corresponds to QSO. We suggest that the main component of the faint X-ray sources are AGNs Zamorani et al. (1999).
Finally, concerning the cluster itself, we were able to carefully examine its 2D X-ray properties. A temperature measurement was produced, clear from the contaminating sources identified on the image. Although still rather uncertain, this temperature is quite compatible with the total X-ray luminosity of the cluster, giving good internal consistency of the X-ray data. On the contrary, an interesting mass discrepancy arises when one compares the mass deduced from the X-ray analysis with the lensing mass, either in the center of the cluster (strong lensing) or in the outer parts of the cluster (weak lensing). This apparent discrepancy is even stronger than in many other clusters where it has been pointed out Miralda-Escudé and Babul (1995); Squires et al. (1996). But it can be significantly reduced by a very careful analysis of the overall data. Future progress in the study of the mass distribution in clusters will be boosted soon due to the new generation of X-ray satellites, better understanding of the weak shear measurements in deep wide field images and the multi-object spectroscopic facilities available on 8 meter-class telescopes. Joining these efforts together will allow to learn much more on the dynamics and mass contents in clusters of galaxies.
Acknowledgements.
We wish to thank A. Blanchard, J. Bartlett and J.-P. Kneib for fruitful discussions. This work was supported by the Centre National de la Recherche Scientifique through the Programme National de Cosmologie and by a European TMR network programme: “Gravitational Lensing: New Constraints on Cosmology and the Distribution of Dark Matter” under contract No. ER-BFM-RX-CT97-0172 from the European Commission (http://www.ast.cam.ac.uk/IoA/lensnet/). O. Czoske thanks the EC for financial support under contract No. ER-BFM-BI-CT97-2471.References
- Allen (1998) Allen, S. W., 1998, MNRAS 296, 392
- Athreya et al. (1999) Athreya, R., Mellier, Y., Van Waerbeke, L., Fort, B., Pelló, R., and Dantel-Fort, M., 1999, A&A, submitted, astro-ph/9909518
- Bartelmann and Steinmetz (1996) Bartelmann, M. and Steinmetz, M., 1996, MNRAS 283, 431
- Böhringer et al. (1999) Böhringer, H., Soucail, G., Mellier, Y., Ikebe, Y., and Schuecker, P., 1999, A&A, in press, astro-ph/9910363
- Bonnet et al. (1994) Bonnet, H., Mellier, Y., and Fort, B., 1994, ApJ Lett. 427, 83
- Broadhurst et al. (1999) Broadhurst, T., Huang, X., Frye, B., and Ellis, R., 1999, ApJ, submitted, astro-ph/9902316
- Butcher and Oemler (1978) Butcher, H. and Oemler, A., 1978, ApJ 219, 18
- Carlberg et al. (1996) Carlberg, R. G., Yee, H. K. C., Ellingson, E., Abraham, R., Gravel, P., Morris, S., and Pritchet, C. J., 1996, ApJ 462, 32
- Cavaliere and Fusco-Femiano (1976) Cavaliere, A. and Fusco-Femiano, R., 1976, A&A 49, 137
- Cavaliere and Fusco-Femiano (1978) Cavaliere, A. and Fusco-Femiano, R., 1978, A&A 70, 677
- Colley et al. (1996) Colley, W. N., Tyson, J. A., and Turner, E. L., 1996, ApJ Lett. 461, 83
- Czoske et al. (2000) Czoske, O., Kneib, J.-P., Soucail, G., Bridges, T. J., Mellier, Y., and Cuillandre, J.-C., 2000, A&A, in preparation
- Czoske et al. (1999) Czoske, O., Soucail, G., Kneib, J.-P., Bridges, T., Cuillandre, J.-C., and Mellier, Y., 1999, in T. G. Brainerd and C. S. Kochanek (eds.), Gravitational Lensing: Recent Progress and Future Goals, Boston University, astro-ph/9909055
- David et al. (1995) David, L. P., Harnden, F. R. J., Kearns, K. E., and Zombeck, M. V., 1995, The ROSAT High Resolution Imager (HRI) Calibration Report, US ROSAT Science Data Center, SAO, Cambridge MA
- Dressler and Schneider (1985) Dressler, A. and Schneider, J. E. G. D. P., 1985, ApJ 294, 70
- Erben et al. (1999) Erben, T., Van Waerbeke, L., Mellier, Y., Schneider, P., Cuillandre, J.-C., Castander, F. J., and Dantel-Fort, M., 1999, A&A, in press, astro-ph/9907134
- Fort and Mellier (1994) Fort, B. and Mellier, Y., 1994, A&AR 5, 239
- Geller and Beers (1982) Geller, M. J. and Beers, T. C., 1982, PASP 94, 421
- Hasinger et al. (1998) Hasinger, G., Burg, R., Giacconi, R., Schmidt, M., Trumper, J., and Zamorani, G., 1998, A&A 329, 482
- Henry et al. (1982) Henry, J. P., Soltan, A., Briel, U., and Gunn, J. E., 1982, ApJ 262, 1
- Jones and Forman (1984) Jones, C. and Forman, W., 1984, ApJ 276, 38
- Kaiser and Squires (1995) Kaiser, N. and Squires, G., 1995, ApJ 404, 441
- Kassiola et al. (1992) Kassiola, A., Kovner, I., and Fort, B., 1992, ApJ 400, 41
- Kneib et al. (1996) Kneib, J.-P., Ellis, R. S., Smail, I., Couch, W. J., and Sharples, R. M., 1996, ApJ 471, 643
- Koo (1988) Koo, D. C., 1988, in V. G. Rubin and G. V. Cayne (eds.), Large-Scale Motions in the Universe, p. 513, (A89-42951 18-90). Princeton, NJ, Princeton University Press
- Lewis et al. (1999) Lewis, A. D., Ellingson, E., Morris, S. L., and Carlberg, R. G., 1999, ApJ 517, 587
- Markevitch (1998) Markevitch, M., 1998, ApJ 504, 27
- McDowell (1994) McDowell, J. C., 1994, The Einstein Observatory Soft X-ray Source List, SAO HEAD CD-ROM Series I (Einstein) Nos 18–36
- Mellier (1999) Mellier, Y., 1999, ARA&A, in press, astro-ph/9812172
- Mellier et al. (1993) Mellier, Y., Fort, B., and Kneib, J.-P., 1993, ApJ 407, 33
- Mellier et al. (1991) Mellier, Y., Fort, B., Soucail, G., Mathez, G., and Cailloux, M., 1991, ApJ 380, 334
- Merrit (1987) Merrit, D., 1987, ApJ 313, 121
- Merrit and Tremblay (1994) Merrit, D. and Tremblay, B., 1994, AJ 108, 514
- Miralda-Escudé and Babul (1995) Miralda-Escudé, J. and Babul, A., 1995, ApJ 449, 18
- Mitsuda et al. (1997) Mitsuda, K., Uno, S., Takahashi, T., Makino, F., Hirayama, M., Makishima, K., Kohmura, K., Ishisaski, Y., Itoh, M., and Lewin, W. H. G., 1997, in M. Matsuoka and N. Kawai (eds.), RIKEN, p. 239, Japan
- Navarro et al. (1996) Navarro, J. F., Frenk, C. S., and White, S. D. M., 1996, ApJ 462, 563
- Sarazin (1986) Sarazin, C. L., 1986, Rev. Mod. Phys. 58, 1
- Schmidt et al. (1986) Schmidt, M., Schneider, D. P., and Gunn, J. E., 1986, ApJ 306, 411
- Schneider et al. (1986) Schneider, D. P., Dressler, A., and Gunn, J. E., 1986, AJ 92, 523
- Schneider and Seitz (1995) Schneider, P. and Seitz, S., 1995, A&A 294, 411
- Seitz and Schneider (1995) Seitz, S. and Schneider, P., 1995, A&A 297, 287
- Seitz et al. (1998) Seitz, S., Schneider, P., and Bartelmann, M., 1998, A&A 337, 325
- Smail et al. (1996) Smail, I., Dressler, A., Kneib, J.-P., Ellis, R. S., Couch, W. J., Sharples, R., and Oemler, A., 1996, ApJ 469, 508
- Squires et al. (1996) Squires, G., Kaiser, N., Babul, A., Fahlman, G., Woods, D., Neumann, D. M., and Böhringer, H., 1996, ApJ 461, 572
- Uno et al. (1999) Uno, S., Mitsuda, K., Takahashi, T., Inoue, H., Makino, F., Makishima, K., Kohmura, Y., Ishisaski, Y., Itoh, M., and Lewin, W. H. G., 1999, ApJ, submitted
- Van Waerbeke et al. (1997) Van Waerbeke, L., Mellier, Y., Schneider, P., Fort, B., and Mathez, G., 1997, A&A 317, 303
- Véron-Cetty and Véron (1998) Véron-Cetty, M. P. and Véron, P., 1998, Quasars and Active Galactic Nuclei (8th Edition), ESO Scientific Report No. 18
- Zamorani et al. (1999) Zamorani, G., Mignoli, M., Hasinger, G., Burg, R., Giacconi, R., Schmidt, M., Trümper, J., Ciliegi, P., Gruppioni, C., and Marano, B., 1999, A&A 346, 731
- Zwicky (1933) Zwicky, F., 1933, Helv. Phys. Acta 6, 110