ROSAT HRI observations of radio-loud AGN
Abstract
We present the results of three ROSAT HRI observations of AGN expected to reside in clusters of galaxies. Although the exposures were truncated by the premature end of the ROSAT mission, valuable information could be achieved which greatly improved upon the previous PSPC results.
For RGB 1745+398 we could separate the cluster emission from that of the BL Lac and could confirm the cluster parameters obtained from optical follow-up observations. In MRC 0625-536 the flux from the central point source contributes less than 3% to the total X-ray flux and the eastern component of the dumbbell galaxy seems to be the X-ray emitter. RXJ1234.6+2350 appears to be extended in X-rays. The X-ray flux is centered on a quasar, but optical spectroscopy indicates that the nearby radio galaxies reside in a previously unknown cluster at redshift z0.134.
Key Words.:
Galaxies: active – Galaxies: fundamental parameters – Galaxies: ISM – Galaxies: nuclei – X-rays: galaxiesmgliozzi@xray.mpe.mpg.de
1 Introduction
Compared to most previous X-ray missions the ROSAT satellite provided a substantial increase in sensitivity and spatial resolution, together with the moderate spectral resolution of the PSPC detector (Pfeffermann et al. 1986). For even higher spatial resolution, the ROSAT High Resolution Imager (HRI, David et al. 1998) provided a spatial resolution of about 5″ in the 0.1-2.4 keV band, although knowledge of the spectral response is sacrificed.
In this paper we present the analysis of HRI observations of three radio-loud AGN which are expected to reside in the center of clusters of galaxies. The PSPC’s spatial resolution turned out to be insufficient to resolve the AGN contribution from the cluster emission. The objects were proposed for the sixth cycle of ROSAT observations. In all three cases, the envisaged observation time had not been completed when the satellite mission ended unexpectedly. The accumulated limited signal-to-noise ratio of the data is not sufficient to fully achieve the expected scientific goals but it allows insights into the physical conditions of the systems going beyond those obtained from the PSPC data.
In this paper we will discuss the ROSAT HRI data of three different objects: Sect. 1 deals with the BL Lacertae object RGB 1745+398 located near the center of a bright galaxy cluster. In Sect. 2 we discuss the radio source MRC 0625-536 at the center of the Abell cluster A3391 and, finally in Sect. 3, the region around the X-ray source RX J1234.6+2350 where we find three point like radio objects spatially coincident with the ROSAT source.
Spatial scales and luminosities are calculated assuming , and . Therefore 1 arcmin approximately corresponds to 307 kpc for RGB 1745+398, to 86 kpc for MRC 0625-536, and to 187 kpc for RX J1234.6+2350.
2 RGB 1745+398
RGB 1745+398 was identified as a BL Lac object (Laurent-Muehleisen et al. 1998) in optical follow up observations of a correlation between the ROSAT All Sky Survey (RASS) and the Green Bank 5 GHz radio survey (Brinkmann et al. 1995). The discovery of a blue arclike structure 8″ southeast of the BL Lac indicates the presence of a cluster of galaxies (Nilsson et al. 1999).
BL Lacs in clusters as gravitational lenses are relatively rare. Because of their strong variability they are excellent candidates for measuring via gravitational time delay. Interestingly, if all current lens candidates were confirmed, the incidence of lensing would be much higher than in comparable, low z, surveys of quasars (Scarpa et al. 1999).
The location of this nearby BL Lac object (z = 0.267) in the center of a cluster suggests that some portion of the X-ray emission may be coming from the intra-cluster gas. One of the aims of this work is to check this hypothesis and, eventually, to derive the gas and the total mass of the cluster from the X-ray data, independent of the optical results.
RGB 1745+398 was observed with the ROSAT HRI between March 4 and 7, 1998 with an effective exposure of 42.6 ksec. Only photons in the pulse height channels 2 to 8 are used in the spatial analysis in order to increase the signal to noise ratio, as channels 9 to 15 mostly contain instrumental background.
A contour plot of the total X-ray emission overlaid on the optical image is shown in Fig. 1. The photons were binned in two arcsec pixels and subsequently smoothed with a Gaussian with = 6 arcsec.
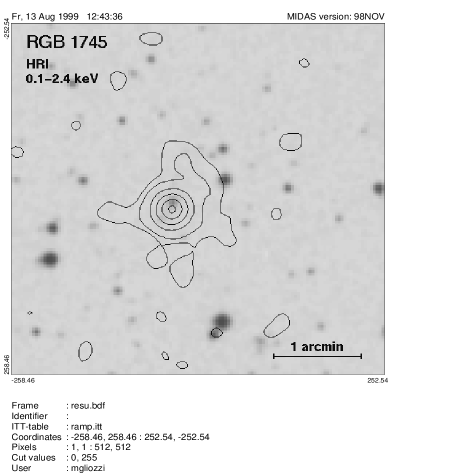
The X-ray emission appears to be extended and centered near to the arc-like optical structure (Nilsson et al. 1999). The angular separation of about 4″ from the position of the BL Lac is within the intrinsic resolution of the HRI of 5″(Harris et al. 1998). To determine the physical properties of the extended X-ray emission we fitted a -model (e.g. Cavaliere & Fusco-Femiano 1976, Gorenstein et al. 1978) of the form
| (1) |
to the surface brightness profile of the HRI source; the result is shown in Fig. 2.

The best fit values () for the -model are , , . It must be noted that although the value of is somewhat low with respect to the typical value for clusters (), the core radius is consistent with that obtained from the optical data (Nilsson et al. 1999). To account for the BL Lac emission we included a Point-Spread-Function (PSF) model in the fit and convolved the original PSF model with an additional Gaussian to allow for the known smearing of the PSF by residual wobble motion, which varies between different observations (Morse 1994). The normalization turns out to be , and the additional wobble is 1.5 arcsec. By integrating the two profiles we derive that the BL Lac object and the extended region give nearly the same contribution to the total X-ray emission, with a slight excess from RGB 1745+398 (52% vs. 48%). Given that the HRI lacks spectral response, we calculated the 0.1-2.4 keV flux for the extended emission assuming Galactic absorption and a thermal Bremsstrahlung spectrum with ranging between 1 keV and 10 keV. For the point source we assume a power law spectrum with a photon index ranging between 1.5 and 2.5. With these assumptions the flux ranges of the extended and point-like source are and , respectively.
The corresponding luminosities are shown in Fig.3. It can be seen that, even for the generally steep power law spectra found in the ROSAT band for BL Lacs (2.2; Brinkmann et al. 1996), RGB 1745+398 has a rather low X-ray luminosity and, according to its radio - to - X-ray index , it belongs more to the class of Low energy peaked BL Lacs (Giommi & Padovani 1994).

The physical parameters of the cluster, the central density, the gas mass, and the total mass can be obtained by de-projecting the surface brightness profile. With this method one can derive the corresponding density profile:
| (2) |
where the central density is given by (e.g. Henry et al. 1993):
| (3) | |||||
is the central intensity converted to , the core radius in cm and is given in keV. and are the complete and incomplete Gamma functions respectively. and denote the observed energy range, i.e. 0.1 keV and 2.4 keV in case of the ROSAT HRI observations. For the conversion from to we assumed a thermal bremsstrahlung spectrum with keV and Galactic absorption. Using the best-fit parameters from the -model, we obtain . The total gas mass within a given radius can be calculated by integrating Eq. (2). Assuming a radius of 8 arcsec ( 41 kpc), corresponding to the Einstein radius of the cluster (Nilsson et al. 1999), the total gas mass ranges from ( keV) to ( keV).
Assuming hydrostatic equilibrium for the intra-cluster medium of RGB 1745+398 and spherical symmetry, we use the temperature and gas density profiles to derive the total gravitating mass as a function of the radius:
| (4) |
As discussed by Neumann & Böringer (1995), deviations from the hydrostatic equilibrium as well as moderate ellipticities do not have strong effects on the mass determination. With the additional assumption of an isothermal intra-cluster medium Eq. (4) reduces to
| (5) |
For the total gravitating mass within 41 kpc, we get for the cases kT=1 keV or 10 keV, respectively. These values are consistent with those derived from the optical data (). As a consequence the gas mass fraction at this radius ranges between 0.1% and 2.1 % of the total cluster mass.
The low total mass indicates that we see a poor cluster or a group of galaxies and the obtained soft X-ray luminosity as well as the low gas mass fraction are consistent with this picture (Reiprich & Böehringer 1999). These results are in accordance with the claim that BL Lac objects are frequently found in groups of galaxies or in relatively poor clusters with richness class 0 (Wurtz et al. 1996).
3 MRC 0625-536
Previous ASCA/ROSAT observations of the nearby (z= 0.0539) radio galaxy MRC 0625-536 (Otani et al. 1998) revealed that the X-ray emission from the system is largely dominated by the surrounding cluster Abell 3391, with only a small contribution () due to the galaxy. With the superior spatial resolution of the HRI, we tried to constrain the real X-ray luminosity fraction attributable to the dumbbell galaxy ESO 161-IG 007, the optical counterpart of the radio source, and to compare the X-ray brightness distribution to the optical and radio images to see which of the two galaxy components is active.
MRC 0625-536 was observed with the ROSAT HRI during the period 15-25 March 1998. The total exposure was 15.2 ksec. Again, only photons in the pulse height channels 2 to 8 were used in order to increase the signal to noise ratio.
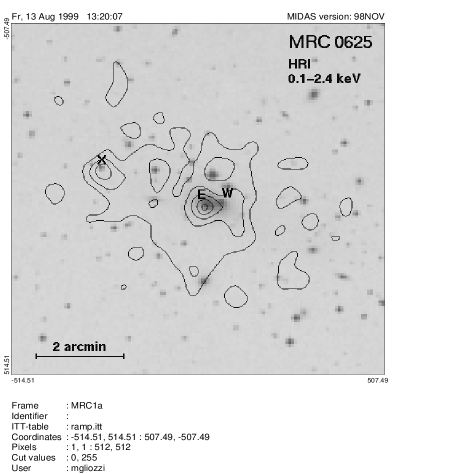
A contour plot of the X-ray emission overlaid on the optical image is shown in Fig. 4. The photons were binned in four arcsec pixels and subsequently smoothed with a Gaussian with = 12 arcsec. ¿From the figure it can be seen that the X-ray emission is clearly concentrated on the eastern galaxy, with a more extended structure near the western galaxy, and there seem to be other point-like sources inside the cluster region. In particular, there is a relatively strong X-ray source at RA(2000)=, DEC(2000)=, detected with the maximum likelihood technique, located arcmin north-east from the dumbbell galaxy, whose X-ray flux is comparable to that of MRC 0625-536. This object is classified as ’Stellar’ with a magnitude of in the COSMOS digitized optical survey of the southern sky, operated by the ROE/NRL. A search for a known object at this position in the NASA/IPAC Extragalactic Data Base (NED) and in SIMBAD gives negative results.
To check the consistency of the HRI data with previous ASCA/ROSAT results, we fitted the surface brightness profile with the -model described above. The fit results () are in perfect agreement with those obtained by Otani et al. (1998, ). In order to determine the X-ray fluxes and luminosities associated with both the point-like and the extended sources we used the best fit results obtained in the joint ROSAT and ASCA spectral analysis. In particular, we took and a thermal model with keV for the extended emission, while a power law model with photon index was assumed for the dumbbell galaxy. In a circular region with radius of 6 arcmin, the 0.1-2.4 keV flux associated with the extended region is , while for the dumbbell galaxy we obtain . The corresponding luminosities are and . Therefore, the contribution from MRC 0625-536 to the total X-ray emission from the system is only about 3%.
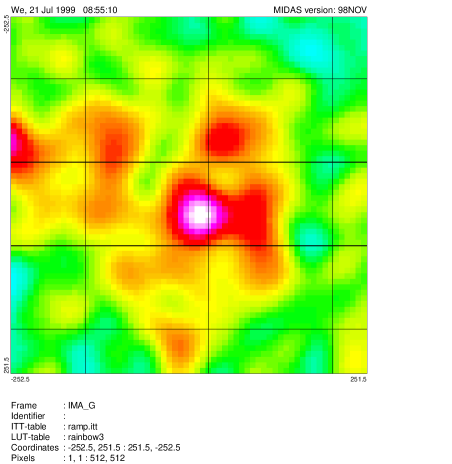

In Fig. 5 we show an overlay of the ATCA 13 cm (2.3 GHz) radio contour map on a grey scale image of the central arcmin of the X-ray emission. The radio emission clearly originates from the eastern galaxy, where the X-ray brightness shows a peak as well. Both jets are deflected, in particular the northern jet seems to be bent by a region of enhanced X-ray emission. However, the limited signal to noise ratio of the HRI data does not allow to improve previous conclusions on the large scale structures and the complex interaction of the radio jet with the surrounding cluster gas, obtained from the PSPC observations (Otani et al. 1998).
4 RX J1234.6+2350
| Source | RA(2000.0) | DEC | (1.4 GHz) | (0.1-2.4 keV) | B magnitude |
|---|---|---|---|---|---|
| h m s | o ’ ” | mJy | |||
| RX J1234.6+2350 | 12 34 39.1 | 23 50 05.0 | 17.2 | ||
| FIRST J123438.6+235013 | 12 34 38.63 | 23 50 13.0 | 4.54 | 19.3 | |
| FIRST J123437.1+235016 | 12 34 37.13 | 23 50 16.1 | 3.48 | 19.1 | |
| FIRST J123438.2+234947 | 12 34 38.27 | 23 49 47.6 | 8.22 | 19.1 |
This object was first seen in the correlation between the ROSAT All-Sky Survey (RASS) and the Green Bank 5 GHz survey (Brinkmann et al. 1997) and optically identified by Bade et al. (1998) as a quasar although no redshift is given. In the FIRST 1.4 GHz VLA Survey (Faint Images of the Radio Sky at Twenty centimeters; Becker et al. 1995) three radio sources, each with its own optical counterpart, were found within the RASS position error circle of RX J1234.6+2350 (Brinkmann et al. 1999). This constellation, an X-ray source surrounded by several faint radio sources, occurs relatively often in the correlation of the FIRST and RASS catalogs. It appears possible that in these cases the X-ray emission originates from a distant cluster of galaxies while the sensitive radio observations trace individual galaxies in the cluster.
RX J1234.6+2350 was observed with the ROSAT HRI between June 30 and July 1, 1998 when the satellite was in a very unstable status. Due to the short effective exposure (4.7 ksec) the data are only of limited quality. An attempt to fit the X-ray emission with the -model failed, probably because of the low photon statistics. Nevertheless the X-ray contours (obtained after binning the photons in two arcsec pixels and subsequent smoothing with a Gaussian with = 6 arcsec) overlaid on the optical image (Fig. 6) show some interesting features.
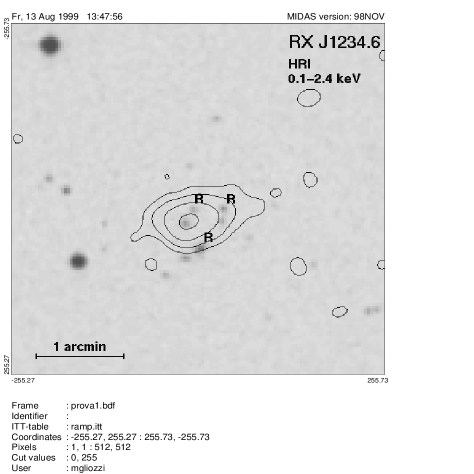
The region surrounding the X-ray source is crowded with the quasar RX J1234.6+2350 and three, optically resolved, radio galaxies, whose coordinates and fluxes are given in Table 1.
We obtained new low dispersion optical spectra on June 7, 1997, of the three radio sources in the field at the Kitt Peak National Observatory’s 2.1-m telescope using the GoldCam spectrograph. Spectra were taken through a 1.5 slit, resulting in a resolution of 4 Å. Reduction proceeded in the standard manner using the IRAF (V2.11) analysis package. Wavelength calibration was carried out using comparison lamps generally taken at the beginning of the night. The spectra had to be smoothed to determine (by cross-correlation with a galaxy template) a redshift, which is estimated to be accurate to 0.002. Fig. 7 shows the spectra of the three radio sources given in Table 1.

Although the spectra are of relatively low signal to noise ratio, the redshifts of FIRST 1234.2+234947 and FIRST 123437.1+235016 are well determined and consistent with being the same, given our errors. We also believe that the redshift of FIRST 123438.6+235013 is consistent with belonging to this cluster, but a better spectrum is required to confirm this.
The X-ray emission is extended and the radial intensity distribution is not consistent with the HRI’s point spread function. However, the satellite’s attitude solution during these late phase HRI observations was not free of problems and there is no other strong source in the field of view to check the effective point spread function. In the ROSAT All Sky Survey the source appears extended as well with a size of 1′ and a peculiar morphology which could indicate the presence of multiple, unresolved sources. But the limited photon statistics and the PSPC’s spatial resolution do not allow us to make any definite conclusions.
The X-ray flux in the ROSAT energy band (0.1-2.4 keV), calculated from a circular region with radius arcmin centered on RX J1234.6+2350, assuming a power law spectrum with photon index =2.0 and Galactic absorption towards the source of =1.29 (Dickey & Lockman 1990), is . Assuming that the extended X-ray emission originates from a cluster and that the latter is at the redshift of the radio galaxies (z), the X-ray luminosity deduced from the HRI data is .
The X-ray flux obtained from the HRI observation is nearly a factor four lower than the flux obtained from the RASS count rate ( counts/s, corresponding to a flux of ). This implies that either the source is strongly variable or that the spectral shape is completely different, leading to greatly differing count rates in the two detectors. However, the survey data are consistent with a power law with slope (Brinkmann et al. 1997).
The HRI X-ray contours are centered on the quasar RX J1234.6+2350 which might be the dominant contributor to the X-ray flux. Its optical identification and B magnitude were obtained from the Hamburg/RASS Catalogue (Bade et al. 1998). Taking the optical flux at 2500Å and assuming an upper limit mJy to the 1.4 GHz flux density at the quasar position, which is converted to a 5 GHz flux density by assuming a power law spectrum with , we obtain for the radio-loudness of the quasar an upper limit of , which means that RX J1234.6+2350 is a radio-quiet quasar.
5 Conclusions
Previous PSPC observations indicated that the objects observed with the HRI are AGN residing in clusters of galaxies. As the spatial resolution of the PSPC was insufficient to separate the cluster emission from that of the AGN we conducted ROSAT HRI observations to study the spatial distribution of the X-ray emission in more detail.
In two of the three cases we can determine the fractional flux contribution of the AGN to the X-ray flux although the HRI exposures were truncated by the premature end of the ROSAT mission. For RGB 1745+398 we could separate the cluster emission from that of the BL Lac and could confirm the cluster parameters obtained from the optical follow-up observations. The BL Lac object contributes about 48% to the total soft X-ray emission. In MRC 0625-536 the flux from the central point source amounts to less than 3% of the total X-ray flux and it appears that the eastern component of the dumbbell galaxy ESO 161-IG 007 is the X-ray emitter.
RXJ1234.6+2350 seems to be extended with the X-ray flux centered on a quasar. The optical spectra indicate that the three nearby radio galaxies are members of a previously unknown cluster, but no further data are available from this unusual system. The limited quality of the X-ray data does not allow a decomposition of the quasar flux from the extended emission component. The changes of the X-ray flux between the ROSAT survey and the pointed observation strongly favor the quasar as the main contributor to the X-ray emission although for radio-quiet quasars flux changes by a factor of four are rare (Yuan et al. 1998).
X-ray observations with high spatial resolution are a powerful method to study these interesting kind of systems, AGN in the centers of clusters, which show indications for a direct interaction of the AGN activity with the surrounding matter.
Acknowledgements.
The ROSAT project is supported by the Bundesministerium für Bildung, Wissenschaft, Forschung und Technologie (BMBF) and the Max-Planck-Gesellschaft. We thank our colleagues from the ROSAT group for their support. We wish to thank Robert Becker for taking the Kitt Peak spectra of the radio sources in the RX J1234.6+2350 field. MG acknowledges partial support from the European Commission under contract number ERBFMRX-CT98-0195 (TMR network “Accretion onto black holes, compact stars and protostars”). SALM acknowledges partial support from the U.S. Department of Energy at the Lawrence Livermore National Laboratory under contract W-7405-ENG-48i and from the NSF (grant AST-98-02791). This research has made use of the NASA/IPAC Extragalactic Data Base (NED) which is operated by the Jet Propulsion Laboratory, California Institute of Technology, under contract with the National Aeronautics and Space Administration.References
- (1) Bade N., Engels D., Voges W., et al., 1998 A&AS 127, 145
- (2) Becker R.H., White R.L., Helfand D.J., 1995, ApJ 450, 559
- (3) Brinkmann W., Siebert J., Reich W., et al., 1995, A&AS 109, 147
- (4) Brinkmann W., Siebert J., Kollgaard R.I., Thomas H.-C., 1996, A&A 313, 356
- (5) Brinkmann W., Siebert J., Feigelson E.D., et al., 1997, A&A 323, 739
- (6) Brinkmann W., Laurent-Muehleisen S.A., Voges W., et al, 1999, submitted to A&A
- (7) Cavaliere A., Fusco-Femiano R., 1976, A&A 49, 137
- (8) David L.P., Harnden F.R., Kearns K.E., et al., 1998, The ROSAT HRI, Techn. Report (US ROSAT Science Data Center/SAO)
- (9) Dickey J.M., Lockman F.J., 1990, ARA&A 28, 215
- (10) Giommi P., Padovani P., 1994, MNRAS 268, L51
- (11) Gorenstein P., Fabrikant D., Topka K., Harnden F.R., Tucker W.H., 1978, ApJ 224, 718
- (12) Harris D.E., Silverman J.D., Hasinger G., Lehmann I., 1998, A&AS 133, 431
- (13) Henry J.P., Briel U.G., Nulsen P.E.J., 1993, A&A 271, 413
- (14) Laurent-Muehleisen S.A., Kollgaard R.I., Ciardullo R., et al., 1998, ApJS 118, 127
- (15) Morse J.A., 1994, PASP 106, 675
- (16) Neumann D.M., Böringer H., 1995, A&A 301, 865
- (17) Nilsson K., Takalo L.O., Pursimo T., et al., 1999, A&A 343, 81
- (18) Otani C., Brinkmann W., Böhringer H., Reid A., Siebert J., 1998, A&A 339, 693
- (19) Pfeffermann E., Briel U.G., Hippmann H., et al., 1986, Proceedings SPIE 733, 519
- (20) Reiprich T.H., Böhringer H., 1999, Proceedings of the Ringberg Workshop on Diffuse Thermal and Relativistic Plasma in Galaxy Clusters, in press (astro-ph/9909071)
- (21) Scarpa R., Urry C.M., Falomo R., et al., 1999, ApJ 521, 134
- (22) Wurtz R., Stocke J.T., Yee H.K.C., 1996, ApJS 103, 109
- (23) Yuan W., Brinkmann W., Siebert J., Voges W., 1998, A&A 330, 108