Abstract
We present the results of the extragalactic surveys performed at 15 and 175 m using the ISOCAM and ISOPHOT instruments on-board the Infrared Space Observatory (ISO). The number counts at both wavelengths present a strong evolution. The preliminary study of the individual galaxies responsible for this evolution suggest that more star formation was hidden by dust at redshifts around and imply that the population of luminous IR galaxies detected by IRAS in the local universe must have played a major role in the formation and evolution of galaxies and cannot be considered anymore as extreme and rare cases.
Mid and Far Infrared Surveys with ISO
1 CEA Saclay/DSM/DAPNIA/Service d’Astrophysique, Orme des Merisiers, F-91191 Gif-sur-Yvette Cedex, France 2 University of California, Santa Cruz (UCSC),Physics Department, Santa Cruz, CA 95064, USA
1 Introduction
Several critical observational advances have taken place in the past few years to elucidate the formation and evolution of galaxies and the rates at which stars formed at different cosmological epochs. With the advent of magnitude limited samples of spectroscopic redshifts, it became possible to discuss general properties of galaxies through their comoving luminosity density or star formation rate (SFR) as a function of redshift (Lilly et al 1996, Madau et al 1996). Since then, we became familiar with the study of a new astronomical character, the ’’ box of the universe. At the same time, the plot of the cosmic background was enriched by COBE (Puget et al 1996, Fixsen et al 1998, Lagache et al 1999, Hauser et al 1999, Dwek et al 1998) and the HST (Pozzetti et al 1998), on the far infrared to sub-millimeter part and on the optical-UV part respectively. These two global views of the past history of galaxy formation and evolution gave a new life to the debate that begun with the discovery by IRAS of Luminous InfraRed Galaxies (LIRGs, see the review by Sanders & Mirabel 1996). Galaxies brighter than radiate most of their light in the infrared (IR) range and exhibit the strongest star formation rates ever measured. No other observations, else than direct infrared observations, had prepared such a discovery. However, the infrared radiation of nearby galaxies () makes only of their optical light and only of it comes from LIRGs (based on IRAS results, Soifer & Neugebauer 1991), which consequently weight only by comparison with the optical light from ’normal’ galaxies. Prior to the COBE, SCUBA and ISO results, hence only three years ago, the matter of debate could have been summarized by the following question: should we consider LIRGs, as anything else than extreme cases, non representative of the general behavior of galaxies ?
When the previously quoted authors, after Puget et al (1996), found from the COBE FIRAS and afterwards DIRBE measurements, that the energetic content of the IR to sub-mm cosmic background was as high as that of the UV to near-IR background, the debate became more intense but still left opened the possibility to keep a scenario consistent with the one deduced from the ’’ box of the universe story, i.e. that one could reproduce both the CIRB and the variation of the comoving UV luminosity density and SFR with redshift without the recourse of LIRGs (see Fall, Charlot & Pei 1996).
Several observations have now ruled out this picture. The redshift dependance of the comoving star formation rate of the universe needs not only the UV luminosity density to be known as a function of redshift but also the IR luminosity density, which is dominated by LIRGs at and above (see below). The most directs of these observations, because they measure the IR light radiated by dust, come from three instruments: ISOCAM (Cesarsky et al 1996), in the mid-IR, and ISOPHOT (Lemke et al 1996), in the far-IR, on board ISO (Kessler et al 1996), and the SCUBA bolometer array at JCMT, in the sub-mm (see Lilly et al, in these proceedings). All three instruments present number counts much above expectations from no evolution models based on IRAS results on the local universe, indicating that the bulk of the cosmic IR background (CIRB) originates from LIRGs, or even brighter galaxies. Hence, answering NO to the previous question. So that we can say that we are leaving in the middle of an “Infrared Revolution”. The following discussion will illustrate the role that the ISOCAM and ISOPHOT extragalactic results are playing in it, being complementary to and consistent with the SCUBA results.
2 Description of the Surveys and Number Counts
ISOCAM is a mid-IR camera which allows to perform either wide band imagery or low resolution spectroscopy using Circular Variable Filters, in the range 5-18 m. The two wide band filters that were used for the extragalactic surveys, LW2 & LW3, are centered at respectively 6.75 m (5-8 m) and 15 m (12-18 m) and were chosen because they cover the mid-IR emission from two different origins, the aromatic features and the hot dust continuum (see Section 3). Its pixel size is 6” in the most sensitive mode, for a FWHM PSF of 9” at 15 m, but its astrometric accuracy can reach 2” in the micro-scanning mode of the deepest surveys.
| Field Name | Area | Int. | depth | #7 | #15 | h | m | ∘ | ’ | |||||
| (’2) | (min) | (mJy) | ||||||||||||
| CAM parallel1 | 7 | 15 | 1.2e5 | 1.2e5 | 5 | 5 | 2.5 | 2.5 | 1e4 | 1e4 | - | |||
| ELAIS2 | 7 | 15 | 2e4 | 4e4 | 0.7 | 0.7 | 1 | 3 | 1104 | 1618 | - | |||
| LH Shallow⋆,a | - | 15 | - | 1944 | 3 | - | - | 0.72 (1) | - | 180 (80) | 10 | 52.08 | +57 | 21.07 |
| Comet Field3 | - | 12 | - | 360 | 10 | - | - | 0.5 | - | 37 | 03 | 05.50 | 09 | 35.00 |
| CFRS 14+524 | 7 | 15 | 100 | 100 | 18 | 11 | 0.3 | 0.4 | 23 | 41 | 14 | 17.90 | +52 | 30.52 |
| LH Deep⋆,a | 7 | 15 | 510 | 510 | 18 | 11 | 0.3 | 0.4 (0.6) | - | 166 (70) | 10 | 52.08 | +57 | 21.07 |
| CFRS 03+00a | 7 | 15 | 100 | 100 | 6 | 22 | 0.5 | 0.3 | - | - | 03 | 02.67 | +00 | 10.35 |
| MFB Deep⋆,a | 7 | 15 | 900 | 900 | 15.4 | 15.4 | 0.19 | 0.32 (0.4) | - | 180 (144) | 03 | 13.17 | 55 | 03.82 |
| A3705 | 7 | 15 | 31.3 | 31.3 | 42 | 42 | - | 0.26 | - | 18 | 02 | 39.83 | 01 | 36.75 |
| Marano UD⋆,a | 7 | 15 | 85 | 90 | 120 | 114 | 0.18 | 0.14 (0.2) | - | 142 (82) | 03 | 14.73 | 55 | 19.58 |
| MFB UD⋆,a | 7 | 15 | 89 | 90 | 120 | 114 | 0.08 | 0.14 (0.2) | 115 | 137 (100) | 03 | 13.17 | 55 | 03.82 |
| A22185 | 7 | 15 | 16 | 16 | 84 | 84 | - | 0.12 | - | 23 | 16 | 35.90 | +66 | 13.00 |
| HDF North⋆,6 | 7 | 15 | 10 | 24 | 116 | 135 | 0.05 | 0.1 | 7 | 44 | 12 | 36.82 | +62 | 12.97 |
| HDF South⋆,a | 7 | 15 | 28 | 28 | - | 168 | 0.05 | 0.1 | - | 63 | 22 | 32.92 | +60 | 33.30 |
| Deep SSA137 | 7 | - | 9 | - | 567 | - | - | - | - | - | 13 | 12.43 | +42 | 44.40 |
| LH PGPQ8 | 7 | - | 9 | - | 744 | - | 0.034 | 15 | - | 10 | 33.92 | +57 | 46.30 | |
| A2390⋆,9 | 7 | 15 | 5.3 | 5.3 | 432 | 432 | 0.026 | 0.054 | 32 | 31 | 21 | 53.57 | +17 | 40.18 |
ISOPHOT is an imaging photo-polarimeter covering the 2.5-240 m range. The most performant filter for extragalactic surveys is centered at 175 m (130-219 m) and uses the four pixels camera, C200, with a 92” side length and a 1.9’ FWHM PSF at 175 m.
| Field Name | Area | depth | h | m | s | ∘ | ’ | ” | ||||
|---|---|---|---|---|---|---|---|---|---|---|---|---|
| (sq.deg.) | (mJy) | |||||||||||
| ELAIS N11,2 | 90 | 175 | 2.6 | 3 | 0.1 | 0.1 | 16 | 10 | 01 | 54 | 30 | 36 |
| ELAIS N22 | 90 | 175 | 2.7 | 3 | 0.1 | 0.1 | 16 | 36 | 58 | 41 | 15 | 43 |
| MF FIRBACK2 | - | 175 | - | 1 | - | 0.1 | 03 | 11 | 00 | 54 | 45 | 00 |
The list of all ISOCAM extragalactic surveys performed during the ISO lifetime is given in the Table 1. We used 8 of them to produce the number counts in the Fig. 2 (from Elbaz et al 1999), for a total of 614 sources above an 80 completeness limit. The ISOPHOT number counts from Dole et al (1999) superimposed in the Fig. 2 (left) use 208 sources brighter than 100 mJy in 3 square degrees from the fields quoted in the Table 2. The ISOCAM and ISOPHOT surveys were performed in regions selected for their low Galactic foreground emission, both in the northern and southern hemispheres to avoid strong contamination from large-scale structure.
3 Origin of the infrared emission
The origin of the mid-IR emission of galaxies has been a subject of debate prior to IRAS, when evolved stars such as OH/IR stars were expected to play a major role. However, based on the IRAS Point Source Catalog, source counts at 12 m have shown that circumstellar dust shells accounted for only 10 of the 12 m emission in the Galaxy at (see Review by Cox & Mezger 1989). It is now established that except for ellipticals (with no dust lanes), the mid-IR emission of galaxies does not originate primarily from individual stars but rather from the light of young stars (or of an AGN) absorbed by dust and re-radiated in the mid-IR mostly at the interface between HII regions and molecular clouds (the photo-dissociation regions, PDR, see Cesarsky & Sauvage 1999 and references therein). The mid-IR spectrum of a galaxy can be divided into three components: a set of broadband aromatic features, with their underlying continuum, narrow forbidden lines of ionized gas (negligible in ISOCAM wide band imagery), and a hot thermal continuum due to very small grains (VSGs) of dust heated by stellar radiation at temperatures greated than 150 K. The broadband aromatic features have been proposed to originate either from PAHs (for Polycyclic Aromatic Hydrocarbons, Léger Puget 1984, Allamandola et al 1989) or from coal grains (Papoular 1999). In either case, they require the presence of aromatic structures, but their exact nature has not yet been definitively established. The low resolution spectra from ISOCAM have clearly established that in the wavelength range 5-8.5 m of the 7 m filter, the spectra of spiral and starburst galaxies were dominated by the aromatic broadband features located at 6.2, 7.7, 8.6, 11.3 and 12.7 m. At redshifts of the order of z0.8, the median redshift of the faint ISOCAM sources (see Section 4.2), the 15 m band is shifted to this region of the spectrum dominated by the aromatic features, with a contribution of hot dust continuum.

At larger wavelengths, the spectral energy distribution (SED) of a galaxy is progressively dominated by the thermal emission of larger grains heated at a lower temperature (around 60 K), which produces the bulk of the overall IR emission originating from dust (around 60-100 m). This ’cold’ dust dominates the IR emission measured by ISOPHOT. At 175 m, the physical origin of the emission remains the same up to high redshifts and is well-known to be correlated with star formation and radio activity (Helou, Soifer & Rowan-Robinson 1985).
The link between mid-IR and star formation (SF) is less straightforward, but only LIRGs can be detected at above 0.1 mJy at 15 m. Hence mid-IR surveys can at least pinpoint IR active galaxies. Moreover, a correlation was found between mid-IR and UV flux densities (Boselli et al 1997, 1998) as well as with (for the disks of spiral galaxies, Roussel et al, these proceedings). However, the complex link between mid-IR and SF is illustrated by the Fig. 1 (left), where we compare the SED of the ultra-LIRG Arp 220 and the nearby starburst M82, normalized by a factor 5 to reach the same energy density at 8 m. At z0.8, both galaxies would have the same 15 m flux density but differ by a factor 20 in the far-IR. But Arp220 is an extreme case which can easily be rejected as a candidate SED for the ISOCAM galaxies (see Section 4.2), and M82’s SED, which is more typical of most LIRGs () and ultra-LIRGs () although it is only , is probably a better candidate. Indeed, in the HDF-N seven galaxies, which were detected both at 15 m and in the radio (Richards et al 1998), show consistent SF rates if we use the SED of M82 to convert the mid-IR flux into a SF rate (Aussel et al 1999, in preparation).
4 Discussion about the 15 m results
4.1 The 15 m counts
The first striking result of the 15 m source counts is the consistency of the eight surveys (noted with a in the Table 1) over the full flux range (Fig. 2). Some scatter is nevertheless apparent; given the small size of the fields surveyed, we attribute it to clustering effects. The two main features of the observed counts are a significantly super-euclidean slope () from 3 to 0.4 mJy and a fast convergence at flux densities fainter than 0.4 mJy. In particular, the combination of five independent surveys in the flux range 90-400 Jy shows a turnover of the normalized differential counts around 400 Jy and a decrease by a factor at 100 Jy. We believe that this decrease, or the flattening of the integral counts, below 400 Jy, is real. It cannot be due to incompleteness, which was quantified using the Monte-Carlo simulations. The differential counts can be fitted by two power laws by splitting the flux axis in two regions around 0.4 mJy. In units of mJy-1 deg-2, we obtain, by taking into account the error bars ( is in mJy):
| (4) |
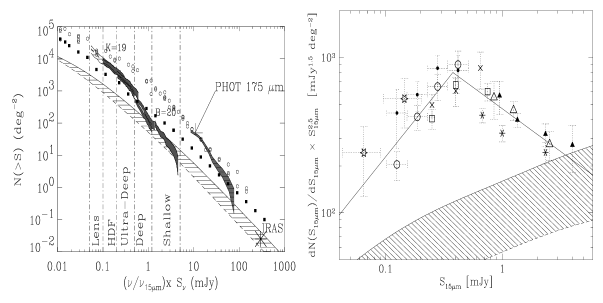
The total number density of sources detected by ISOCAM at 15 m down to 100 Jy (no lensing) is () arcmin-2. It extends up to () arcmin-2, down to 50 Jy, when including the lensed field of A2390 (Altieri et al 1999). The differential counts (Fig. 2 (right)), which are normalized to (the expected differential counts in a non expanding Euclidean universe with sources that shine with constant luminosity), present a turnover around =0.4 mJy, above which the slope is very steep (). No evolution predictions were derived assuming a pure k-correction in a flat universe (), including the effect of the aromatic features in the galaxy spectra. The lower curve of the hatched area, which materializes the ’no evolution’ region in the Fig. 2, is based on the Fang et al (1998) IRAS 12 m local luminosity function (LLF), using the spectral template of a relatively quiescent spiral galaxy (M51). The upper curve is based on the Rush, Malkan & Spinoglio (1993) IRAS-12 m LLF, translated to 15 m using as template the spectrum of M82, which is typical of most starburst galaxies in this band. More active and extincted galaxies, like Arp220, would lead to even lower number counts at low fluxes while flatter spectra like those of AGNs are less flat than the one of M51. In the absence of a well established LLF at 15 m, we consider these two models as upper and lower bounds to the actual no-evolution expectations; note that the corresponding slope is . The actual number counts are well above these predictions; in the 0.3 mJy to 0.6 mJy range, the excess is around a factor 10: clearly, strong evolution is required to explain this result (note the analogy with the radio source counts, Windhorst et al 1993).
For comparison, we have superimposed on Fig. 2 the optical B band (Metcalfe et al 1995) and near-IR K band (Gardner et al 1993) integral counts, normalized in terms of . For bright sources, with densities lower than 10 deg-2, these curves run parallel to an interpolation between the ISOCAM counts presented here and the IRAS counts; the bright K sources emit about ten times more energy in this band than a comparable number of bright ISOCAM sources at 15 m. But the ISOCAM integral counts present a rapid change of slope around 1-2 mJy, and their numbers rise much faster than those of the K and B sources. The sources detected by ISOCAM are a sub-class of the K and B sources which harbor activity hidden by dust.
4.2 Nature of the 15 m galaxies
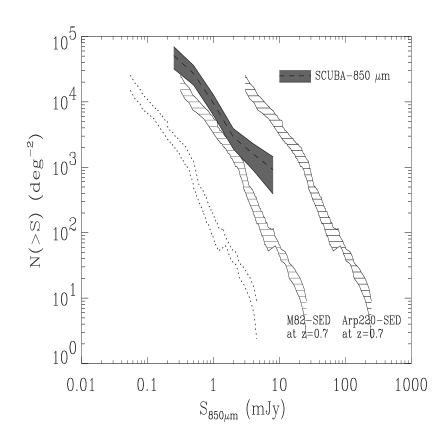
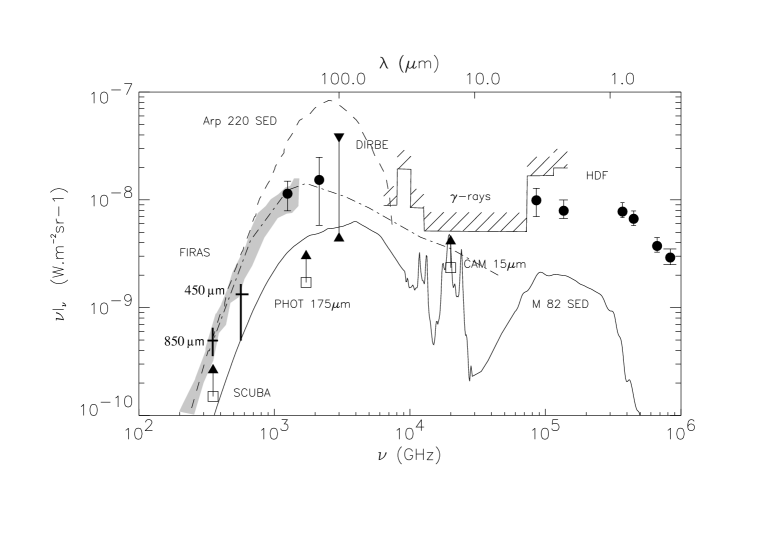
We believe, according to the results obtained on the HDF (Aussel et al 1999a,b) and CFRS fields (Flores et al 1999a,b, see also these proceedings), that the sources responsible for the ’bump’ in the 15 m counts are not the low mass faint blue galaxies which dominate optical counts and have a median redshift around z0.6 (Pozzetti et al 1998). Instead, they most probably are bright and massive galaxies whose emission occurs essentially in the IR and could account for a considerable part of the star formation in the universe at . Indeed, from the full sample of 15 m galaxies with known redshift and optical-near IR magnitudes, we found that these galaxies are massive () and that their emission occurs essentially in the IR. Their median redshift is z0.8 in a sample of 42 galaxies brighter than 0.1 mJy in the HDF+FF (Aussel et al 1999b) and z0.7 in a sample of 41 galaxies brighter than 0.35 mJy in the CFRS-1415 field (Flores et al 1999b). The assessment of their bolometric luminosity requires the assumption of a spectral energy distribution, which is largely uncertain since the ratio of the far-IR over mid-IR flux densities is highly variable among galaxies. However, one can set limits to the bolometric luminosity using the following arguments. If all galaxies had extreme SEDs like the one of Arp220, they would produce a contribution to the SCUBA-850 m number counts (see Blain et al 1999) much above observations (see Fig. 3). An Arp220-like SED can also be rejected for over-producing the 140 m EBL with respect to the one measured by DIRBE on-board COBE (see Fig. 4). The light radiated in the far-IR by these galaxies however cannot be much lower than that emitted at 15 m, since only galaxies luminous in the IR can be detected at z0.5 with a 15 m flux density larger than 0.1 mJy (the origin of the emission cannot be stellar without requiring excessive masses). We therefore estimate the mean bolometric luminosity of these galaxies to be of the order of a few .
The galaxies from the HDF-N plus Flanking Fields whose 15 m flux density is greater than 0.1 mJy (sensitivity limit of ISOCAM) harbour a IC-(H+K) color distribution very similar to that of the whole sample of galaxies for which we have access to both the IC-(H+K) colors and spectroscopic redshifts (see Fig. 1 (right)). Aussel et al (1999b and PhD thesis) showed that the sub-sample of galaxies with known spectroscopic redshift keeps the same color properties than the full sample of HDF+FF galaxies, hence we did not include a selection bias in the color distribution.
The median colors are IC-(H+K)= 2.3 for the 15 m galaxies and IC-(H+K)= 2 for all galaxies, hence only differ by 0.3 dex. However, the linear fit to the IC-(H+K) versus redshift plot of the two samples of galaxies in Fig. 1 (right) shows that the ’dusty’ galaxies tend to redden slightly faster with increasing redshift, than the natural reddening of the whole population of field galaxies which is due to k-correction: the color difference increases from 0.2 dex below z=0.7 to 0.4 dex above z=0.7. Nevertheless, this difference is not strong enough to allow one to separate the infrared galaxies from the whole sample like for Lyman-break galaxies (even accounting for the other set of optical colors existing for the HDF galaxies). The origin of this reddening with redshift is not clear but it is probably due to a selection of the galaxies suffering from more extinction, hence emitting more in the infrared, at larger redshifts.
Hence the population of galaxies producing the 15 m number counts excess is very distinct from the one which dominates the deep optical counts, known to be made of low mass galaxies with blue luminosities, although at similar redshifts. In other words, the star formation activity responsible for the light emitted by the 15 m galaxies is not the other face of the same star formation activity already quantified from the optical surveys, but instead it should be considered as a second component, which was previously missed.
5 Discussion about the 175 m results
5.1 The 175 m counts
As for the 15 m ISOCAM counts, the 175 m ISOPHOT counts present a strong excess with respect to IRAS of about one order of magnitude (Puget et al 1999, Dole et al 1999). The slope of the integral counts is , hence much above the Euclidean value of -1.5, and far from flattening, contrary to the ISOCAM counts which go deep enough to detect the beginning of the flattening, with a slope decreasing from -2.4 around 0.5 mJy to -1.2 around 0.1 mJy. It is therefore natural that the detected sources account only for 10 of the CIRB measured by COBE (see Fig. 4).
5.2 Nature of the 175 m galaxies
The search for optical counterparts to the ISOPHOT-175 m galaxies is not an easy task because of the large uncertainty on the position of the ISOPHOT sources and of the absence of a clear optical signature. Hence the use of other wavelengths with better spatial resolution and sensitivity to the IR activity is mandatory in this study. Because of the good radio/far-IR correlation, the radio domain is an obvious candidate and VLA surveys of the northern fields (ELAIS N1 & N2) have been carried out by Ciliegi et al (1999) in the framework of the ELAIS project (Rowan-Robinson et al 1999). A sample of ten 21 cm radio counterparts of the ISOPHOT galaxies, i.e. with , have been selected for their high ratio by Scott et al (1999) for a follow-up at 450 and 850 m with SCUBA. Assuming a dust temperature of , they find a range of low to moderate redshifts of (no spectroscopic redshift are available yet), when accounting for the SCUBA measurements or upper limits together with the ISOPHOT ones.
In these two fields, the ISOCAM surveys are not sensitive enough to strongly constrain the SED of the ISOPHOT galaxies and miss the majority of them (). In the southern field however (called MFB, for ’Marano FIRBACK’ since it is shifted with respect to the original Marano Field, Marano, Zamorani & Zitelli, 1988, in order to minimize the foreground Galactic cirrus emission), deep ISOCAM surveys have been performed over 0.5 square degree down to 0.3 mJy (and a completeness limit of ). Half of the 24 FIRBACK galaxies in the field have a counterpart, sometimes several, at 15 m above and closer than 30” (except one at 50”). One can compare their ratio to the one of any template SED at any redshift and determine a possible redshift range for this SED. The striking result of this study is that none of the 12 galaxies present any 15 m counterpart compatible with the SED of M82 at any redshift (unless they are brighter than ), while all but one of them are consistent with an Arp220-like galaxy of similar luminosity () and at a redshift between z=0.1-0.4. For the remaining 12 galaxies, they could be compatible with an M82-like SED for and or with an Arp220-like SED (though fainter), if only their redshift is larger than . In any case, the FIRBACK galaxies are most probably LIRGs or ULIRGs and their large number density implied by the number counts implies a strong evolution of this population of galaxies with respect to IRAS, consistently with ISOCAM, although the 175 m galaxies are most probably brighter than the 15 m ones.
6 Conclusion
The ISO extragalactic surveys have demonstrated the fundamental role of IR in the understanding of galaxy evolution. However, only ground-based follow-ups will allow us to understand the nature of the population of galaxies responsible for the strong evolution exhibited by the IR number counts. Are they particularly rich in metals ? Do they harbor active galactic nuclei ? We have a large enough sample of galaxies to be able to quantify the evolution of the luminosity function in the IR as a function of redshift. However, we are still far from understanding the origin of the huge cosmic IR background revealed by COBE, but SIRTF and FIRST are still to come…
References
- [1] Allamandola, L.J., Tielens, A.G.G.M., Barker, J.R., 1989, ApJS 71, 733
- [2] Altieri, B., Metcalfe, L., Kneib, J.P., 1999, A&A 343, L65
- [3] Aussel, H., Cesarsky, C., Elbaz, D., Starck, J.L., 1999a, A&A 342, 313
- [4] Aussel H., Elbaz D., Désert F.X. et al, 1999b, in Cox, P., Kessler, M.F. (eds.), The Universe as seen by ISO, ESA SP-427, p. 1023
- [5] Barger, A.J., Cowie, L.L., Trentham, N., et al, 1999, AJ 117, 102
- [6] Blain et al, 1999, to appear in ‘The Hy-redshift universe’, eds A. Bunker & W. van Breughel, astro-ph/9908111
- [7] Boselli, A., Lequeux, J., Contoursi, A., et al, 1997, A&A 324, L13
- [8] Boselli, A., Lequeux, J., Sauvage, M., et al, 1998, A&A 335, 53
- [9] Cesarsky, C., Abergel, A., Agnèse, P., et al, 1996, A&A 315, L32
- [10] Cesarsky, C., Sauvage, M., 1999, ’Millenium Conference on Galaxy Morphology’ (D. Block, I. Puerari, A. Stockton, dW. Ferreira Eds), Johannesburg, South Africa, astro-ph/9909369
- [11] Ciliegi, P., MacMahon, R.G., Miley, G., et al, 1999, MNRAS 302, 222
- [12] Clements, D.L., Désert, F.X., Franceschini, A., et al, 1999, A&A 346, 383
- [13] Cox, P., Mezger, P.G., 1989, A&AR 1, 49
- [14] Elbaz, D., Cesarsky, C.J., Fadda, D., et al, 1999, A&AL, in press, astro-ph/9910406
- [15] Fall, S., Charlot, S., Pei, Y.C., 1996, ApJ, 464, L43
- [16] Fang, F., Shupe, D., Xu, C., Hacking, P., 1998, ApJ 500, 693
- [17] Fixsen, D.J., Dwek, E., Mather, J.C., et al, 1998, ApJ 508, 123
- [18] Flores, H., Hammer, F., Désert, F.X., et al, 1999a, A&A 343, 389
- [19] Flores, H., Hammer, F., Thuan, T., et al, 1999b, ApJ 517, 148
- [20] Gardner, J.P., Cowie, L.L., Wainscoat, R.J., 1993, ApJ 415, L9
- [21] Hauser, M.G., Arendt, R.G., Kelsall, T., 1998, ApJ 508, 25
- [22] Helou, G., Soifer, B.T., Rowan-Robinson, M., 1985, ApJ 298, L7
- [23] Kessler, M., Steinz, J., Anderegg, M., et al, 1996, A&A 315, L27
- [24] Lagache, G., Abergel, A., Boulanger, F., et al, 1999, A&A 344, 322
- [25] Léger, A., Puget, J.L., 1984, A&A 137, L5
- [26] Lemke, D., Klaas, U., Abolins, J., et al, 1996, A&A 315, L64
- [27] Lilly, S., Le Fèvre, O., Hammer, F., et al, 1996, ApJ 460, L1
- [28] Madau, P., Ferguson, H., Dickinson, M., et al, 1996, MNRAS 283, 1388
- [29] Marano, B., Zamorani, G., Zitelli, V., 1988, MNRAS 232, 111
- [30] Metcalfe, N., Shanks, T., Fong, R., et al, 1995, MNRAS 273, 257
- [31] Metcalfe, L., Altieri, B., McBreen, B., et al, 1999, in ’The universe as seen by ISO’, eds P.Cox and M.F.Kessler, UNESCO, Paris, ESA SP-427, p. 1019, astro-ph/9901147
- [32] Papoular, R., 1999, AA 346, 219
- [33] Pozzetti, L., Madau, P., Zamorani, G., Ferguson, H.C., Bruzual, G.A., 1998, MNRAS, 298, 1133
- [34] Puget, J.L., Abergel, A., Bernard, J.P., et al, 1996, A&A 308, L5
- [35] Puget, J.L., Lagache, G., Clements, D.L., et al, 1999, A&A 345, 29
- [36] Richards, E.A., Kellerman, K.L., Fomalont, E.B., Windhorst, R.A., Partridge, R.B., 1998, AJ 116, 1039
- [37] Rowan-Robinson, M., Oliver, S., Efstathiou, A., et al, 1999, in ’The universe as seen by ISO’, eds P.Cox and M.F.Kessler, UNESCO, Paris, ESA SP-427, astro-ph/9906273
- [38] Rush, B., Malkan, M.A., Spinoglio, L., 1993, ApJS 89, 1
- [39] Sanders, D.B., Mirabel, I.F., 1996, Ann. Rev. Astron. Astrophys. 34, 749
- [40] Scott, D., Lagache, G., Borys, C., et al, 1999, submitted to A&A, astro-ph/9910428
- [41] Siebenmorgen, R., Abergel, A., Altieri, A., et al, 1996, A&A 315, L69
- [42] Soifer B.T., Neugebauer G., 1991, AJ 101, 354
- [43] Taniguchi, Y., et al, 1997a, ’Taking ISO to the Limits’, Laureijs R. & Levine D. (ESA)
- [44] Taniguchi, Y., Cowie, L.L., Sato, Y., Sanders, D., Kawara, K., 1997b, A&A 328, L9
- [45] Windhorst, R.A., Fomalont, E.B., Partridge, R.B., Lowenthal, J.D., 1993, ApJ 405, 498