The Sgr A∗ Stellar Cluster:
New NIR Imaging and Spectroscopy
Abstract
We report preliminary results based on new near-infrared observations of the central stellar cluster of our Galaxy conducted with the infrared spectrometer ISAAC at the ESO VLT UT1 and the MPE speckle camera SHARP at the ESO NTT. We obtained / 3000 K-band spectroscopy of the 2.058 m He I, 2.165m Br emission lines, and 2.29 m CO bandhead absorption line. These data demonstrate clearly that there is no strong CO bandhead absorption originating in the northern part (S1/S2 area) of the central stellar cluster at the position of Sgr A∗. This makes it likely that these K14.5 stars are O9 - B0.5 stars with masses of 15 to 20 M⊙. Weaker CO bandhead absorption in the southern part of the cluster (S10/S11 area) could be due to contributions from neighbouring stars. We also report the detection of Br line emission at the position of the central stellar cluster which could be associated with the ’mini-spiral’ rather than with the Sgr A∗ cluster itself. At the NTT we obtained another epoch epoch of proper motion measurments. The changes of source positions are consistent with the proper motion velocities derived from earlier epochs.
Key Words.:
galaxy:center – galaxies:nuclei – infrared:galaxies – infrared:stars1 Introduction
Recent investigations of the motions of gas and stars have provided evidence for the existence of massive black holes in the nuclei of many galaxies (Richstone et al. 1998, Magorrian et al. 1998, Kormendy and Richstone 1995). One of the best cases is the center of our Galaxy itself. There both the gas and stellar dynamics indicate the presence of a large unresolved central mass ( Eckart and Genzel 1996, 1997, Genzel et al. 1997, Ghez et al. 1998, Genzel et al. 1999). At its measured mass and density it cannot be stable and therefore is most likely present in the form of a massive black hole (Maoz 1998). The proximity of only 8 kpc to the Galactic Center allows us to obtain line-of-sight velocities (through spectroscopy) and/or proper motions of individual stars that are within only a few light days of the radio/near-infrared position of Sgr A∗ (Menten et al. 1997). The positions of the maximum velocity dispersion and of the maximum stellar surface density agree with the position of the compact radio source Sgr A∗ to within 0.1” (Ghez et al. 1998). Combined with stellar surface density counts these data provide a convincing qualitative evidence for the presence of a central point mass ranging between 2.2 and 3106 M⊙ (Sellgren et al. 1990, Krabbe et al. 1995, Haller et al. 1996, Genzel et al. 1996, 1997, Eckart and Genzel 1996, 1997, Ghez et al. 1998, Genzel 1999).
Genzel et al. (1997) reported first R=/35 speckle spectroscopy measurements on individual objects in the central 1” diameter stellar cluster at the position of Sgr A∗(IR). In combination with other data this spectroscopic information can be used to derive a lower limit to the mass associated with the compact radio source. Here we present very first ISAAC R3000 K-band spectroscopy of the Sgr A∗ stellar cluster in the 2.058 m He I, 2.165m Br emission lines, and the 2.29 m CO bandhead absorption lines. The combination of these spectroscopic data taken in excellent seeing (0.3” to 0.5”) and our new speckle image reconstructions based on SHARP NTT data strengthen the case for a compact mass and add to our understanding of the stellar population near the center of the Galaxy.
2 Observations and Data Reduction
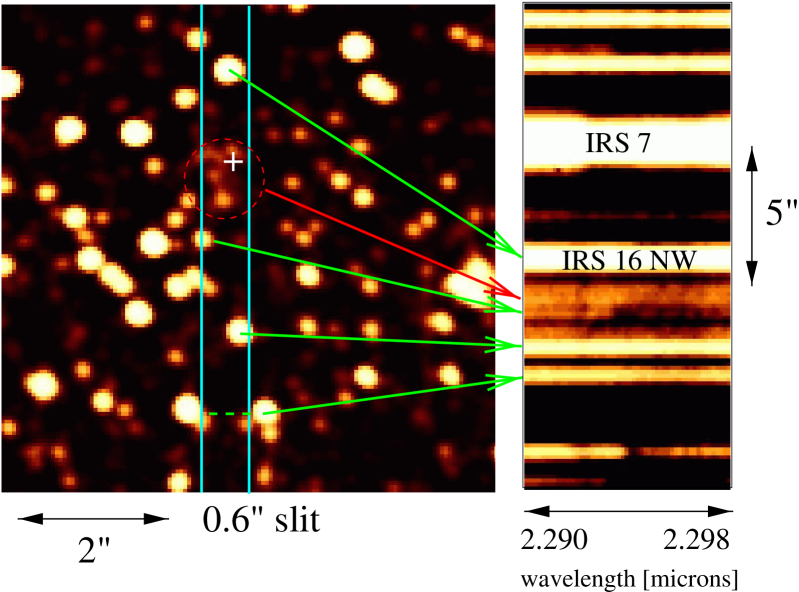
The spectroscopic observations were carried out in the first half nights of 30 June and 1 July, 1999, using the infrared (0.9-5m) spectrometer ISAAC (Moorwood et al. 1998) at one Nasmyth focus of the ESO VLT UT1 (ANTU). The conditions during the first and most of the second half night were photometric with a relative humidity below 10%-20%, and low wind from northerly directions. The seeing indicated by the optical seeing monitor was always between 0.4” and 0.6” resulting an infrared seeing than was always better that 0.5” and in part 0.3”. The very good seeing conditions allowed us to use a 0.6” slit. We observed with two different slit position angles such that always both the central stellar cluster at the position of Sgr A∗ and one of the neighboring bright sources IRS 16 NW (at a PA of 0o N-E) or the bright star between IRS 16 CC and IRS 16 NW (at a PA of 108o N-E) were along the slit. In all acquisition images (2 seconds exposures through a 1% band filter centered at 2.09m) the small stellar cluster surrounding Sgr A∗ could easily be identified and was positioned on the slit. Between the exposures the slit position was checked on the direct acquisition images and/or on the two dimensional spectroscopic frames. For each of the three lines (2.058 m He I, 2.165 m Br, and 2.29 m CO(2-0)) we obtained a total of about 8 times 5 minutes integration time per slit setting. Since the field is very crowded with stars we took in addition to other calibration data separate sky exposures on a dark cloud 713 W and 400 N of the central position. We subtracted darks from all exposures, applied a flatfield, conducted a sky-subtraction allowing for small pixel shifts and a scaling factor to achieve optimum sky line subtraction. The wavelength calibration was done using lamp exposures and the OH sky lines. As a spectroscopic reference we used the He I star IRS 16NE for the CO bandhead measurements and the late type star 12.05” north of IRS 7 for the Br and He I measurements. These stars are bright and featureless in the corresponding wavelength domains.
The diffraction limited imaging data were obtained using the MPE speckle camera SHARP at the ESO NTT between 18 to 21 June. On the night from the 19 to 29 June the seeing conditions were excellent. For most of the night the optical seeing monitor indicated seeing values below 0.5”. During the first and third night the seeing ranged between 0.5” and 1”. We collected several thousand short exposure frames (0.3 to 0.5 seconds integration time). The data were then processed in the standard manner (dead pixel correction, sky subtraction, flatfielding etc.). We then co-add the 2562 pixel frames using the brightest pixel in the seeing disks of IRS7 or IRS16 NE as shift-and-add reference. This is followed by CLEANing the raw shift-and-add images with the Lucy-Richardson (Lucy 1974) algorithm using IRS7/IRS16 NE as a point spread function. We finally re-convolve the resulting maps with a Gaussian restoring beam, which had a FWHM near the diffraction limit of the telescope.
3 Preliminary Spectroscopic Results
The goal of the spectroscopic observations was to obtain high spectral resolution information on the stars in the central arcsecond. The problem is, that very good seeing is required in order to separate the small flux contribution of the typically K=14.5-15.0 sources from the very bright neighboring IRS 16 complex which contains stars as bright as K=10. The excellent seeing conditions we encountered at the VLT allowed us to obtain this information basically without having to correct for the seeing wing contribution of these bright neighboring objects. Here we concentrate on two preliminary results: the confirmation of the absence of strong CO bandhead absorption in the central stellar cluster and the Br emission we found towards this region.
3.1 CO bandhead absorption
In Fig.1 we compare our new June 1999 speckle image reconstruction with a section of the two dimensional ISAAC spectroscopic exposure on the CO(2-0) bandhead absorption line. This comparison clearly demonstrates the excellent seeing we had at the VLT and allows us to identify the individual sources that contributed to the flux density in the 0.6” slit. One can distinguish between the northern and southern part of the Sgr A∗ stellar cluster as well as a star to the south with obvious bandhead absorption. In Fig.2 we show spectra of the northern and southern part of the Sgr A∗ cluster as well as the spectrum of a star just 1.12” south of the central position. The spectra clearly show the complete absence of strong CO bandhead absorption for the northern S-sources close to the position of Sgr A∗ and the detection of a late type star just 0.6” south of the S10 and S11 (Genzel et al. 1997). Very weak bandhead absorption on the northern Sgr A∗ cluster is in agreement with an expected contribution from the underlying stellar cluster. The bandhead absorption on the southern part of the central stellar cluster is probably due to a significant flux density contribution from the late type star just 0.6” to the south and 0.5” to the east of S10 and S11. In addition there are a few weaker sources with separations from S10 and S11 of less than 0.4” that could give rise to contaminating flux. These measurements are in full agreement with our initial results that we obtained via R 35 speckle spectroscopy measurements on the individual objects S1, S2, S8, and S11. It also indicates that most of the other S-sources that now fell in our slit can not be stars with strong CO bandhead absorption.
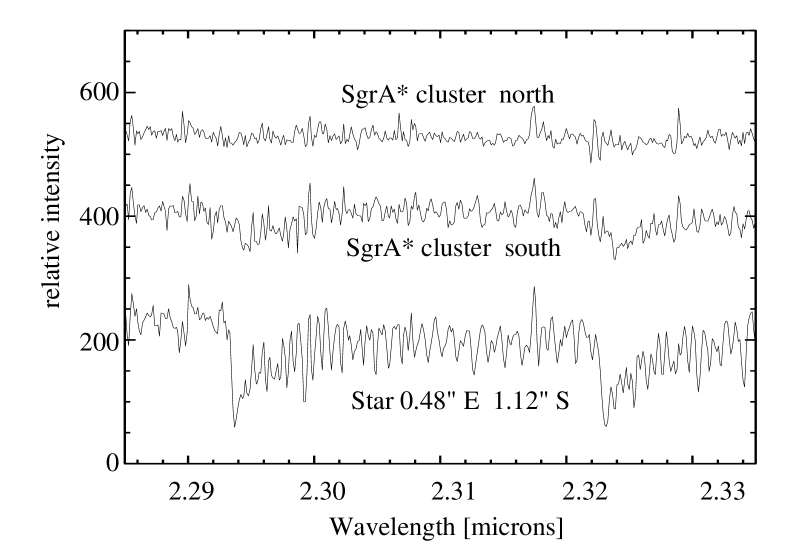
From this data one can conclude that the mK14.5 sources in the central Sgr A∗ cluster are most likely moderately luminous (L5,000 to 10,000 L⊙) early type stars. If these objects are on the main sequence they would have to be O9 - B0.5 stars with masses of 15 to 20 M⊙.
Backer (1996) and Reid et al. (1999) have shown that the proper motion of Sgr A∗ itself is 16-20 km/s which is close to 2 orders of magnitudes smaller than the velocity of the fast moving stars in its vicinity. N-body simulations using 20 M⊙ as an upper limit of the mass distribution of these high velocity stars result in a lower limit of 103 M⊙ for Sgr A∗ (Reid et al. 1999, see also Genzel et al. 1999, 1997). If this mass is enclosed within the radio size of Sgr A∗ ( 1 AU) this already implies a central mass density larger than 1018 M⊙/pc-3.
3.2 Br and He I emission
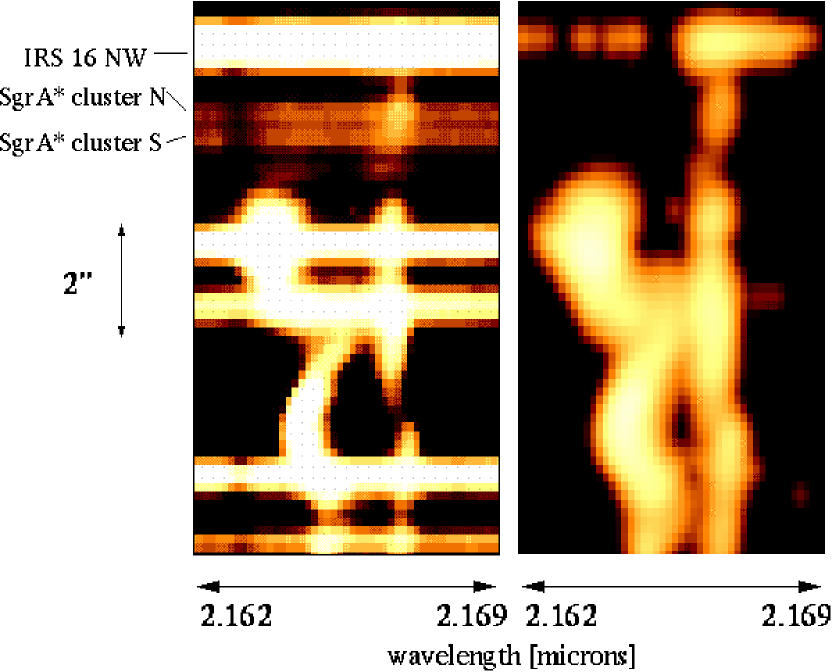
Our high spatial and spectral resolution data clearly show the presence of Br and He I emission which is apparently spatially coincident with the location of the Sgr A∗ central stellar cluster. From our Br data (see Fig.3) we find a line width of 120 km/s and a velocity gradient of about 35 km/s between the southern part (S10/S12-region) and the northern part (S1/S2-region) of the cluster. In both slit settings this line emission appears to be connected to the more extended line emission over the remaining central cluster. This fact combined with the small line width at any position in that region indicates that the emitting gas is not necessarily associated with the Sgr A∗ stellar cluster. If the emission would be associated with the cluster we would expect a larger line width due to the higher gravitational potential indicated by the rapid motions of the stars. However, we cannot exclude at the present stage of the data reduction any broad and weak emission components that would indicate a higher velocity dispersion.
4 First 1999 Speckle Imaging Results
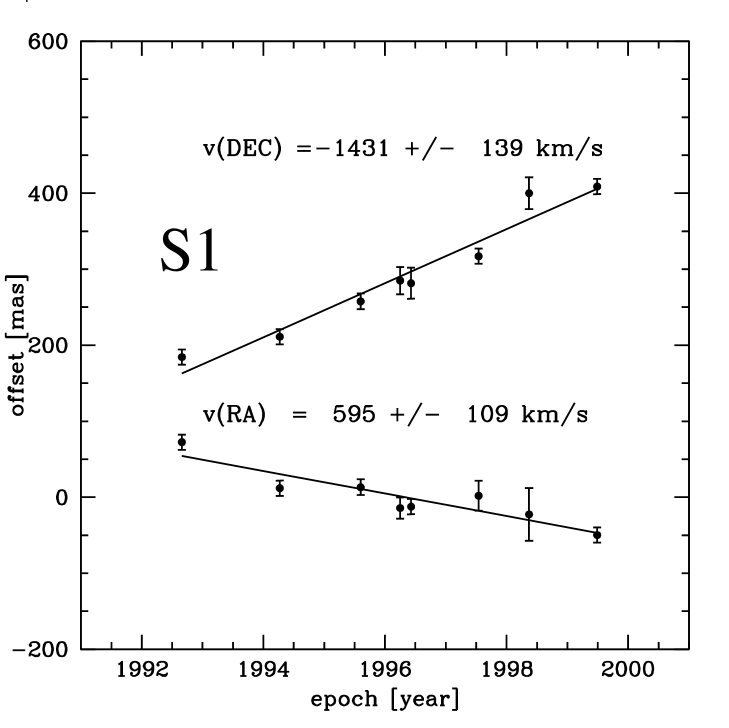
Only about 10 days before our spectroscopic measurements we obtained new diffraction limited speckle imaging data at the NTT. These data mainly serve as a new proper motion epoch (Genzel et al. 1997, Eckart and Genzel 1996, 1997, Ghez 1998) but also allows us to further investigate the structure of extended sources and to search for variability of the individual objects (Ott, Eckart, Genzel 1999). Due to the short time difference between the speckle imaging and the spectroscopic measurements we know the brightness and exact positions of all the prominent Sgr A∗ cluster members that contribute to the observed flux in the slit we used during our spectroscopic measurements. In Fig.4 we show our new proper motion determination of the fastest moving source S1 close to the position of the compact radio source Sgr A∗.
5 Conclusions
We have presented new high angular and high spectral resolution data obtained with the infrared spectrometer ISAAC at the VLT UT 1 and SHARP at the NTT. Our new spectra prove the lack of strong CO bandhead absorption on the fast moving stars in the direct vicinity of the compact radio source Sgr A∗. The new results are fully consistent with the most recent work on the central mass distribution (Genzel et al. 1999, Ghez et al. 1998, Eckart and Genzel 1996, 1997, Genzel et al. 1997, Eckart and Genzel 1997). These new results further strengthen the very convincing case for a large compact mass at the center of the Galaxy and indicate that its most likely current configuration is an inactive black hole (Maoz 1998).
Acknowledgements: We thank A. Ghez, M. Morris, S.R. Stolovy, and M. Lehnert for interesting discussions and comments. We are also grateful to the VLT UT1- and the NTT-team and especially to U.Weidenmann and H.Gemperlein for their interest and technical support of SHARP at the NTT.
References
- (1) Backer, D.C. 1996, in Unsolved Problems of the Milky Way, eds. L.Blitz and P.Teuben, Proc. of IAU 169 (Kluwer:Dordrecht), 193
- (2) Eckart, A. and Genzel, R. 1996, NATURE 383, 415
- (3) Eckart, A. and Genzel, R. 1997, MNRAS 284, 576
- (4) Genzel, R., Thatte, N., Krabbe, A., Kroker, H. and Tacconi-Garman, L.E. 1996, Ap.J.472, 153
- (5) Genzel, R., Eckart, A., Ott, T. and Eisenhauer, F. 1997, MNRAS 291, 219
- (6) Genzel, R., Pichon, C., Eckart, A., Gerhard, O. and Ott, T., 1999, submitted to MNRAS.
- (7) Ghez, A., Klein, B., Morris, M. and Becklin, E., 1998, Ap.J. 509, 678
- (8) Haller, J.W., Rieke, M.J., Rieke, G.H., Tamblyn, P., Close,L. and Melia,F. 1996, Ap.J. 456, 194
- (9) Kormendy, J. and Richstone, D. 1995, Ann.Rev.Astr.Ap.1995, 581
- (10) Krabbe, A. Genzel, R., Eckart, A., Najarro, F., Lutz, D. et al. 1995, Ap.J.Lett. 447, L95
- (11) Lucy,L.B., 1974, A.J. 79, 745
- (12) Magorrian, J. et al. 1998, A.J. 115, 2285
- (13) Maoz, E. 1998, Ap.J. 494, L131
- (14) Menten, K.M., Eckart, A., Reid, M.J. and Genzel, R. 1997, Ap.J. 475, L111
- (15) Moorwood, A., et al. 1998, The Messenger 94, 7
- (16) Ott, T., Eckart, A. and Genzel, R. 1999, Ap.J. in press
- (17) Reid, M.J., Readhead, A.C.S., Vermeulen, R.C., Treuhaft, R.N. 1999, in The Central Parsec, 1998 Tucson Galactic Center Wokshop, eds. H.Falcke, A.Cotera, W.Duschl, F.Melia and M.Rieke, ASP conf. Series, in press
- (18) Richstone, D. et al. 1998, NATURE 395, 14
- (19) Sellgren, K., McGinn, M.T., Becklin, E.E. and Hall, D.N.B. 1990, Ap.J. 359, 112